APRA released a brief update to support their zero Countercylical Capital Buffer setting. As they say “the countercyclical capital buffer is designed to be used to raise banking sector capital requirements in periods where excess credit growth is judged to be associated with the build-up of systemic risk. This additional buffer can then be reduced or removed during subsequent periods of stress, to reduce the risk of the supply of credit being impacted by regulatory capital requirements”.
APRA may set a countercyclical capital buffer within a range of 0 to 2.5 per cent of risk weighted assets. On 17 December 2015, APRA announced that the countercyclical capital buffer applying to the Australian exposures of authorised deposit-taking institutions (ADIs) from 1 January 2016 would be set at zero per cent. An announcement to increase the buffer may have up to 12 months’ notice before the new buffer comes into effect; a decision to reduce the buffer will generally be effective immediately.
APRA reviews the level of the countercyclical capital buffer on a quarterly basis, based on forward looking judgements around credit growth, asset price growth, and lending conditions, as well as evidence of financial stress. APRA takes into consideration the levels of a set of core financial indicators, prudential measures in place, and a range of other supplementary metrics and information, including findings from its supervisory activities. APRA also seeks input on the level of the buffer from other agencies on the Council of Financial Regulators.
A range of core indicators are used to justify their position. Here are their main data-points.
Credit growth
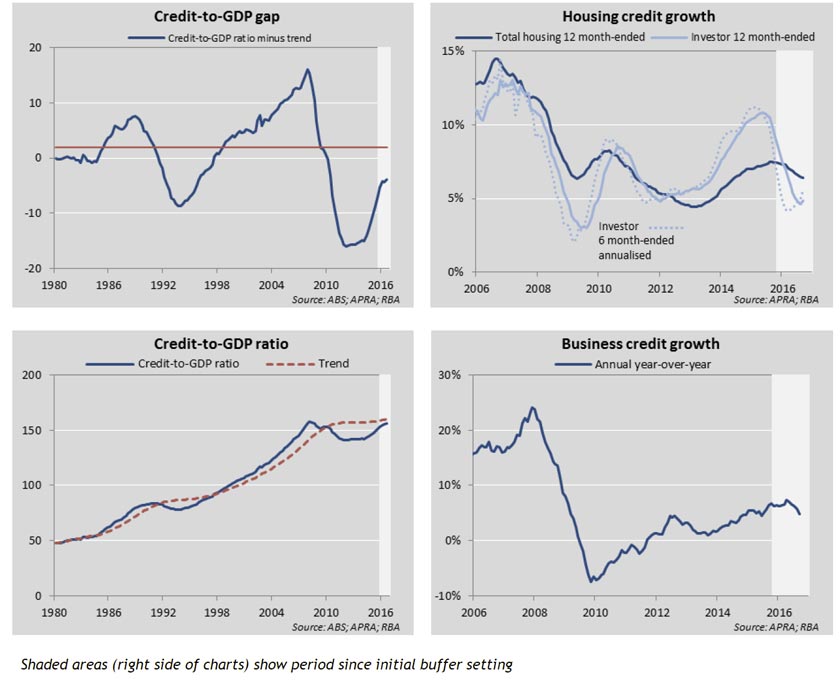
Credit-to-GDP ratio (level, trend and gap)
The credit-to-GDP gap is defined as the difference between the credit-to-GDP ratio and its long-run trend. The long-run trend is calculated using a one sided Hodrick-Prescott filter, a tool used in macroeconomics to establish the trend of a variable over time. The credit-to-GDP gap for Australia is currently negative at -3.9. The Basel Committee suggests that a gap level between 2 and 10 percentage points could equate to a countercyclical capital buffer of between 0 and 2.5 percent of risk-weighted assets.
Housing credit growth
The pace of housing credit growth has slowed this year, growing at 6.4 per cent year on year as at September 2016, down from 7.5 per cent at the time the buffer was initially set. Investor housing credit growth fell from 10 per cent to 4.9 per cent over the same period, however the pace of growth has been increasing again more recently. APRA has identified strong growth in lending to property investors (portfolio growth above a threshold of 10 per cent) as an important risk indicator for APRA supervisors.
Business credit growth
Business credit growth increased marginally in the first half of 2016. However, business credit growth has fallen over recent quarters; annual growth in business credit was 4.8 per cent over the year to end September 2016, down from 6.3 per cent as at September 2015. Notwithstanding the lower overall rate of growth, commercial property lending growth (not shown) has remained strong, growing 10.5 per cent year on year as at September 2016.
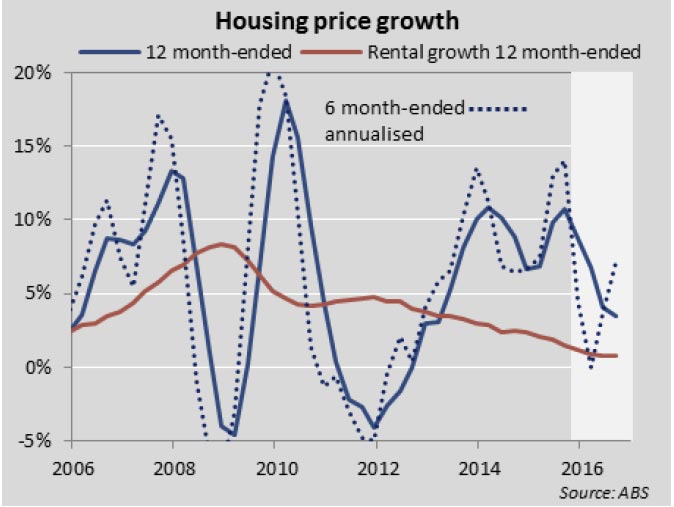
 Asset Prices
National housing price growth remains strong, but has slowed relative to 2015 peaks, growing nationally at around 3.5 per cent over the 12 months to September 2016. However, over a shorter horizon, prices have been reaccelerating recently with six month-ended annualised price growth of 7.2 per cent nationally as at September 2016 (albeit still a slower pace than 2015 peaks). Conversely, rental growth and household income growth have been relatively weak. Looking beyond the national averages, conditions vary significantly across individual cities and regions. In particular, housing price growth has strengthened in Sydney and Melbourne over recent months with six month-ended annualised growth rates of 11.4 per cent and 9.0 per cent respectively.
Non-residential commercial property has also been exhibiting strong price growth, though this has moderated somewhat in recent months (not shown).
 Lending indicators
APRA monitors a range of data and qualitative information on lending standards. For residential mortgages, the proportion of higher-risk lending is a key metric. Over the past few years, APRA has heightened its regulatory focus on the mortgage lending practices of ADIs in order to reinforce sound lending practices. This has included, but not been limited to, the introduction of benchmarks on loan serviceability and investor lending growth, and the issuance of a prudential practice guide on sound risk management practices for residential mortgage lending.
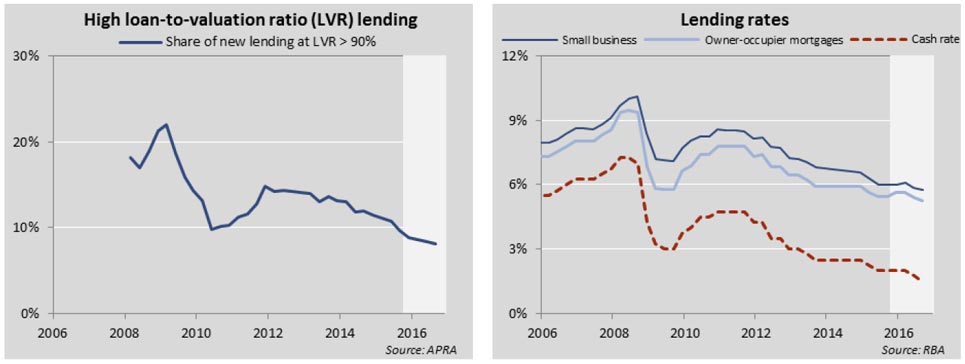
In general, higher-risk mortgage lending has been falling recently with the share of new lending at loan-to-valuation ratios greater than 90 per cent falling from 9.5 per cent to 8.1 per cent over the year to September 2016. Other forms of higher-risk mortgage lending including high loan-to-income and interest-only lending (not shown) have also moderated from 2015 peaks, although there has been some pick-up in the share of interest-only lending recently.
In business lending, banks have showed some evidence of tightening lending standards more recently, in particular for commercial property lending, with the lowering of loan-to-valuation and loan-to-cost ratios on certain development transactions (not shown).
Lending rates had been steadily falling for both housing and business lending to historical lows. More recently however, lending rates have fallen by less than the cash rate, with banks passing on around half of the August cash rate reduction. Lending rates have also risen in recent weeks in response to higher costs in wholesale funding markets. In particular, a number of ADIs have recently announced increases to their mortgage lending rates with some ADIs specifically targeting investor and interest-only loans.
APRA’s confidential quarterly survey of credit conditions and lending standards provides qualitative information on whether conditions are tightening or loosening in the industry.
Financial Stress
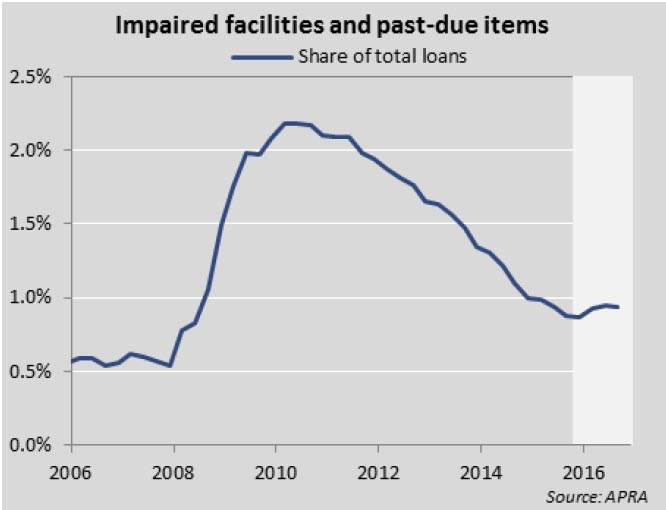
Indicators of financial stress are used in informing decisions to release any countercyclical capital buffer. While a wide range of indicators could signify a deterioration in conditions, APRA has identified non-performing loans as its core indicator of financial stress.
The share of non-performing loans remains low, though it has increased moderately over 2016, to 0.93 per cent as at September 2016, largely driven by increases in regions and sectors with exposures to mining.
So, everything is looking rosy, in their view. However, the high household debt to income ratio and the fact that debt servicing is supported by ultra low interest rates is not included adequately in their assessment – seems myopic in my view, but then this continues the regulatory group-think. In addition the use of “confidential quarterly survey data” highlights the lack of industry disclosure.


