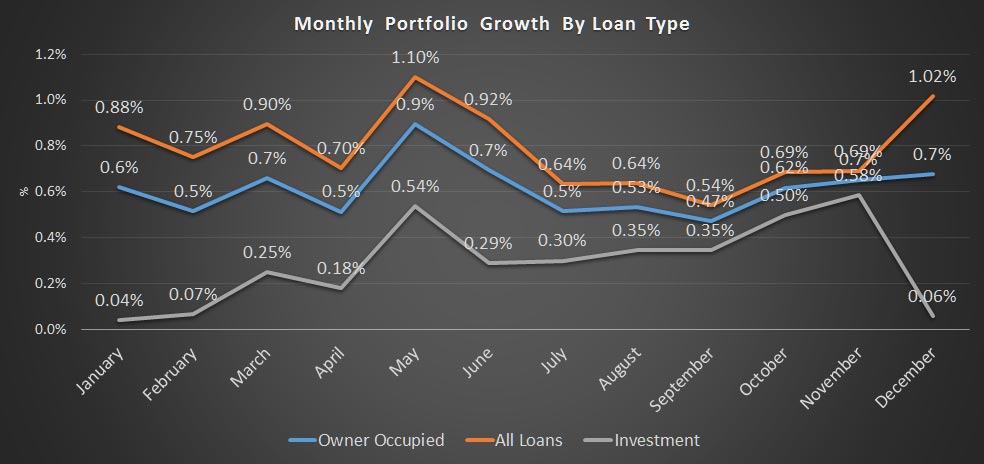
APRA has released their monthly banking statistics, which shows the portfolio movements of the major banks. Total lending for housing was up 0.68% to $1.52 trillion, with owner occupied lending up 1% to $987 billion and investment lending up 0.06% to $537 trillion. But there are adjustments in these numbers which make them pretty useless, especially when looking at the mix between investment and owner occupied loans.
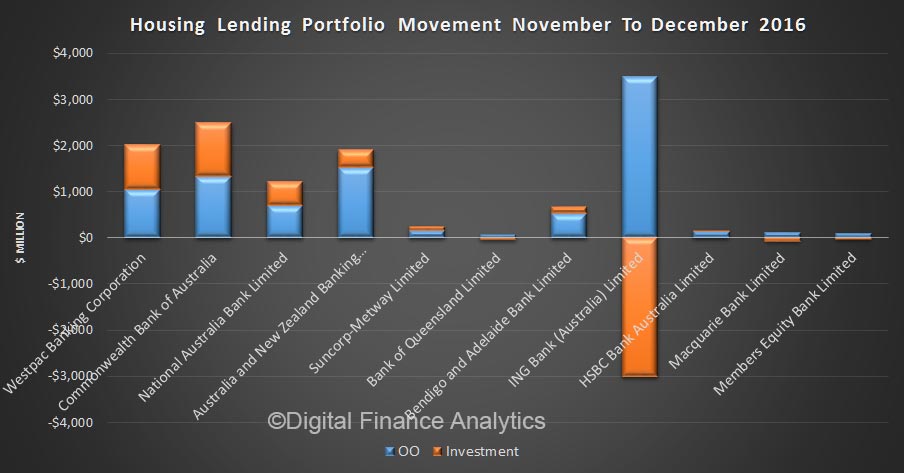
 The trend here is quite different from the RBA data also out today, which showed growth of 0.8% for investment loans and 0.4% for owner occupied loans (and includes non-banks in these totals). A quick look at the monthly movements shows that there was a significant ($3bn+) adjustment at ING, which distorts the overall picture. No explanation from APRA, and this movement is much bigger than the $0.9 billion net figure the RBA mentioned in their release.
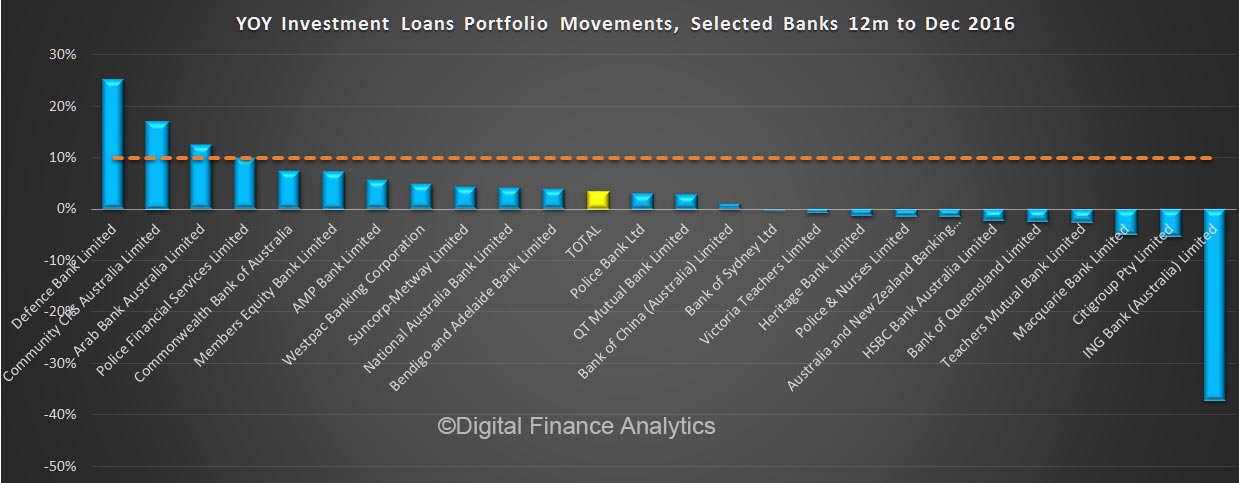
 For what it is worth, here is the sorted 12 month growth trend by lending, showing the 10% “hurdle”. ING is to the right of the chart thanks to their adjustment.
 But the point is, we really do not know where we stand as i) data quality from the banks is still poor, and ii) the regulators are unable to provide a reconciled and transparent picture of lending. Given the debate about housing affordability, we need better and consistent data to aid the debate.
