The latest data from our rolling household surveys reveals that the pressure on many households continues to build, despite the headline news of a booming recovery and jobs growth. Of course the missing element remains underemployment, where we still see many households struggling to get the income they need to cover their ongoing commitments. This is how we define stress – when incoming cash flow is not sufficient to cover ongoing costs.
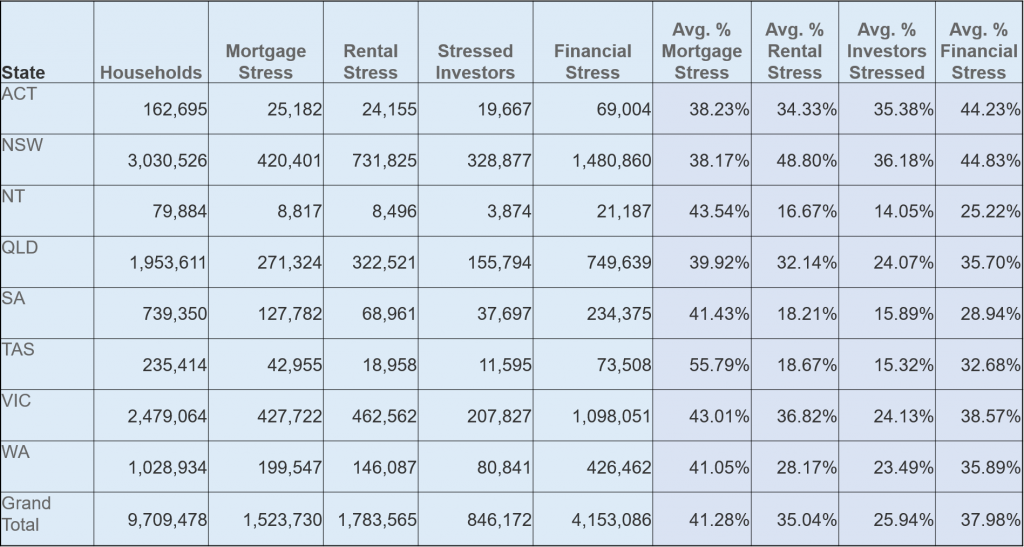
Mortgage stress rose to 41.1% of borrowing households which translates to 1.52 million households, with the end of JobSeeker and JobKeeper in March.

Within the series both mortgage stress and rental stress were higher, although there was a small improvement in Victoria. Mortgage stress remains highest in Tasmania, at 55.8%, while rental stress is highest in NSW. Property investor stress is highest in NSW and ACT, and overall financial stress (which is a weighted average of all stressed households, against all households) was highest in NSW and ACT.
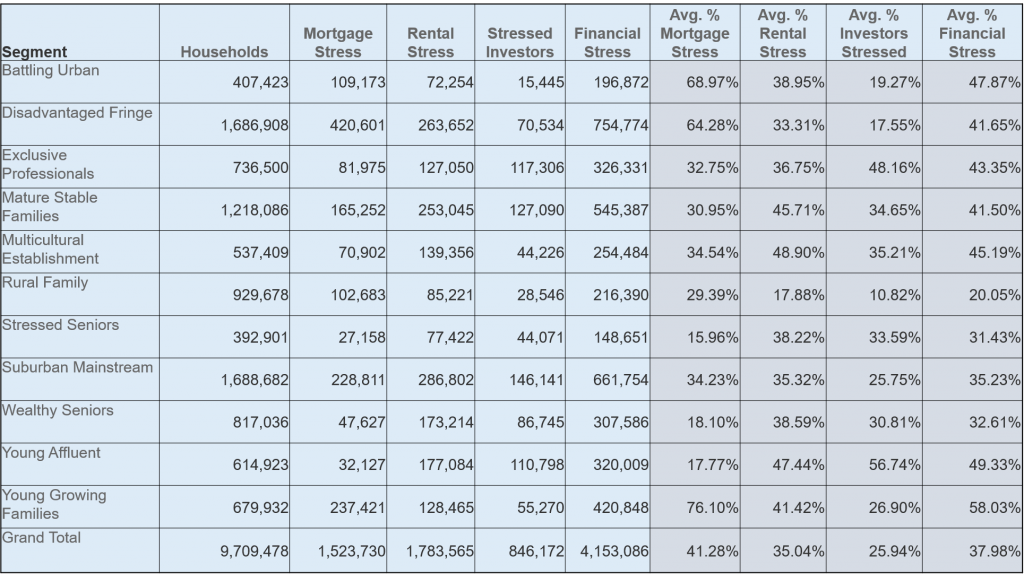
Across the DFA household segments, many Young Growing Families (which includes significant representation of First Time Buyers) are exposed, as are households living in the high growth high construction corridors around our major centres. But we also continue to see more affluent households who are often highly leveraged, with multiple properties also being caught. It is also worth highlighting that many first generation migrants are being caught too.
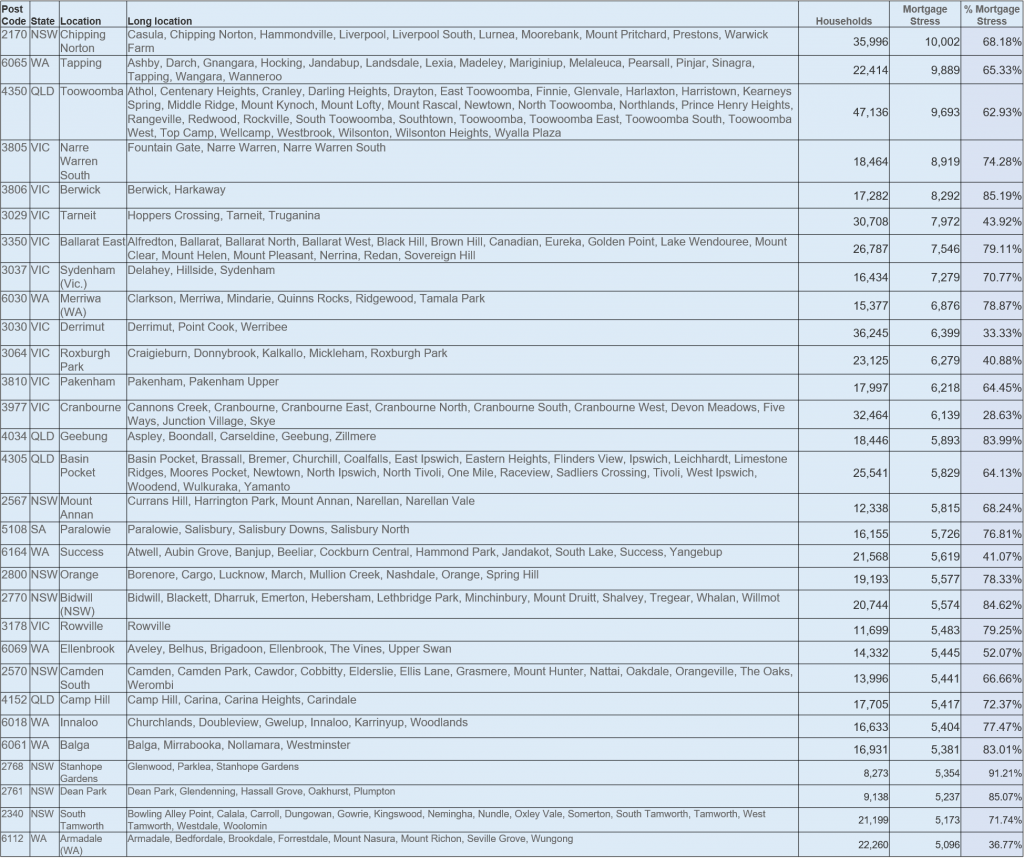
The postcodes with the highest levels of mortgage stress (measured by count of households) includes Chipping Norton 2170, Tapping, Wanneroo 6065, Toowoomba 4350 and Narre Warren 3805. So the pressures are wide spread, with the highest counts in those high growth corridors.
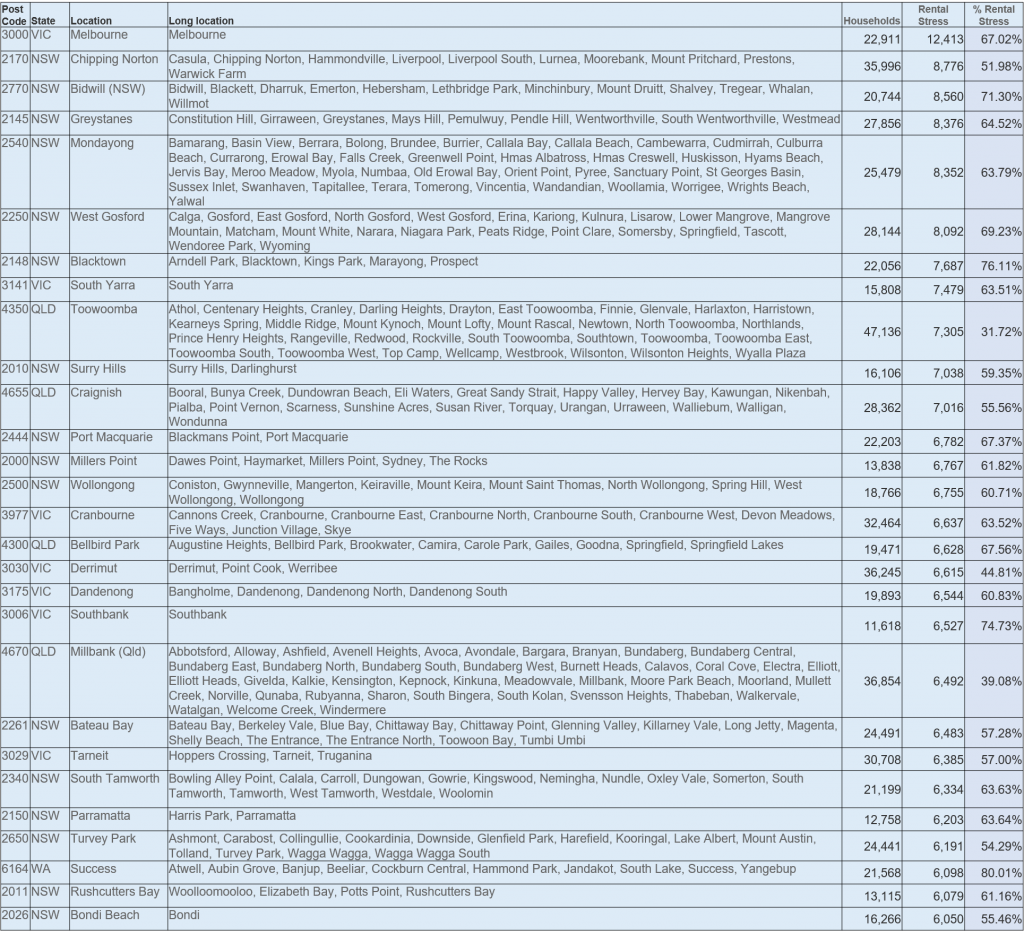
Turning to rental stress, the footprint is rather different, with Melbourne 3000 at the top of the list (thanks to many students and young workers in the area) followed by 2770, Liverpool and surrounds, 2145 which includes Westmead and Wentworthville, 2540 Jervis Bay and surrounds, and 2250, the area around Gosford. So rental stress appears in a range of settings.
Investor stress is led off by Queensland post code 4670 which includes Bundaberg, 2010 which includes Surry Hills and Darlinghurst, Meadow Springs and Mandurah 6210, 2145 Westmead and 3000 Melbourne.
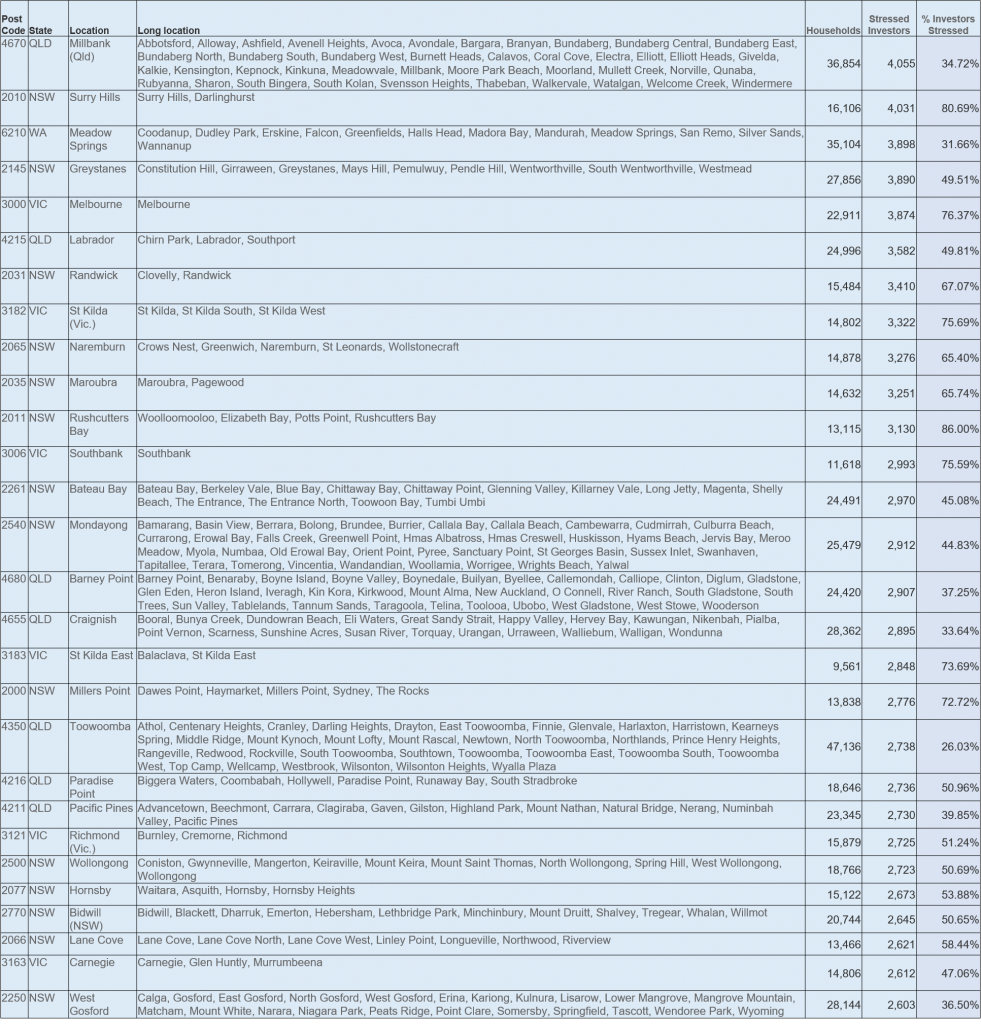
Overall financial stress (our aggregate measure) was highest in 2170, Toowoomba 4350, 27770, 3000 and 3029, which includes Hoppers Crossing. Again this shows the wide distribution of those under financial pressure.

We discussed this in our recent show on DFA, together with some heat maps
We updated our core market model to take account of these changes, with our main scenario seeking an ongoing rise in property values ahead, but determined by the trajectory of the virus, vaccine rollout and border controls.
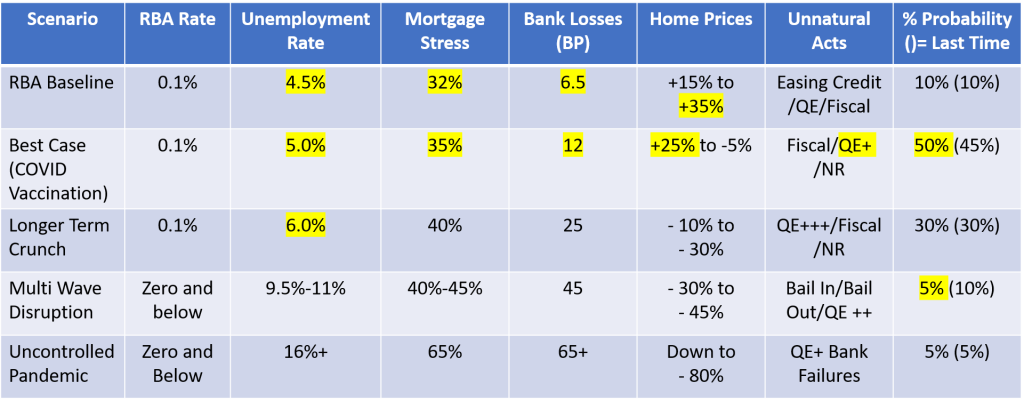
In conclusion, while many households are experiencing a rebound, there are many who are still caught in significant and growing financial pressures. Given that costs of many services are rising, while income is not, plus the larger mortgages being written at the moment, we expect stress to remain elevated for some time. And given the long cycle between stress, and ultimate property sale or mortgage default, it is likely we will see a continued build up in those financially exposed ahead.
