Apple Pay Plots New Territory—Including Las Vegas and China

The Payment War continues. Interesting commentary from Brand Channel.

After many decades, it’s still interesting to watch Apple continue to push the envelope around its primary business model.

Apple Watch is a prime example, as it plunges the brand deeply into the fashion world as well as the personal tech sphere that it already dominates. Intriguing new wrinkles include the just-uncovered fact that a loophole in security would hypothetically allow a thief to use someone else’s Apple Watch to make Apple Pay payments with the owner’s credit card data, according to PhoneArena.com.

While the Apple Watch launch may have somewhat overshadowed the company’s Apple Pay platform, the latter’s list of participating vendors keeps expanding—including its newest addition, Cole Haan.

“The Cole Haan enthusiast is on the go and online at all times,” said David Maddocks, chief marketing officer at Cole Haan, in a press release. “The mobile wallet in our popular mobile application made perfect sense for the Cole Haan customer who wants to stay stylish at the touch of a button.”

Las Vegas is getting in on the Apple action as well. Apple Pay is now making its way to The Cosmopolitan hotel and casino there, where consumers will be able to use it at the front desk, restaurants and bars. According to Digital Trends, however, it can’t be used to buy chips for gambling—yet.

All of that may be table stakes, though, compared with Apple’s biggest target for Apple Pay: China.

China is Apple’s second-biggest market by revenues and snaps up more iPhones now than the US, according to CNBC. “We very much want to get Apple Pay in China,” CEO Tim Cook told a Chinese news agency.

The company reportedly is in talks with Alibaba about bringing Apple Pay to China using Alibaba’s Alipay to process transactions. Apple has been eying the China market for some time, according to Zack’s.com, but regulatory hurdles have made it difficult for the company to enter the market.

As with smartphones, Samsung looms as a formidable competitor in mobile-pay systems after its acquisition earlier this year of Massachusetts-based startup LoopPay, according to Recode.net. The price, it was reported, was $250 million.

Will that be enough for Samsung to arm wrestle with Apple Pay as its smartphones have done with iPhones? The answer likely will come quickly.

New Zealand’s Restrictions on Mortgage Lending in Auckland Will Benefit Banks – Moody’s

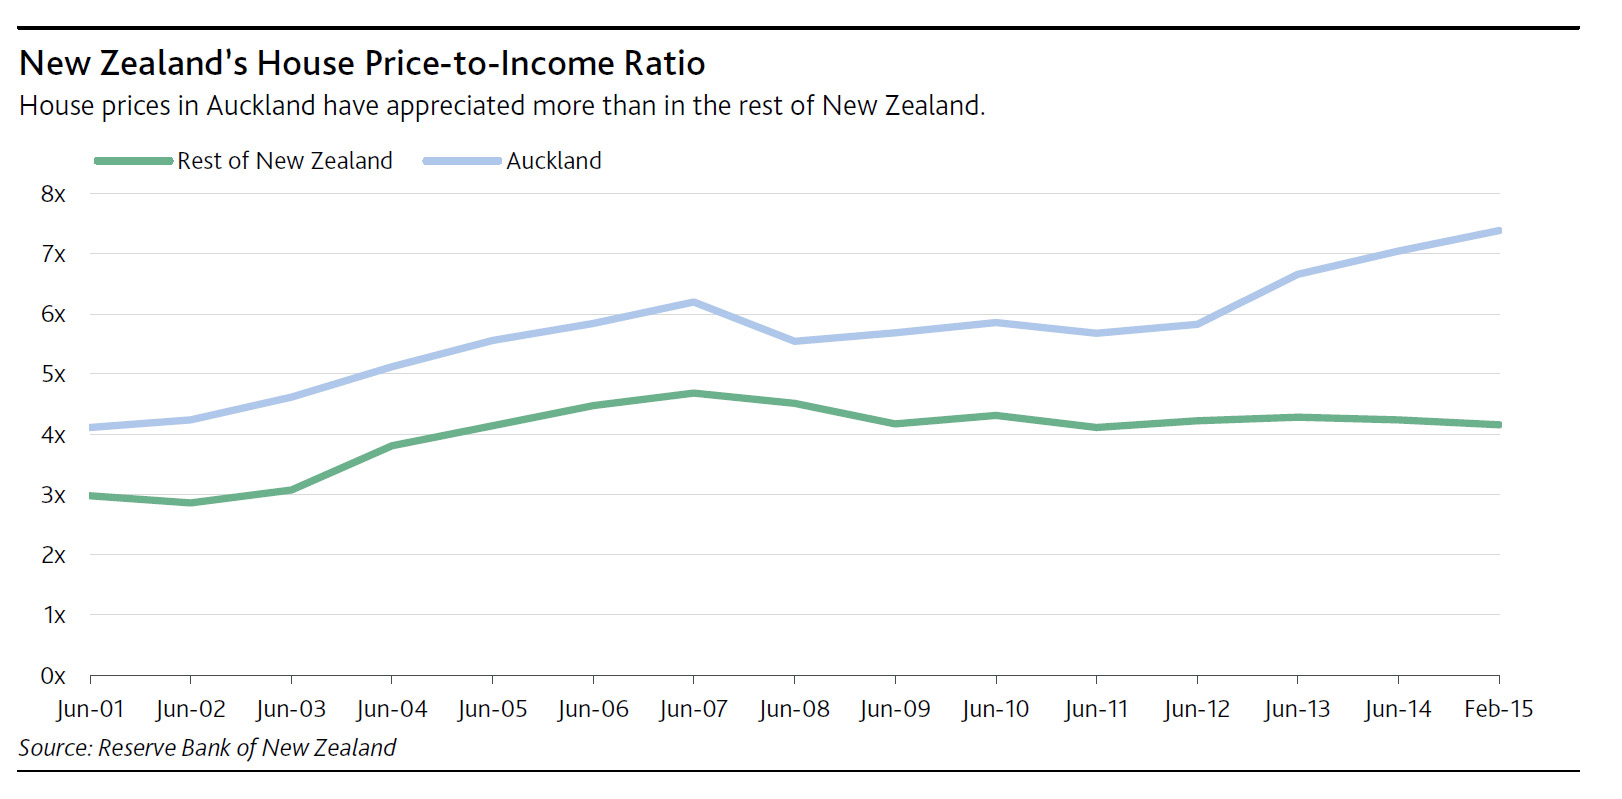
Last Wednesday, the Reserve Bank of New Zealand (RBNZ) announced that starting 1 October 2015 bank lending to home investors in Auckland, New Zealand, will be restricted to mortgages with loan-to-value ratios (LTVs) of less than 70%. The RBNZ also said it was raising the percentage of residential mortgage loans that can be originated outside of Auckland with LTVs of 80% or higher to 15% of all mortgage loans from 10%. These measures are credit positive for New Zealand’s banks because they will reduce banks’ exposure to riskier mortgage loans in Auckland, where house prices are at historical highs, having risen 14.6% in the 12 months to March 2015.

Moody’s says these steps would particularly benefit New Zealand’s four major banks, ASB Bank Limited (Aa3/Aa3 stable, a2 review for downgrade), ANZ Bank New Zealand Limited (Aa3/Aa3 stable, a3), Bank of New Zealand (Aa3/Aa3 stable, a3) and Westpac New Zealand Limited (Aa3/Aa3 stable, a3). These banks held approximately 86% of total system mortgages as of 31 December 2014. Additionally, Auckland, New Zealand’s largest city, constitutes the largest market for these banks, and the RBNZ reports that around 40% of mortgage originations in Auckland are to investors.

The introduction of an LTV limit on property-investor lending in Auckland will reduce the risk of recently originated mortgages experiencing negative equity, where the size of the loan exceeds the value of the property. Both house prices and household indebtedness in Auckland are at historical highs creating a sensitivity to increases in unemployment and interest rates. Although LTV restrictions are likely to dampen house price growth in Auckland, we expect the effect to bemarginal owing to supply shortages and the official cash rate, which the RBNZ sets to meet inflation targetsand remains accommodative by historical standards, continuing to support price gains. However, reducingbank exposures to high-LTV loans that are more exposed to a house price correction would benefit banks.

NZ-Price-to-Income-May-2015The LTV restrictions would not apply to loans to construct new residential properties, given the RBNZ’s focus on alleviating Auckland’s housing shortage. Although the new 15% cap on high-LTV loans outside Auckland will allow banks to lend more at higher LTVs, price growth outside of Auckland has been relatively subdued. By responding to current housing market developments and loosening restrictions, the RBNZ is making housing finance more accessible in areas of New Zealand where there are fewer risks of stimulating excessive price speculation.

The proposals are the RBNZ’s latest in a series of steps aimed at reducing excess leverage in the financial system and reducing the threat of asset bubbles. In September 2013, the RBNZ raised the capital requirements for high-LTV lending and in October 2013 imposed a 10% cap on high-LTV loans. In March 2015, the RBNZ released a consultation paper indicating that banks would likely need to hold more capital against investor loans than against owner-occupied mortgages. The RBNZ intends to release a consultation paper later this month outlining its most recent announcement.

Sales Of New Motor Vehicles In April

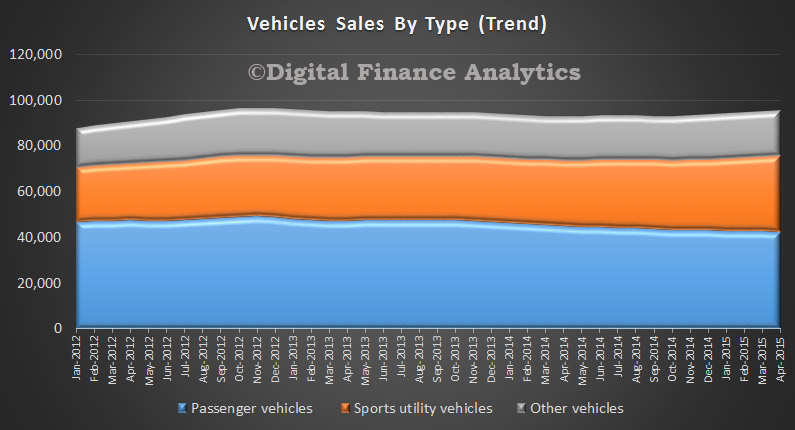
The ABS released the April 2015 sales today. Hard to read the data, as there are some significant variations between the trend estimate and the seasonally adjusted figures, though on both measures Sport Utilities continued to shine.

The trend estimate (our preferred view)  for April 2015 was 95 288, an increased by 0.5% when compared with March 2015. This was the highest April result on record. When comparing national trend estimates for April 2015 with March 2015, sales of Sports utility and Other vehicles increased by 1.9% and 0.1% respectively. Over the same period, Passenger vehicles decreased by 0.4%.

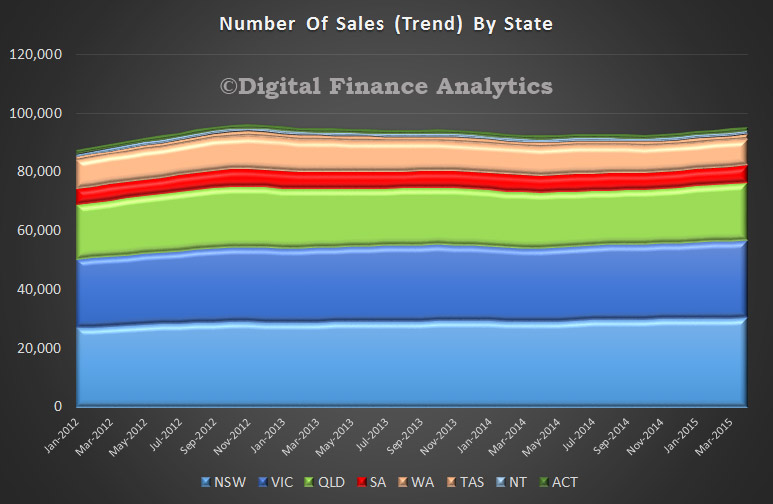
VehicleSalesTypesApril2015 Seven of the eight states and territories experienced an increase in new motor vehicle sales when comparing April 2015 with March 2015. Tasmania recorded the largest percentage increase (1.6%), followed by Queensland (1.1%) and the Northern Territory (0.9%). Over the same period, Western Australia was the only jurisdiction to record a decrease in sales (0.1%).

VehicleSalesStatesApril2015Turning to the seasonally adjusted estimates, the April 2015 seasonally adjusted estimate (94 888) has decreased by 1.5% when compared with March 2015. When comparing seasonally adjusted estimates for April 2015 with March 2015 sales of Passenger and Other vehicles decreased by 8.3% and 0.6% respectively. Over the same period, Sports utility vehicles increased by 7.4%.

Five of the states and territories experienced a decrease in new motor vehicle sales when comparing April 2015 with March 2015. The Australian Capital Territory recorded the largest percentage decrease (6.1%) followed by Queensland (4.8%) and Western Australia (2.8%). Over the same period, the Northern Territory recorded the largest increase in sales (3.2%).

Managing Two Transitions

Philip Lowe, RBA Deputy Governor spoke at the Corporate Finance Forum and spoke about two transitions.

The first is a domestic one – that is, the transition in the Australian economy following a period of extraordinarily strong growth in investment in the resources sector combined with record high commodity prices.

The second is a much more international one – and that is what seems to be a transition to a world in which global interest rates are lower, at least for an extended period, than we had previously become used to.

He explored the impact of low rates:

The first is the challenge that low interest rates pose to anyone who is seeking to fund future liabilities. Low interest rates mean that the present discounted value of these liabilities is higher than it once was. In turn, this means that more assets are needed to cover these liabilities. For anyone managing a long-tail insurance business or a defined benefit pension scheme, this is a major challenge. It is also a challenge for retirees and those planning for retirement.

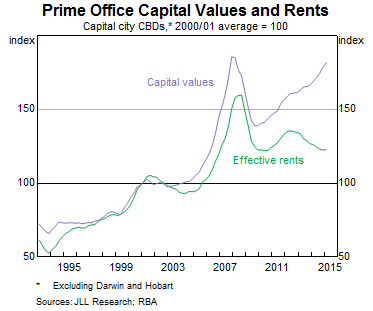
The second issue is the effect of low interest rates on asset prices. Just as low interest rates increase the value of future liabilities, they increase the value of a given stream of future revenue from any asset. The result is higher asset prices. Another way of looking at this is that faced with low returns on risk-free assets, investors have sought other assets, and in so doing they have pushed up the prices of these assets. A good example of this is commercial property, where investors have been attracted by the relatively high yields, pushing prices up even though rents are declining.

Graph 10: Prime office capital values and rents
A rise in asset prices is, of course, part of the monetary transmission mechanism. But developments here need to be watched very carefully. History is littered with examples of unsustainable asset price rises emerging on the back of perfectly justifiable increases in prices. In a number of cases, this has ended badly, especially if there is leverage involved. Also, we should not lose sight of the fact that interest rates and the returns generated from assets are ultimately linked to one another. So, interest rates may be structurally lower in part because the stream of future income generated from assets is also lower than in the past. This would have obvious implications for the sustainable level of many asset prices.

The third issue is the effect of low interest rates on firms’ investment decisions and hurdle rates of return. In today’s environment, it seems that many investors have, reluctantly, come to accept that they will earn lower yields on their existing assets. An open question though is whether the same acceptance of lower returns is flowing through to firms’ decisions about the creation of new assets – that is, their own investment plans.

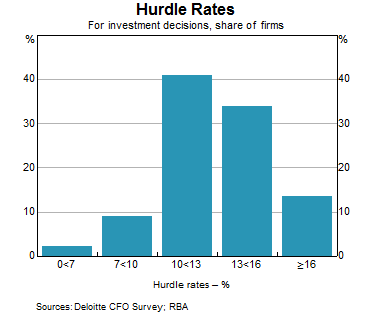
The international evidence is that the hurdle rates of return that firms use for new investment are quite sticky and that they are not very responsive to movements in interest rates. There is less evidence of this issue in Australia, but a recent survey of CFOs by Deloitte hints at the same conclusion. The survey results suggest that hurdle rates of return on new investment are typically above 10 per cent and sometimes considerably so. The results also suggest that the average margin between the hurdle rate of return and the weighted-average cost of capital is about 3 percentage points. As part of the survey, firms were also asked how often they changed the hurdle rate, with the most frequent answer being ‘very rarely’. These findings are very similar to those reached through the Bank’s own extensive business liaison program.

Graph 11: Hurdle rates


How Dangerous Is The Rise In Investor Loans?

The public statements from the Reserve Bank suggests they are monitoring the situation, and working with APRA on potential measures should the need arise. However, the recent freedom of information request reveals a significant and important dialogue within the bank about the potential impact of investor loans. A highly restricted document from 2014 makes the following points. Two concerns on increase in investor lending:

Macroeconomic:

  • Extra speculative demand can amplify the property price cycle and increase the potential for prices to fall later. Such a fall would affect household spending and wealth. This effect is likely to be spread across a broader range of households than the investors that contributed to the heightened activity.

Concentration risk:

  • Lending has been concentrated in Sydney and Melbourne, creating a concentrated exposure in these cities. The risk could come from a state-based economic shock, or if the speculative upswing in demand brings forth an increase in construction on a scale that leads to a future overhang of supply.
  • In Sydney, the risk of oversupply appears limited because of the pick-up in construction follows a period of limited new supply and it has been spread geographically and by dwelling type. While the unemployment rate has picked up a little over the past 18 months, the overall economic environment in NSW is in a fairly good state.
  • In Melbourne, there has been a greater geographic concentration of higher-density construction in inner-city areas. Some developments have a concentration of smaller-sized apartments that may only appeal to some renters, or purchasers in the secondary market. Economic conditions are not as favourable in Victoria and the unemployment rate is 6.8%.

In addition there were concerns about the low interest rate environment:

  • While a pick-up in risk appetite of households is to some extent an expected outcome given the low interest rate environment, their revealed preference is to direct investment into the housing market.
  • Historically low interest rates (combined with rising housing prices and strong price competition in the mortgage market) means that some households may attempt to take out loans that they would not be able to comfortably service in a higher interest rate environment.
  • APRA’s draft Prudential Practice Guide (PPG) emphasises that ADIs should apply an interest rate add-on to the mortgage rate, in conjunction with an interest rate floor in assessing a borrower’s capacity to service the loan. In order to maintain the risk profile of borrowers when interest rates are declining, the size of the add-on needs to increase (or the floor needs to be sufficiently high).

… and on Lending standards

  • In aggregate, banks’ lending standards have been holding fairly steady overall; lending in some loan segments has eased a little, while lending in some other segments has tightened up a bit.
  • The main lending standard of concern is the share of interest-only lending, both to owner-occupiers and investors. For investors, 64% of banks’ new lending is interest-only loans and for owner-occupiers the share is 31%.
  • The typical interest-only period is 5 years, but some banks allow the interest-only period to extend to 15 years. During this period, the loan is amortising more slowly than a loan that requires principal and interest (P&I) payments. If housing prices should fall, this increases the risk that the loan balance may exceed the property value (negative equity). There is some risk that the borrower could face difficulty servicing the higher P&I payments when the interest-only period ends, although this is typically mitigated by banks assessing interest-only borrowers on their ability to make P&I payments.

Then, we noted the Reserve Bank of NZ view that the risks in investment loans are different from owner occupied loans and should have different capital rules applied.

We continue to stress the fact the lending for investment property is unproductive, we need more finance for business, which can create productive growth.

Finally, we note the capital regulatory discussions on forthcoming changes to the capital rules under Basel IV, and where investment loans fit in.

Put all this together, and the risks to the broader economy, and the banking system from higher investment property loans, at a time of low interest rates, and high prices are significantly higher than acknowledged in public by the regulators in Australia. In addition, the recent interest rate cut makes even less sense.

USA Industrial Production Falls Again In April

US Industrial production decreased 0.3 percent in April for its fifth consecutive monthly loss. This adds further weight to the view that interest rates hikes to normal levels in the US will be further delayed.

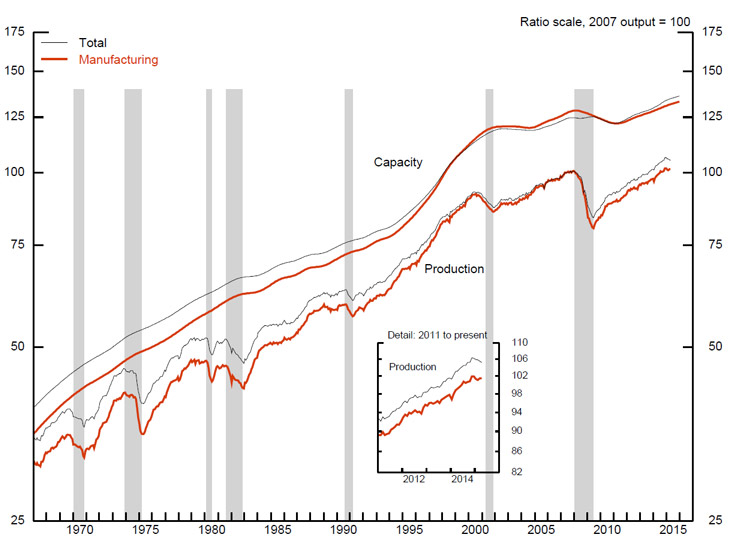
Manufacturing output was unchanged in April after recording an upwardly revised gain of 0.3 percent in March. In April, the index for mining moved down 0.8 percent, its fourth consecutive monthly decrease; a sharp fall in oil and gas well drilling has more than accounted for the overall decline in mining this year. The output of utilities fell 1.3 percent in April. At 105.2 percent of its 2007 average, total industrial production in April was 1.9 percent above its year-earlier level. Capacity utilization for the industrial sector decreased 0.4 percentage point in April to 78.2 percent, a rate that is 1.9 percentage points below its long-run (1972–2014) average.

USA-Produciton-May-2015

The Industrial Production and Capacity Utilization statistical release, which is published around the middle of the month, reports measures of output, capacity, and capacity utilization in manufacturing, mining, and the electric and gas utilities industries.

The industrial production (IP) index measures the real output of all manufacturing, mining, and electric and gas utility establishments located in the United States, regardless of their ownership, but not those located in U.S. territories; the reference period for the index is 2007. Manufacturing consists of those industries included in the North American Industry Classification System (NAICS) definition of manufacturing plus those industries—newspaper, periodical, book, and directory publishing plus logging—that have traditionally been considered to be manufacturing. For the period since 1997, the total IP index has been constructed from 312 individual series based on the 2007 NAICS codes. These individual series are classified in two ways: (1) market groups, and (2) industry groups. Market groups consist of products and materials. Total products are the aggregate of final products, such as consumer goods and equipment, and nonindustrial supplies (which are inputs to nonindustrial sectors). Materials are inputs in the manufacture of products. Major industry groups include three-digit NAICS industries and aggregates of these industries—for example, durable and nondurable manufacturing, mining, and utilities.

Australia Fiscal Plan Weakens, But Core Strengths Intact – Fitch

According to Fitch Ratings, Australia’s Commonwealth budget, released on 12 May 2015, highlights the continued weakening of the country’s long-term fiscal consolidation plans, but does not fundamentally alter the core factors supporting Australia’s ‘AAA’ rating. These include low debt-to-GDP versus ratings peers, a stable banking system and a credible fiscal policy framework.

Deterioration in the fiscal outlook since the last budget was widely expected alongside the continued weakening of labour market conditions and a tepid recovery in commodity prices that has not brought prices back to levels seen before the downturn.

The fiscal cash deficit widened and government debt projections increased in the fiscal year ending 30 June 2016 (FY16) budget, reflecting in part the deterioration in economic growth dynamics linked to the fall in commodity prices and slowdown in China. Falling terms of trade have impacted long-term revenue growth projections, which have been revised down to 6.3% annually to 2018 from 6.6% at the last economic and fiscal update. Wage growth and corporate income will continue to be challenged by lower commodity prices, resulting in AUD20bn less in tax revenues over the coming four years compared with the outlook in the 2014 budget.

The deteriorating cash balance also reflects higher spending forecasts compared to the government’s Mid-year Economic and Fiscal Outlook in December.

The government still aims to return to a balanced budget by FY20 – even though fiscal consolidation plans have weakened. It is notable though that with a three-year federal election cycle – the next election is due by January 2017 – there remains significant uncertainty as to whether the political commitment to achieve this target will be sustained. Nonetheless, Australia does benefit from a credible policy framework and Fitch expects Australia to continue to have a significantly lower debt burden than its ‘AAA’-rated peers – general government debt was 31.8% of GDP in 2014 versus the ‘AAA’ median of 41.3%. Notably too, the government forecasts debt-to-GDP to begin falling by FY18 after rising for the next two fiscal years. As such, the budget should not have a significant effect on Australia’s existing strong credit profile.

Fitch believes that the iron ore forecast price in the budget of USD48/tonne seems a reasonable base case, but the budget will remain sensitive to further price falls. Australia’s dependence on commodity exports, especially to China, indicates that the sovereign may need a slightly larger buffer in its public finances than some of its peers at the ‘AAA’ level.

Over the longer term, reducing Australia’s dependence on commodities would mitigate a key vulnerability of the economy and sovereign. The FY16 budget includes some policy measures, including infrastructure investments and targeted SME tax cuts, to raise potential growth and spur service sector exports. As yet, it is uncertain to what extent these sorts of policies will be successful in transitioning growth away from mining.

The Global Implications of Diverging Monetary Policy Settings in Advanced Economies

Panel remarks by Mr William C Dudley, President and Chief Executive Officer of the Federal Reserve Bank of New York, at the Sixth High Level Conference on the International Monetary System: Monetary Policy Challenges in a Changing World, Zurich, Switzerland, 12 May 2015.

I will focus my remarks on the global implications of U.S. monetary policy normalization – paying particular attention to the potential implications for emerging market economies (EMEs). I put the focus here because these economies were greatly affected in 2013 during the so-called “taper tantrum” and many of these economies have been under stress from the weakness in global commodity prices. As always, what I have to say today reflects my own views and not necessarily those of the Federal Open Market Committee (FOMC) or the Federal Reserve.

But before I get to the implications for EMEs and what the Fed should do or not do to mitigate the impact, a few words on the timing of normalization. To be as direct as possible: I don’t know when this will occur. The timing of lift-off will depend on how the economic outlook evolves. Since the economic outlook is uncertain, this means the timing of liftoff must also be uncertain.

At the same time, though, I can be clear about what conditions are needed for normalization to begin. If the improvement in the U.S. labor market continues and the FOMC is “reasonably confident” that inflation will move back to our 2 percent objective over the medium-term, then it would be appropriate to begin to normalize interest rates.

Because the conditions necessary for liftoff are well-specified, market participants should be able to think right along with policymakers, adjusting their views about the prospects for normalization in response to the incoming data. This implies that liftoff should not be a big surprise when it finally occurs, which should help mitigate the degree of market turbulence engendered by lift-off.

Nevertheless, I think it would be naïve not to expect some impact. After more than six years at the zero lower bound, lift-off will signal a regime shift even though policy would only be slightly less accommodative after lift-off than it is before. I expect that this will have implications for global capital flows, foreign exchange valuation and financial asset prices even if it is mostly anticipated when it occurs.

Which leads to the key question I want to address in the remainder of my remarks: What should the Federal Reserve do to minimize the impact?

Like other central banks, our monetary policy mandate has a domestic focus. Our monetary policy actions, though, often have global implications that feed back into the U.S. economy and financial markets, and we need to always keep this in mind.

From one perspective, the unconventional nature of monetary policy around the world adds little that is fundamentally new to the challenges that face EMEs. Today’s monetary policies simply represent a way of easing that was necessitated by hitting the zero lower bound here and elsewhere. Central bankers have managed differences across countries in cyclical positions and policy stances many times in the past. This time should not be fundamentally different.

But, from another perspective, we have less experience operating with unconventional monetary policy, we have been in this regime for a long time and this creates more potential uncertainties. These uncertainties put a premium on clear communication among central bankers as well as between central bankers and market participants. In my view, an important fact is that the large scale asset purchase programs undertaken in the United States and elsewhere have dramatically shrunk the size of bond risk premia globally. This new set of monetary policies affects financial asset prices in a different way compared to changes in short-term interest rates, and we should be humble regarding what we claim to understand about this distinction.

Looking ahead, it seems likely that markets will remain focused on those vulnerabilities that they might have ignored prior to the taper tantrum in 2013. The greater premium on strong fundamentals, policy coherence and predictability will likely remain. Although we will undoubtedly experience further bumps in the road. I think we can remain generally optimistic about the prospects for adjustment. But for this to occur, it will be important for market participants to appropriately discriminate across countries, rather than treating EMEs as a single group.

The good news is that many EMEs generally appear to be better equipped today to handle the Fed’s prospective exit from its exceptional policy accommodation than they were during past tightening cycles. This reflects the fundamental reforms that EMEs have put in place over the past 15 years, as well as the hard lessons learned from past periods of market stress. Among the positives are:

  • The absence of pegged exchange rate regimes that often came undone violently during periods of acute stress;
  • Improved debt service ratios and generally moderate external debt levels;
  • Larger foreign exchange reserve cushions;
  • Clearer and more coherent monetary policy frameworks, supporting what are now generally low to moderate inflation rates;
  • Generally improved fiscal discipline; and
  • Better capitalized banking systems, supported by strengthened regulatory and supervisory frameworks.

Of course, progress has not been uniform across EMEs, and more work remains to further strengthen institutional structures in some countries. In particular, vulnerabilities remain in several important EMEs, and some have been hit by the sharp adverse turn in their terms of trade due to the recent fall in global commodity prices. Still, the fundamental improvements I’ve cited leave many EMEs better positioned than in the past to weather those times in the cycle when the external environment becomes more difficult.

The impact that changes in Fed policy can have beyond our borders has led to calls for us to do more to internalize those impacts, or even further, to internationally coordinate policymaking. As I’ve already noted, we are mindful of the global effects of Fed policy, given the central place of U.S. markets in the global financial system and the dollar’s status as the global reserve currency. Accordingly, we seek to conduct monetary policy transparently and based on clear principles. Promoting growth and stability in the U.S., I believe, is the most important contribution we can make to growth and stability worldwide.

There is, of course, the argument that Fed policy has been too accommodative for too long, creating risks for financial stability worldwide. Here, I think it’s important to consider carefully the counterfactual. Would countries beyond our borders really have been better off with a weaker U.S. economy – an economy that might have required exceptional monetary policy accommodation for a much longer period of time? The fundamental issue is whether U.S. monetary policy has helped support our dual objectives of maximum employment in the context of price stability, and whether this support is consistent with a healthy global economy.

While explicit coordination looks neither feasible nor desirable, there may be more that central banks in general, and the Fed in particular, could do to be better global stewards. As an example, I would emphasize the importance of effective Fed communication. It is clear, in retrospect, that our attempts in the spring of 2013 to provide guidance about the potential timing and pace of tapering confused market participants. Market participants seemed to conflate the prospective tapering of asset purchases with monetary policy tightening, and pulled forward their expectations about the likely timing of liftoff and raised their expected paths for policy rates. Lately, we seem to have done better: the tapering down of the Fed’s asset purchase program went smoothly and market participants now seem to share the assessment embodied in the FOMC’s March Summary of Economic Projections that lift-off is likely to begin sometime later this year.

As you know, we’ve taken a number of steps in recent years to increase transparency and improve our communications. This includes regular press conferences by the Fed chair following FOMC meetings; the publishing of growth, inflation and short-term rate forecasts of FOMC participants; and a concerted attempt to lay out the guideposts that the FOMC will look at to assess progress toward our mandate. We also have explained in considerable detail what tools we will use and how we will likely use them to ensure to ensure a smooth lift-off.

A second area we have focused on is doing a better job safeguarding financial stability. Simply put, we failed to act both early enough and decisively enough to stem the credit excesses that spawned the financial crisis and the Great Recession. The U.S. was not alone in this shortcoming, but given our position in the global financial system, we especially should have done better. We’ve taken important steps through new legislative mandates and a broader effort to rethink our regulatory and supervisory framework. In particular, systemically important banking organizations must now hold amounts of capital and liquidity that are better aligned with their risk profiles. Other changes have also been implemented, such as central clearing of standardized OTC derivatives contracts, that should make the global financial system more resilient and robust.

Although this effort remains very much a work in progress, I think it will enable us to avoid repeating the mistakes of the past decade, and enable us to take a more proactive stance toward mitigating potential future vulnerabilities. Of course, we at the Fed are not alone here. Since the recent financial crisis, central banks worldwide have been engaged in a broad rethinking of how to better fulfill their mandates.

Let me close with a final thought. The largest problems that countries create for others often emanate from getting policy wrong domestically. Recession or instability at home is often quickly exported abroad. Equally important, growth and stability abroad makes all our jobs at home easier. This illustrates the externalities in the work we all do, with more effective fulfillment of our domestic mandates helping to bring us collectively to a better place.

Inquiry On Home Ownership Launched

The House of Representatives Economics Committee has announced a new inquiry into home ownership. The Chair of the Committee, John Alexander, said that ‘home ownership is an issue that lies at the core of the Australian dream and represents the largest investment that most taxpayers will make during their lifetime. The importance of this issue throughout our nation makes it worthy of a detailed inquiry.’

The Committee will inquire into and report on:

  • current rates of home ownership;
  • demand and supply drivers in the housing market;
  • the proportion of investment housing relative to owner-occupied housing;
  • the impact of current tax policy at all levels; and
  • opportunities for reform.

The Committee invites submissions to the inquiry by Friday 26 June 2015, and the proposed reporting date is 03 December 2015.

This follows on from the previously released Senate report on Housing Affordability.   We wonder if more committee review is an excuse not to tackle the critical issues which need to be addressed! We shall see.

WA Budget Kills First Owner Grants For Established Property

In WA’s 2015 budget, first time buyers wanted to purchase an established property will loose the ability to tap into the $3,000 FHOG. It had already been reduced for established buyers from $7,000 to $3,000 in 2013. However, the FHOG remains unchanged at $10,000 for those wanting to build their first home. Treasure Mike Nahan said the change was in line with the State Government’s policy objective of focusing financial support on residential construction. Cutting the grant for first time buyers purchasing established homes will be a saving of about $109 million for the State Government over four years.

In other changes, whilst stamp duty concessions for first home buyers of both new and established homes remain unchanged,  a new $300 flat land tax scale will come into effect in 2015-16 for land with an unimproved value of between $300,000 and $420,000. This new  “flatter” land tax scale is expected to raise an additional revenue of $184 million in 2015-16 and about $826 million over the next four years. Those properties with an unimproved value of less than $300,000 will be exempt.

We think FHOG should be abolished entirely because it distorts the market, but the removal from established dwellings makes perfect sense. You can read our background discussion on why FHOG’s are bad news here.