ATMs led to significant advances in how customers access financial services because – coupled with the direct deposit – they freed workers from so many routine tasks. No more depositing a paycheck in person, inquiring about balances or paying utilities solely during banking hours. ATMs enabled impromptu dinners and last-minute shopping over the weekend.
But now that we have so many other alternatives to fulfill our banking needs – we can deposit a check with a snap from our smartphones – do we really need ATMs? Why do we require physical cashpoints given that mobile payments and e-commerce continue to grow, heralding the “death of cash”?
Claims that the ATM is a passing technology are almost as old as the idea of a cashless society, and for a variety of reasons it’s probably premature to predict its demise.
The rapid embrace of the digital and resistance to the traditional by today’s youth may eventually bring about the ATM’s end, but for a long time to come, the ATM will likely remain central to our relationship with money.
Slow pace of change
First off, banknotes and ATMs are two of the most ubiquitous products in the world. Whereas banknotes have social meaning, cashpoints recede to the background of everyday life. Most urbanites typically stick to the same three to five cash machines for most transactions.
Banknotes and coins still represent 9% of the eurozone’s economy and 7% in the US, according to the Bank for International Settlements. Even in almost cashless Sweden, cash still makes up 3% of the economy.
Secondly, people like the freedom to choose between alternative payment options. So even as we use smartphones more often to make purchases at the grocery store, credit cards are still how we buy most things online, and we keep cash in our wallets for smaller items.
Thirdly, changes in retail payments have proven to be very slow rather than disruptive, and their path differs from country to country, suggesting it’ll be a while before the ATM is displaced.
To illustrate this long-winded process of innovation, consider that the first cash machine emerged in 1967, yet the device became mainstream only in the 1980s.
Today, most of the 2.6 billion bank ATMs currently in operation still run on Windows XP – an operating system Microsoft stopped supporting last year. The industry plans to upgrade and even make the switch to non-Microsoft systems, but that change may not take place until around 2020. That’s largely because the average life of an ATM hovers around six years.
Another example is the contactless ATM, which is beginning to slowly take hold with the rise of smartphones. It could make the transaction more secure and reliable by reducing possibilities for card skimming as well as offering the advantage of “client present.” Yet my own research came across references to ATM manufacturers considering devices that would interact wirelessly with customers as early as the 1990s. So it’s an open question why it took so long for this functionality to emerge.
Industry growth
In the meantime, the global market for ATMs continues to expand, but this growth is increasingly skewed and uneven. Global shipments of new ATMs reached a record 466,000 in 2014, up 5% from the previous year, according to London-based Retail Banking Research.
On a regional level, the picture is much more varied. Double-digit gains in the Asia-Pacific market contrast with double-digit declines in North America and Central and Eastern Europe.
Allied Market Research expects that growth to accelerate in the coming years. The US-based group forecasts the number of ATMs to surge 11% a year through 2020.
A fragile future?
Despite that optimistic forecast, the future of the ATM may be fragile as its once cutting-edge functionality becomes ubiquitous through other devices.
Back in 1975, technology companies IBM and NCR promised customers that ATMs would, in the not too distant future, be a one-stop shop for all their banking needs, from making deposits and dealing with account inquiries to making account transfers. Today all of that can be done online, while the functionality of most ATMs in developed countries has been cut down to the bone.
Despite this, the ATM still appears to have a home within banks’ self-service strategy, which is based on greater complementarity rather than cannibalization among delivery channels and means of payment.
The “omnichannel” is the buzzword that will dominate the industry over the next five to seven years. It envisions enabling customers to do their banking and interact with their financial institutions however they like — at the branch or ATM or via the internet or a mobile device.
And even as banks strive to make customer interactions more seamless, they’re also slow to push full automation too quickly because it reduces opportunities to engage in high-margin sales – think mortgages and other loans and services.
The process of balancing convenience through automation with maximizing sales opportunities involves reorganizing the ATM fleet to ensure high availability and an enhanced customer experience to retain, and even increase, customer loyalty while not losing customer trust.
Millennials and the future of banking
Perhaps the biggest issue shaping ATMs in the near future will concern the choices of millennials, those for whom the internet, mobile phones and plastic cards are a fact of life, checks are unknown and cash is quaint.
They challenge financial institutions and their business models to do more faster because they have easier and faster access to better technology than offered by the banks’ legacy systems through the multitude of apps on their smartphones, wearables, tablets and elsewhere.
Left to their own devices, millennials could spell the end of the ATM by 2035 or thereafter.
But that’s still a long way off, and cash – the raison d’etre for the ATM – is still king. Even for most advanced economies, cash represents about half of transactions below US$50.
So it will be a while before we see the end of the crisp paper bill and the coins that fill jars across the globe. In other words, “Long live the ATM!” – so long as there remains a need for after-hours and quickly dispensed cash.
Author – Bernardo Batiz-Lazo, Professor of Business History and Bank Management at Bangor University

 The survey shows a significant rise in a social media presence up 18%, but this compares with a massive 44% increase in the prior year. We also see a rise in orders placed via the internet (up 4%), and fulfilled via the internet (up 10%). Almost all firms have broadband access.
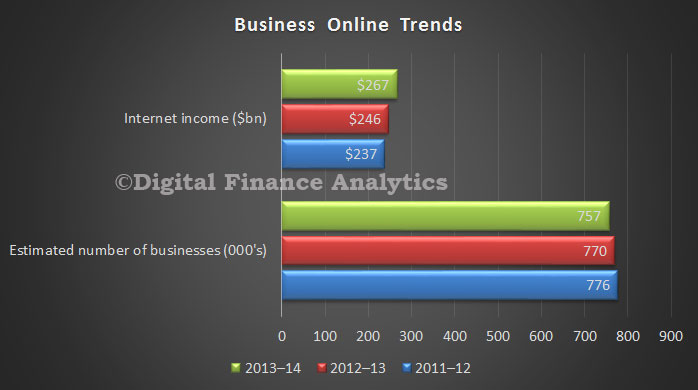
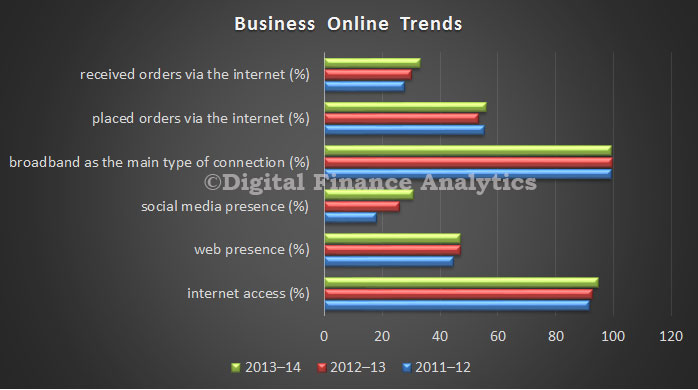 Finally, average annual income for a small firm was more than $4,000, compared with a medium firm of $17,000. Larger firms generated more income, and the four largest employers generated on average $3.6 million.
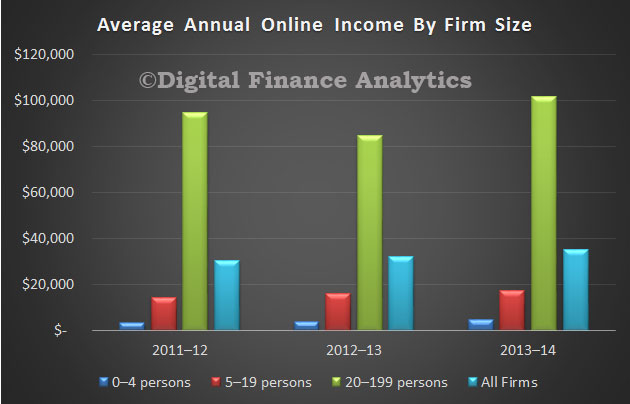 Commerce through the internet is both mainstream, and likely to grow further, supported by the deeper penetration of smart phones and tablets, which enhance customer convenience, and innovation in terms of products and services. See our recent post. Many firms now see online as just another channel to market, but there are industry variations.
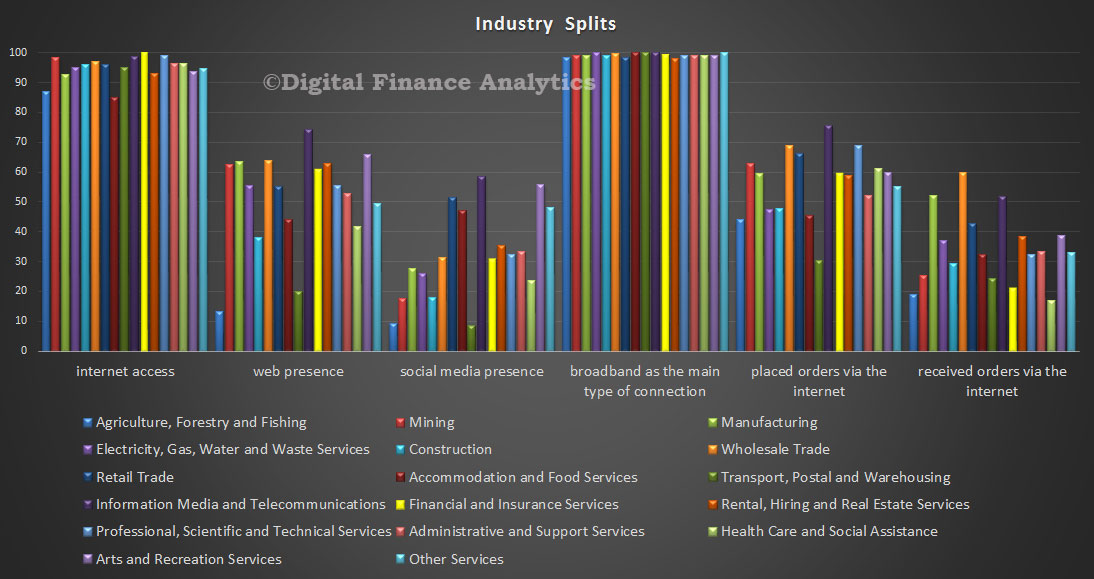 We see, for example that Information, Media and Telecommunications are some of the most active, whilst in finance and insurance, only 60% have a web presence, and 30% have a social media presence.