UK Lending Update

The Bank of England just released their lending trends data for first quarter 2015.  Included in the report is some relevant data on investment or buy-to-let loans. BTL mortgages accounted for 15% of the total outstanding value of UK-resident mortgages as at end-2014 Q4. The rate of possession of buy-to-let properties was almost twice as high as for owner-occupied ones.

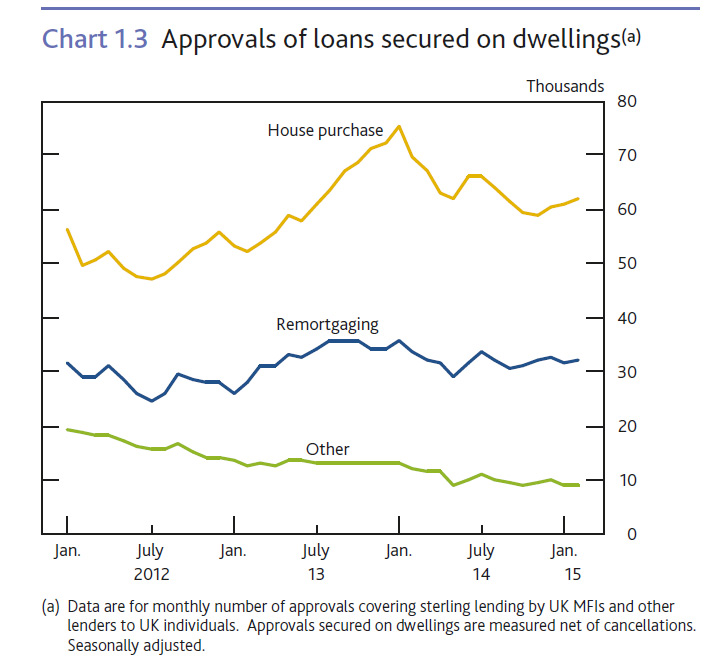
Overall, the rate of growth in some measures of the stock of lending to UK businesses picked up in the three months to February. Net capital market issuance was positive in this period. Mortgage approvals by all UK-resident mortgage lenders for house purchase rose slightly in the three months to February compared to the previous period. The stock of secured lending to households increased, but the pace of growth has slowed since 2014 H1. The annual growth rate in the stock of consumer credit was little changed in recent months.

Pricing on lending to small and medium-sized enterprises was little changed in the three months to February. Respondents to the Bank of England’s 2015 Q1 Credit Conditions Survey reported that spreads on new lending to large businesses fell significantly. The Bank’s series of quoted interest rates on fixed-rate mortgages decreased in 2015 Q1 compared to the previous quarter. Quoted rates on some personal loans continued to fall.

Contacts of the Bank’s network of Agents noted that credit availability had eased further, including for most small and medium-sized companies. Respondents to the Bank of England’s Credit Conditions Survey expected demand for bank lending to increase significantly from small businesses, increase from medium-sized businesses and be unchanged from large businesses in 2015 Q2. Lenders in the survey reported that the availability of secured credit to households was broadly unchanged and that
demand for secured lending fell significantly in the three months to early March 2015.

Secured lending to individuals. The number of mortgage approvals by all UK-resident mortgage lenders for house purchase increased slightly in the three months to February compared to the previous period. Approvals for remortgaging also rose slightly. The stock of secured lending to individuals increased, but the pace of growth has slowed since 2014 H1. The monthly net mortgage flow was little changed in recent months.

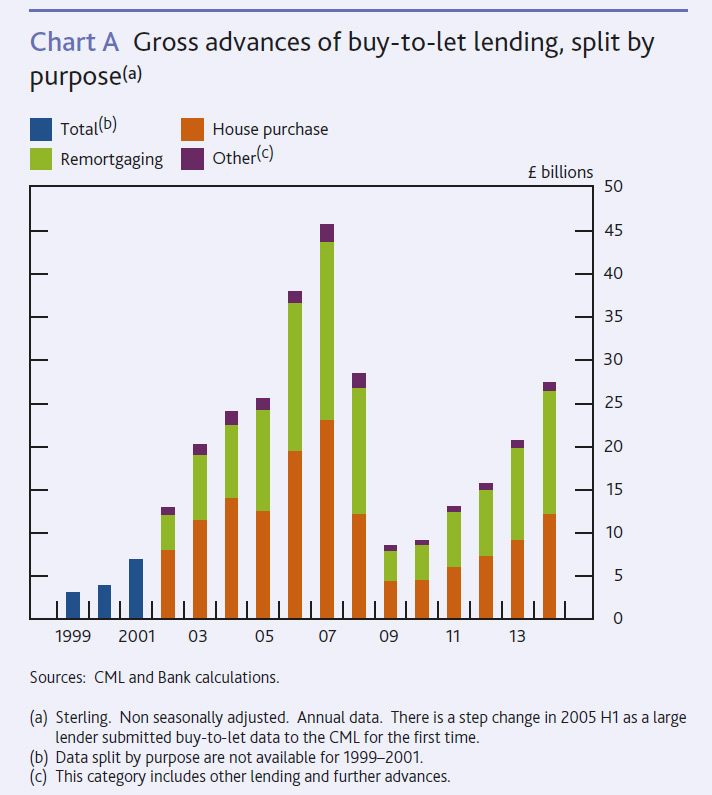
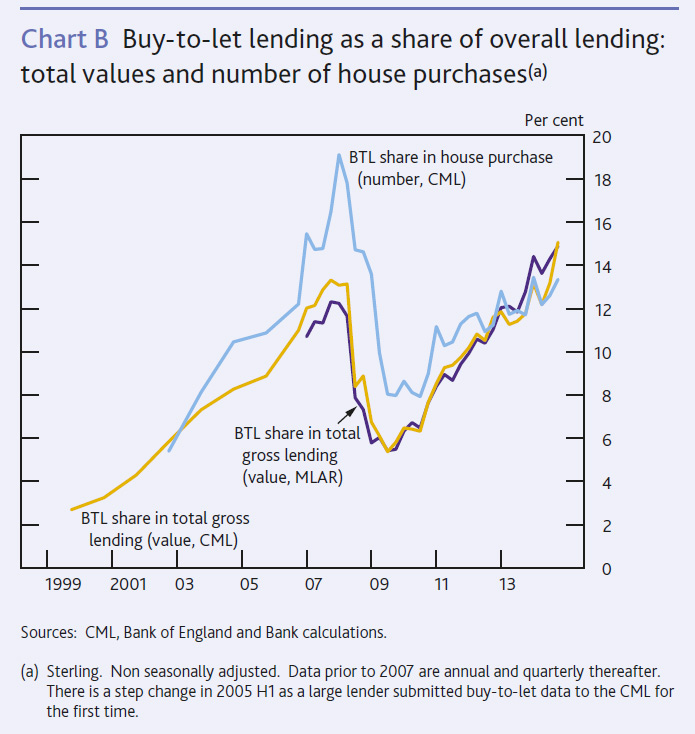
UK-Lending-April-2015-1Overall, gross secured lending was higher in 2014 than in recent years. Within this, the share of gross lending for buy-to-let purposes increased. BTL lending represented 13% of total gross mortgage lending in 2014, with gross advances having recovered from its post-crisis trough though still below its 2007 peak. BTL mortgages accounted for 15% of the total outstanding value of UK-resident mortgages as at end-2014 Q4. A buy-to-let mortgage is a mortgage secured against a residential property that will not be occupied by the owner of that property or a relative, but will instead be occupied on the basis of a rental agreement. In 1996 the Association of Residential Letting Agents, the trade body of estate agents dealing with rental properties, along with four lenders set up its first BTL initiative to encourage private individuals to invest in rental property. This market grew steadily and the share of BTL lending in total gross mortgage lending increased until mid-2008, according to data from the Council of Mortgage Lenders (CML).

UK-Lending-April-2015-2After the onset of the financial crisis, gross buy-to-let lending fell more sharply than total mortgage lending. Reflecting discussions with the major UK lenders, the July 2011 Trends in Lending publication noted one reason for this decline in 2008–09 was that the availability of this lending was said to have tightened as some specialist lenders exited this market. Another reason was that wholesale funding markets — often used to fund BTL lending — became impaired.

UK-Lending-April-2015-3

Gross lending for BTL purposes has grown since 2010, reflecting both supply and demand factors, and was £27.4 billion in 2014. Over the past five years the share of total BTL lending in overall mortgage lending has picked up to 15% in 2014 Q4, higher than in the pre-crisis period, according to data from the CML. Data based on the Bank of England and Financial Conduct Authority’s Mortgage Lenders and Administrators Return (MLAR), derived from a different reporting population and definitions of residency, also show that gross BTL lending grew faster than overall gross mortgage lending in recent years. Contacts of the Bank’s network of Agents noted that the rental market had continued to grow strongly in recent months, supporting continued steady growth in buy-to-let activity.

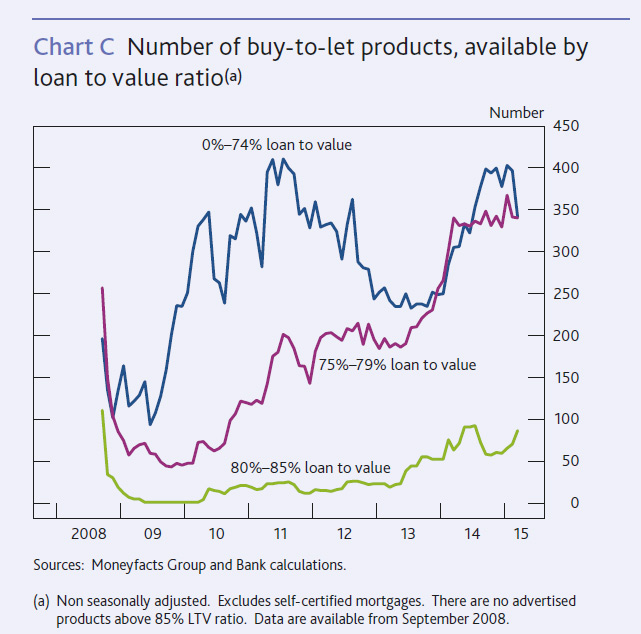
Gross buy-to-let advances for remortgaging have also increased in recent years. Its share of the total grew from 32% in 2002 to 52% in 2014, with the share of gross advances for house purchase at 45%. UK-Lending-April-2015-4The share of the number of BTL mortgages for house purchase in the total number of house purchases has increased from its trough in 2010 to 13% in 2014 though remains below its 2008 peak, according to data from the CML. A significant proportion of advertised BTL mortgage products in the four years after the financial crisis were at loan to value (LTV) ratios below 75%. The number of advertised BTL mortgage products at LTV ratios of 75% and above has increased since mid-2013, but most are below 80% LTV ratio.

UK-Lending-April-2015-5

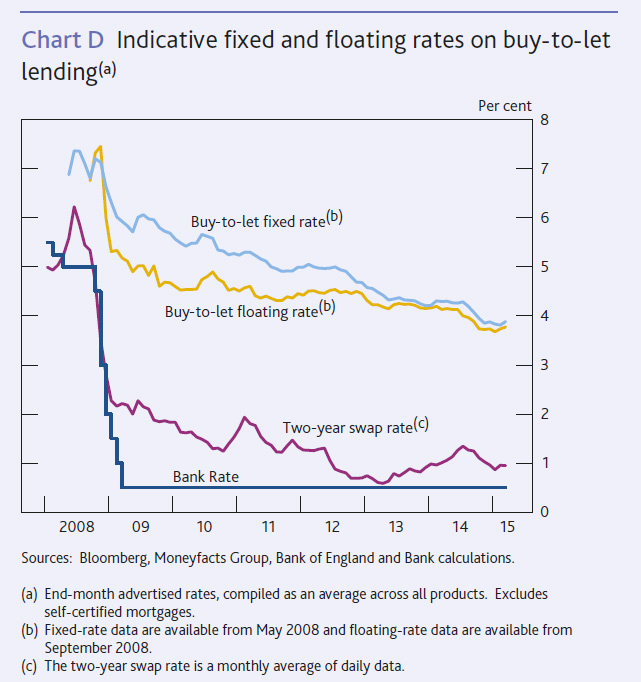
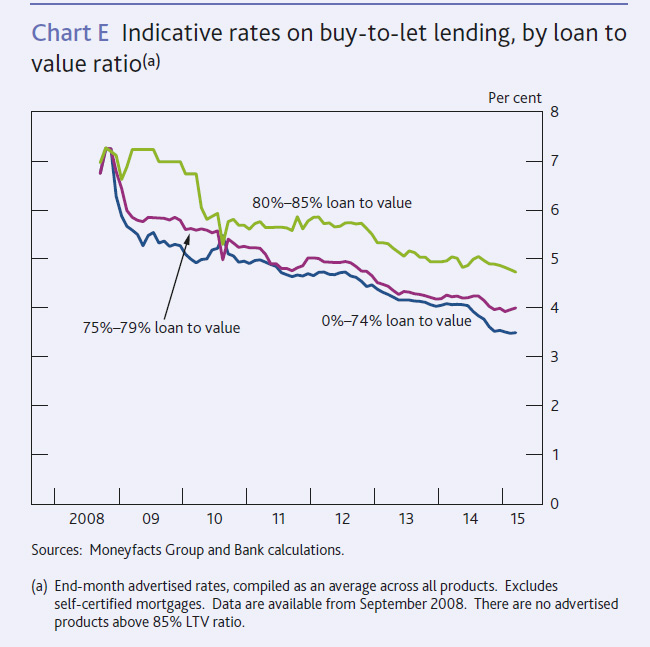
Data on quoted rates for fixed-rate BTL mortgages from Moneyfacts Group indicate that they have fallen since the onset of the financial crisis. This follows the same broad pattern as the aggregate measures of quoted rates on fixed-rate mortgages published by the Bank of England. Spreads over reference rates initially widened on fixed-rate BTL products, as mortgage rates fell by less than swap rates. Since 2013, spreads on these products narrowed as relevant reference rates increased. In recent months, spreads ticked up as fixed BTL rates fell by less than these swap rates. Floating BTL mortgage rates have also decreased since the onset of the financial crisis. The decrease was similar to that for rates on fixed BTL products since 2013. With Bank Rate unchanged, spreads over Bank Rate for floating-rate BTL mortgages have narrowed in recent years. Looking ahead, lenders in the Bank of England’s Credit Conditions Survey expected a reduction in spreads on BTL lending in 2015 Q2. Indicative BTL rates by LTV ratio ranges have also decreased over the years. Rates for LTV ratios below 75% have fallen sharply over the past twelve months.

UK-Lending-April-2015-6

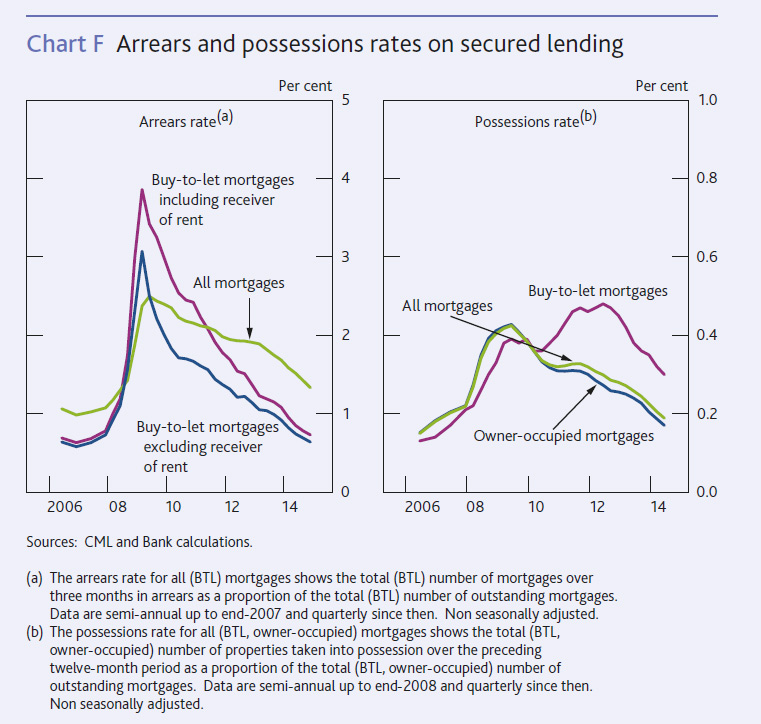
BTL mortgages as a proportion of the total number of outstanding mortgages more than three months in arrears rose sharply at the start of 2009, around the same time as the overall mortgage arrears rate. The BTL arrears rate fell back and has been lower than that for all mortgages in recent years. In some contrast, the possessions rate on BTL mortgages peaked much later than that for owner-occupied mortgages and while it has fallen recently, still remains higher than that for owner-occupiers. But the CML noted that some of the differences in the path of arrears and possession rates seen when comparing the BTL sector with the wider market reflects the use of receivers of rent in the BTL sector. Other things being equal, the use of receivership may have mitigated some increase in reported BTL arrears and possession rates and delayed the increase in reported BTL possessions.

UK-Lending-April-2015-7The rate of possession of buy-to-let properties was almost twice as high as for owner-occupied ones, even though the rate of underlying arrears on buy-to-let lending remained lower in 2014, according to data from the CML. They commented that this was because lenders offer extended forbearance to owner-occupiers to help them get through periods of financial difficulty without losing their home.

ASIC Update On CBA’s Financial Advice Compensation Programme

ASIC today released KordaMentha Forensic’s first report on past activities by Commonwealth Financial Planning Limited (CFPL) and Financial Wisdom Limited (FWL) to compensate clients, and to identify high-risk advisers and affected customers.

The report confirms the inconsistency and deficiencies of an original $52 million compensation scheme. These shortcomings, which disadvantaged some customers, led to ASIC imposing new Australian financial services (AFS) licence conditions on CFPL and FWL in 2014 .

The failings are being rectified through KordaMentha Forensic’s review. Following the release of today’s report, the first of three to be delivered to ASIC, Commonwealth Bank (CBA) will contact approximately 2740 customers to offer them up to $5000 to have their advice assessment reviewed and to seek independent advice.

KordaMentha Forensic’s second report will assess whether CFPL and FWL had a reasonable basis for identifying the clients and advisers for the original compensation scheme. If KordaMentha Forensic finds that other clients or advisers should have been captured, CFPL and FWL will be required to rectify this.

KordaMentha Forensic’s third report will provide an assessment of this work and CFPL and FWL’s compliance with the licence condition program.

Purpose and key findings of Comparison Report

KordaMentha Forensic’s Comparison Report reviews and compares CFPL and FWL’s processes for reviewing and communicating with two groups of clients:

  • Clients who received advice from banned former CFPL advisers Don Nguyen and Anthony Awkar, and who were remediated under a compensation program known as Project Hartnett; and
  • Certain clients of further former CFPL and FWL advisers, many of whom were offered compensation as a result of adviser misconduct, in a separate compensation program.

KordaMentha Forensic found three inconsistencies between the compensation programs which CFPL and FWL are required to rectify for affected clients:

  1. Initial letter: In Project Hartnett, clients received a letter indicating that the advice they received was being investigated and that CFPL would contact them with the outcome. However, most clients assessed in the Compensation Program did not receive this letter. For those clients who did receive a letter, it was often inconsistent with the Project Hartnett letters (for example, some letters did not include the adviser’s name or alert the client that the licensee was investigating concerns it had with the adviser)
  2.  Offer of up to $5000 for independent advice: In Project Hartnett, clients who received advice which was implemented were generally (but not in all cases) sent a letter which included an offer of up to $5000 for independent professional advice to help them assess the validity of the licensee’s review and any compensation offer. In the Compensation Program, the offer was discretionary – and no clients were given this offer
  3. Close-out letter: In Project Hartnett, clients who received the initial letter indicating there was an investigation being conducted into the advice provided to them, but who were determined not to be entitled to compensation, received a letter stating this result of the file review. However, in the Compensation Program, while some clients received a letter offering compensation or advising they were not entitled to compensation, most clients reviewed received no such communication. As a result they were not given an opportunity to participate in the review and decision making processes as to whether they were entitled to compensation

Following this report, the licensees will contact approximately 2740 clients offering them up to $5000 to have their financial advice independently reviewed and the other options available under the licence conditions. The licensees will also write to a further 1590 clients informing them that a review of their file found no evidence that they had received advice, but if that is not correct, the clients will be offered $5000 assistance and all the options available under the licence conditions.

KordaMentha Forensic’s work in preparation for this report also revealed that 86 clients under Project Hartnett did not receive the $5000 offer, and some clients did not receive an ‘Initial Letter’ explaining that their advice was being reviewed. CBA has given a commitment to ASIC that these clients will now be treated consistently with other clients under the licence conditions, including the $5000 offer.

Inflation – A New Zealand Perspective

A timely and interesting speech today from the Reserve Bank of New Zealand by John McDermott, Assistant Governor & Chief Economist, “The Dragon Slain?” on the subject of inflation, why its low, and the limits of monetary policy on managing it. Like Australia, there is a significant imbalance between non-tradables and tradables and from an international perspective its a global phenomenon, with inflation in 16 out of 18 countries examined below target.

Introduction

It is a pleasure for me to be here today to address the Chamber. As some of you may be aware, today is St George’s Day, the saint famous for slaying a dragon. The subject of my speech is inflation, which has in the past been likened to a dragon ravaging society. With annual inflation in the March quarter at 0.1 percent, is this another slain dragon? I do not believe so; the dragon is merely sleeping.

Inflation is currently low, and is mostly due to negative tradables inflation caused by the slow global economic recovery, the high exchange rate, and the recent sharp falls in oil prices (figure 1). There is little monetary policy can to do influence inflation outturns in the near term. Our strategy for returning inflation to the midpoint of the target range is to maintain stimulatory monetary policy to help generate output growth in excess of potential growth for an extended period.[1] This strength in aggregate demand relative to supply will help generate the inflation required to reach the midpoint objective.

Figure 1: Annual CPI headline, tradables and non-tradables inflation

jmd-the-dragon-slain_files/jmd-the-dragon-slain-speech-in-hamilton-23-april-201400.jpg

Source: Statistics New Zealand.

With the benefit of hindsight, the low inflation outturn can be explained. Tradables inflation has been negative for the past three years as a result of: the slow global recovery; weak or declining prices of capital goods manufactured products and commodities; and the strength of our exchange rate. In the three years to March 2015 the cost of new cars fell 9 percent, major household appliances 9 percent, computing equipment by 32 percent; televisions and other audio-visual equipment prices fell by 36 percent.

More recently, a sharp decline in the oil price has driven tradables inflation down even further. The fall in petrol prices alone reduced the headline inflation rate in the March quarter by 0.8 percentage points. In the face of falling oil prices, the Bank’s focus is on the medium-term trend in inflation since this is the horizon at which monetary policy can best affect inflation. The Bank is unable to offset large relative price shocks and any attempt to do so by sharply reducing interest rates would result in an unnecessary boom then slowdown in activity. Unnecessary volatility in output and interest rates that our Policy Targets Agreement directs us to avoid.

In my remarks today, I am not going to focus on the inflation numbers we received earlier this week. We will consider those, along with all the other indicators of capacity and inflationary pressures, next week in our April OCR meeting. Instead, I will offer some perspective on low inflation in New Zealand over the past couple of years. In particular, I will outline the framework we use to think about inflationary pressures in New Zealand, then consider how the global economy is affecting New Zealand inflation. I then discuss some factors that might be contributing to somewhat weaker-than-expected domestic inflationary pressures.

Inflation and its causes

At the horizon relevant for monetary policy, inflation is typically thought of as being influenced by two main factors: capacity pressure and inflation expectations. The changing balance between aggregate demand and aggregate supply over the business cycle causes inflation to rise and fall. While the long run path of output is determined by the supply side of the economy – labour supply, investment and technology[2] – over the business cycle output can be above this ‘potential’ level (a positive output gap) or below it (a negative output gap) for several years. Periods of strong demand see inflation rise, while downswings see inflation fall. The other main influence on inflation is expectations of future inflation, which people build into price and wage setting.

Economists often summarise the implications for inflation of the output gap and inflation expectations in a ‘Phillips curve’. This relationship indicates that over periods of several years inflation tends to be higher when demand is stronger; and that over the cycle and in the long run inflation will be higher when inflation expectations are higher.

The Reserve Bank pursues its inflation target by setting the Official Cash Rate (OCR). Higher interest rates tend to lower inflation over the following 18 to 24 months by slowing the growth in aggregate demand, and reducing the output gap. In the short term, movements in interest rates can also cause the exchange rate to move, affecting the New Zealand dollar prices of imports. The long lag involved from changes to the OCR having their full effect on inflation requires the Reserve Bank to react to expected future inflationary pressure rather than past outturns.[3]

International factors

The sharp decline in global oil prices over the past year has had a large impact on headline inflation. The Dubai price for crude oil is now 44 percent below its June 2014 peak. This lower oil price affects domestic prices through several channels.[4] It directly affects the price of petrol paid by consumers; petrol prices are 15 percent lower than a year ago, reducing headline CPI inflation by 0.8 percentage points. If petrol prices remain unchanged over the coming year, this reduction will unwind, boosting annual inflation by 0.8 percentage points.

Falling oil prices indirectly affect consumer prices by reducing the production costs of other businesses. How much, depends on the share of oil and petrol in total costs, businesses’ expectations of how permanent the fall will be, and how businesses change their prices in relation to changes in costs. Our research on price-setting behaviour suggests that New Zealand businesses are more likely to pass on to customers an increase in costs than a decrease.[5]

The significance of this sharp decline in oil prices for inflation depends on whether the fall is caused by factors specific to the oil market, or is symptomatic of a more general fall in global economic activity. The Bank’s view is that this drop in oil prices is caused by a mix of factors, but primarily increased supply.

When declining oil prices reflect factors specific to the oil sector, it should be viewed as a relative price shift, rather than generalised inflation. It is a positive supply shock for New Zealand: it lowers inflation and boosts output. Since monetary policy operates with a lag, it cannot react to the immediate impact of oil prices on inflation. Any such response would affect output and inflation after the initial impact on petrol prices has left the annual inflation rate. The Policy Targets Agreement directs the Reserve Bank to avoid unnecessary volatility in output and interest rates and instead focus on medium-term inflationary pressure.

Inflation is low globally (figure 2), and below target in 16 out of 18 inflation targeting countries.[6] The low inflation reflects falling oil prices and the prolonged period of excess capacity in most advanced economies. But even accounting for oil and weak capacity pressures, inflation is weak in our trading partners, and lower than policymakers had forecast.[7] Weak inflation and continued excess capacity have resulted in extraordinarily supportive monetary policy across the world.

Figure 2: World inflation 2008 Q3 and 2014 Q4

jmd-the-dragon-slain_files/jmd-the-dragon-slain-speech-in-hamilton-23-april-201401.jpg

jmd2014q4

Source: IMF, ILO, Eurostat, Haver Analytics, Thomson Reuters Datastream and various national sources.

Global inflation affects inflation in New Zealand via two main channels.[8] Low inflation in our trading partner economies results in small international price increases for New Zealand’s imports. Extremely low, and in some cases negative, interest rates overseas have been a factor causing an appreciation of the New Zealand dollar, which further depresses import prices when expressed in New Zealand dollar terms.

The pass-through of global inflation to New Zealand import prices seems to be taking place in a normal way (figure 3). Similarly, tradable CPI inflation appears consistent with the movements in import prices. Nonetheless, the combination of surprisingly weak inflation overseas and our high exchange rate are the principal reasons why we have had downside surprises to headline inflation.

Figure 3: Trading partner export prices and New Zealand import prices (US dollar terms)[9]

jmd-the-dragon-slain_files/jmd-the-dragon-slain-speech-in-hamilton-23-april-201403.jpg

Source: Haver Analytics, Statistics New Zealand and RBNZ estimates.

While the weakness in tradables inflation is explainable given international factors, non-tradables inflation has also been weaker than expected. In part the weakness in non-tradables may be influenced by international factors, since around a tenth of non-tradable prices are accounted for by imports.[10] Indeed, looking more closely at non-tradables, the sectors that are relatively more open to international competition exhibit lower inflation at present.[11]

Domestic inflationary pressures

While non-tradables account for a small part of the overall weakness in headline inflation, the dynamics of non-tradables inflation is central to our strategy of returning inflation to the target midpoint. In this context I will discuss our estimates of spare capacity in the economy, how that spare capacity affects price and wage-setting behaviour, and the inflation expectations of wage and price setters. None of these areas are directly observable, and require estimation by economic models based on available indicators.

Spare capacity in New Zealand

Estimates of the output gap are difficult to carry out in real time, and can be heavily revised. To mitigate this uncertainty, we corroborate our estimates of the output gap from our main model with a range of other indicators of capacity pressures. These measures suggest that the output gap was negative for much of the past couple of years, explaining why non-tradables inflation has been weak. The indicators point to the current output gap being positive, at around half a percent of potential output (figure 4). Monetary policy is currently supportive, which should help to drive the output gap higher in coming quarters and generate the additional inflation to return to the target midpoint.

Figure 4: Output gap and indicator suite (percent of potential output)

jmd-the-dragon-slain_files/jmd-the-dragon-slain-speech-in-hamilton-23-april-201404.jpg

Source: RBNZ estimates.

The weakest indicators, though, are consistent with a negative output gap, and hence lower inflationary pressure. The weakest one at present is based on the unemployment rate, which could be influenced by immigration and structural changes in participation. Net immigration is running at historically high levels, and has two offsetting effects on inflationary pressure. Immigrants require housing and new capital equipment to work, increasing aggregate demand. At the same time, immigrants may increase the labour force, increasing supply in the economy and reducing wage inflation. These offsetting forces make it hard to calibrate the net effect of migrants on the output gap in the short run.[12]

Labour force participation in New Zealand is currently at record levels, due to the upward trend in participation of female workers and higher participation among older cohorts. Should that high rate of participation prove permanent it would imply a greater level of potential output than we currently estimate, a smaller positive output gap and lower non-tradable inflation.

The impact of capacity pressure on inflation

All of the various indicators of capacity pressures have one thing in common. Each indicator shows a gradual tightening of capacity pressure over the past couple of years, which should be consistent with gradually increasing inflationary pressures and higher inflation outcomes. The subdued nature of the actual increase in domestic inflationary pressure raises the question of whether the output gap is having a smaller influence on actual inflation than it has in the past. In other words, has the slope of the Phillips curve become flatter?

Consider a stylised version of the New Zealand Phillips curve, mapping the outturns for inflation and a simple output gap measure – the deviation of unemployment from trend (figure 5).[13] During the 1970s, there were large movements in inflation without much corresponding movement in the unemployment gap. In part this may be a function of labour hoarding by businesses as the general shortage of labour made them reluctant to lay off workers even faced with large swings in output.

Figure 5: New Zealand Phillips curves

jmd-the-dragon-slain_files/jmd-the-dragon-slain-speech-in-hamilton-23-april-201405.jpg

Source: Statistics New Zealand, RBNZ estimates.

During the 1980s, there is a clear negative relationship, with higher unemployment gaps associated with lower outcomes for inflation. Since the introduction of inflation targeting in 1990, the curve is markedly flatter – large movements in the unemployment gap have not resulted in corresponding changes in inflation. The flattening of the Phillips curve is witnessed in many countries. Nonetheless, experience since the global financial crisis has led many policymakers to question whether it has flattened further in recent years.[14] During the depths of the global financial crisis, non-tradables inflation remained stubbornly high, in New Zealand and elsewhere, despite large negative output gaps.

This anchoring of inflation at low levels represents a success for the monetary policy framework, as shocks hitting New Zealand do not result in big changes to general price inflation. But it also poses a challenge. With a flat Phillips curve it becomes more difficult for the Reserve Bank to influence inflation by affecting the demand for resources and the size of the output gap. The current flatter Phillips curve could mean that the positive output gap is exerting less inflationary pressure than we currently believe, slowing our eventual return to target midpoint.

Has pricing behaviour changed?

Survey measures of inflation expectations have fallen in recent quarters. The decline in expectations is consistent with the decline in actual inflation over the period. In the decade to 2012, CPI inflation averaged 2.6 percent and was in the upper half of the Reserve Bank’s target range. The current Policy Targets Agreement (signed in 2012) put greater focus on achieving the midpoint of the target range, so some decline in inflation expectations should be expected. Lower inflation expectations have been observed across the globe.[15]

What matters for inflation is not the average response to a particular survey of expectations, but how general inflation expectations held by businesses and households translate into price-setting behaviour and wage bargaining. Research on price-setting by New Zealand businesses suggest that many only take into account current inflation when setting prices, and very few businesses are purely forward looking.[16] Preliminary work on wage setting in New Zealand also points to the importance of past inflation outturns.[17]

The evolution of inflation expectations over coming quarters merits vigilance. If price and wage setting is very backward looking, the temporarily low headline inflation from falling petrol prices could become more widely entrenched.[18] There is certainly a growing discussion of low inflation captured in the media (figure 6). Recent research has pointed to possible asymmetries in behaviour, with inflation expectations becoming more backward looking in periods of low inflation, and reacting more to downside inflation surprises than upside ones.[19] A certain degree of movement in expectations is to be expected, particularly for short-term measures, but the more firmly anchored expectations are, the smaller the overall inflation impact.[20]

Figure 6: Media articles in New Zealand citing ‘low inflation’

jmd-the-dragon-slain_files/jmd-the-dragon-slain-speech-in-hamilton-23-april-201406.jpg

Source: Fuseworks, Statistics New Zealand.

Longer-term survey measures of inflation expectations are currently consistent with the midpoint of our target (figure 7). Estimates from a range of economic models are somewhat lower and have declined recently. A market-based measure using the return on an inflation-indexed bond has also fallen sharply over the past year.[21] The level of these other measures are consistent with inflation expectations at or just below the target midpoint of 2 percent, but all highlight the downward direction over the past year (table 1).[22]

Figure 7: Long-term inflation expectations

jmd-the-dragon-slain_files/jmd-the-dragon-slain-speech-in-hamilton-23-april-201407.jpg

Source: Aon, Statistics New Zealand, RBNZ/UMR.

Table 1: Summary of inflation expectation measures

Current estimate Range for current estimate Direction of change in last year Consistent with midpoint
Survey measures* 2.1 1.8 – 2.2
Model-based measures 1.4 1 – 1.5
Market based measure 1.5 1.5
*Excluding surveys of less than 1-year ahead

The outlook for monetary policy

I have talked today about the causes of recent low inflation in New Zealand. The outlook for inflation is also subdued, and suggests that monetary policy should remain stimulatory for a prolonged period. This cycle is unusual in that CPI inflation is staying very low, requiring interest rates to also remain low. The timing of future adjustments in interest rates will depend on the evolution of inflationary pressures in both the traded and non-traded sectors. We continue to monitor and carefully assess the emerging flow of economic data.

The impact of some factors influencing headline inflation will prove temporary. Past declines in oil prices will reduce headline inflation substantially in 2015, but absent any further falls this negative contribution will drop out of the annual inflation rate by the start of next year.

Looking ahead, we will ensure that monetary policy is stimulatory to support output growth above potential. Increasingly, this positive output gap will help lift non-tradables inflation, returning headline inflation gradually to the target midpoint. Real GDP growth has been above potential growth for a number of years and is currently underpinned by high net immigration, strong construction activity and robust household spending. Employment growth is strong and the unemployment rate is low and projected to fall.

At present, the Bank is not considering any increase in interest rates. Before considering any tightening in monetary policy we would need to be confident that increased capacity utilisation and labour market tightness was generating, or about to generate, a substantial increase in inflation.

Evidence of weakening demand and domestic inflationary pressures would prompt us to consider lowering interest rates. There are some areas of uncertainty surrounding the outlook for capacity pressures, including the lingering effects of the recent drought in parts of the country, fiscal consolidation, lower dairy incomes and the impact of the high exchange rate on some export and import substitution industries. Beyond these factors, we are also assessing the outlook for tradables inflation that is being dampened by global conditions and the high exchange rate. The fact that the exchange rate has appreciated while our key export prices, such as dairy, have been falling, is unwelcome.

We remain vigilant in watching wage bargaining and price-setting outcomes. Should these settle at levels lower than our target range for inflation, it would be appropriate to ease policy.

Concluding comments

Inflation has been low in New Zealand for a number of years. At present, the outlook requires a period of supportive monetary policy. Our approach, as a flexible inflation targeter, is to support ongoing sustainable growth in New Zealand that should help raise costs and prices in order to achieve our inflation target. We will not react to temporary deviations from target, as this will only generate unnecessary volatility in activity.


[1] In setting monetary policy, we have to consider whether we have calibrated the degree of monetary stimulus correctly. In our framework we measure the degree of monetary policy stimulus by the gap between actual interest rates and the so-called neutral interest rate. Our current estimate is for a neutral 90-day rate of 4.5 percent. We lowered our estimate of the neutral rate following the global financial crisis to reflect the higher debt levels of households and higher financing costs pushing up the spread between the 90-day rate and the interest rate on household mortgages. See McDermott, J (2013), ‘Shifting gear: why have neutral interest rates fallen’, Assistant Governor, RBNZ. Speech to New Zealand Institute of Chartered Accountants CFO and Financial Controllers Special Interest Group in Auckland, 2 October; and Chetwin, W and A Wood (2013), ‘Neutral interest rates in the post-crisis world’, RBNZ Analytical Note, No. 2013/07.

[2] For a detailed description of our modelling framework for potential output, see: McDermott, J (2014), ‘Realising our potential: potential output and the monetary policy framework’, Assistant Governor, RBNZ. Speech to the Wellington Chamber of Commerce, 9 July and Lienert, A and D Gillmore (2015), ‘The Reserve Bank’s method of estimating “potential output’, RBNZ Analytical Note, 2015/01.

[3] This is a broad, high-level summary of our framework. In carrying out a monetary policy review we take into consideration a wide range of factors, which I do not have time to detail today. In these remarks I am focusing on the key issues around the dynamics of inflation.

[4] See Chapter 6 of the March 2015 Monetary Policy Statement for a fuller description of the impact of oil prices on consumer prices.

[5] Parker, M (2014c), ‘Price-setting behaviour in New Zealand, RBNZ Discussion Paper, No. 2014/04.

[6] Carney, M (2015), ‘Writing the path back to target’, Governor, Bank of England. Speech at the University of Sheffield Advanced Manufacturing Research Centre, 12 March.

[7] E.g. Bank of Canada (2014), ‘Box 2: Assessing the impact of excess supply on inflation’, Monetary Policy Report, April. Carney, M (2015) ibid., Haldane, A (2015), ‘Drag and drop’, Chief Economist, Bank of England. Speech at the Bizclub lunch, Rutland, 19 March. Sveriges Riksbank (2014), ‘Why is inflation low?’, Monetary Policy Report, July.

[8] For a more detailed description of how the international situation passes through to New Zealand consumer prices, see Parker, M (2014a), ‘Exchange-rate movements and consumer prices: some perspectives’, RBNZ Bulletin, 77 (1, March): 31-41.

[9] The series for China has a shorter history, but adding it does not qualitatively affect the path for trading partner export prices.

[10] Parker, M (2014b), ‘How much of what New Zealanders consume is imported? Estimates from input-output tables’, RBNZ Analytical Note, No. 2014/05.

[11] See Galt, M (2015), ‘How do international factors affect non-tradable inflation? Exploratory analysis using disaggregated trans-Tasman data’, RBNZ Analytical Note. Forthcoming. Nonetheless, even accounting for global inflation factors, inflation in New Zealand appears weak, see Richardson, A (2015), ‘The pass-through of global economic conditions to New Zealand inflation’, RBNZ Analytical Note. No. 2015/03.

[12] Our own research suggests that different types of immigrants to New Zealand have differing implications for overall inflationary pressure. See McDonald, C (2013), ‘Migration and the housing market’, RBNZ Analytical Note, No. 2013/10.

[13] The unemployment gap is calculated at the percentage point deviation of the actual unemployment rate from a trend calculated using a stiff Hodrick-Prescott filter (lambda = 50000). A positive unemployment gap represents slack in the labour marker, so would be equivalent to a negative output gap.

[14] See Yellen, J (2014) ‘Labor market dynamics and monetary policy’, Chair, Board of Governors of the Federal Reserve System. Speech given at the Federal Reserve Bank of Kansas City Economic Symposium, Jackson Hole. Haldane, A (2015), op.cit. The IMF estimates that the slope of the global price Phillips curve has fallen from around 1 in the 1970s to 0.1-0.2 most recently. See IMF (2013), ‘The dog that didn’t bark: Has inflation been muzzled or was it just sleeping?’, World Economic

Outlook, April 2013.

[15] For example, see Nechio, F (2015), ‘Have long-term inflation expectations declined?’, Federal Reserve Bank of San Francisco Economic Letter, No. 2015-11; Haldane, A (2015) op cit.; Miccoli, M and S Neri (2015) ‘Inflation surprises and inflation expectations in the euro area’, Banca d’Italia Occasional Papers, No. 265.

[16] Parker, M (2014c), op. cit.

[17] Armstrong, J and M Parker (2015) ‘How wages are set: evidence from a large survey of firms’, Reserve Bank of New Zealand. Forthcoming.

[18] Our research suggests that when supply shocks are permanent in nature, monetary policy will need to focus more on inflation outturns and less on the output gap than is the case when supply shocks are temporary. The intuition behind this result is that with supply shocks having permanent effects, inflation expectations will eventually become unanchored unless the central bank acts to keep inflation stationary around target. See Yao, F (2014), ‘Stabilising Taylor rules when the supply shock has a unit root’, Journal of Macroeconomics. Forthcoming.

[19] Ehrmann, M (2014), ‘Targeting inflation from below – how do inflation expectations behave?’, Bank of Canada Working Paper, No. 2014-52. The impact of downside surprises in inflation outturns on expectations has been observed recently in the euro area, see Miccoli, M and S Neri (2015) op. cit.

[20] Wong, B (2014), ‘Inflation expectations and how it explains the inflationary impact of oil price shocks: evidence from the Michigan survey’, CAMA Working Paper, No. 45/2014. demonstrates these facts for the United States following oil price shocks using the Michigan survey of household inflation expectations.

[21] Limited liquidity in this bond, and the lack of a long history suggests caution should be taken over the reliability of this measure, but the direction of change is indicative of lower inflation expectations.

[22] Lewis, M (2015), ‘Measuring inflation expectations’, RBNZ Analytical Note. Forthcoming.
Core CPI Right In RBA Target Range

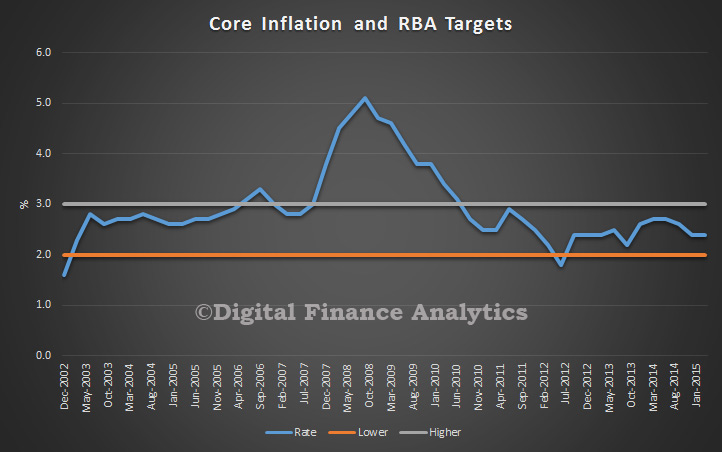
The Consumer Price Index (CPI) rose 0.2 per cent in the March quarter 2015, following a rise of 0.2 per cent in the December quarter 2014, according to data released by the Australian Bureau of Statistics (ABS) today. The CPI rose 1.3 per cent through the year to the March quarter 2015, following a rise of 1.7 per cent through the year to the December quarter 2014. The reading is flattered by a significant fall in fuel.

The underlying rate was 2.4%, right within the RBA target range, a little higher than expected, and as such it will more than likely tip the RBA in “hold” territory next month, when coupled with better than expected previous employment data, and hot Sydney property. Moreover, little evidence that a further cut would change the picture much (other than reducing savers ability to spend).

CPICoreApril2015
The most significant price rises this quarter were in domestic holiday travel and accommodation (+3.5 per cent), tertiary education (+5.7 per cent) and medical and hospital services (+2.2 per cent), These rises were partially offset by falls in automotive fuel (—12.2 per cent) and fruit (—8.0 per cent). The decrease in fuel was registered in all fuel types with the quarterly fall the largest since December 2008 and over the twelve months to March 2015, automotive fuel has decreased by 22.5 per cent. This is the largest yearly fall in the history of the series, beginning in September 1973.

Land Prices Driven Higher – HIA-CoreLogic RP Data

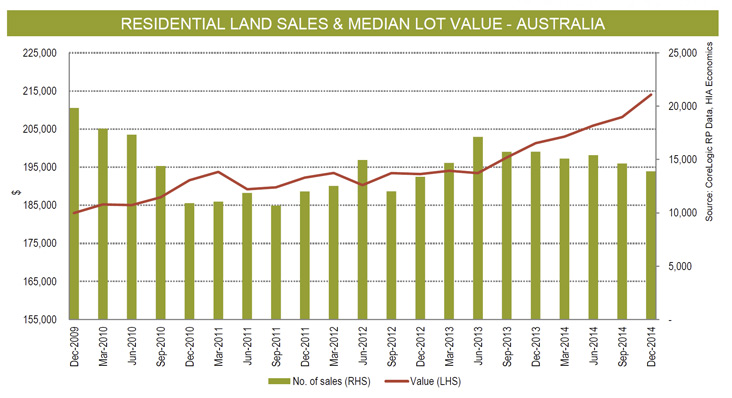
The latest HIA-CoreLogic RP Data Residential Land Report provided by the Housing Industry Association, and CoreLogic RP Data, signals disequilibrium between demand and available supply in vacant residential land.

Whilst the number of residential land sales fell by 11.8 per cent over the year to the December 2014 quarter, the weighted median residential land value increased by 2.8 per cent in the December 2014 quarter to be up by 6.3 per cent over the year. The increase in the weighted median value was driven primarily by Sydney, with significant growth also evident for Perth and Melbourne.

As with all aspects of this housing cycle, there are wide divergences in land market conditions around the country – this is clearly evident across the six capital cities and 41 regional areas covered in the Residential Land Report. Construction of detached houses looks to be peaking for the cycle, but there is unrealised demand out there because of that lack of readily available and affordable land.

The price of residential land per square metre increased in Sydney, Melbourne and Perth in the December 2014 quarter, with Sydney remaining the country’s most expensive land market by some margin. Across regional Australia, the most expensive residential land markets are the Gold Coast and the Sunshine Coast in Queensland, and the Richmond-Tweed region in New South Wales. The least expensive markets can be found in the South East region of South Australia, and the Mersey-Lyell and Southern regions of Tasmania.

LandSupplyApr2015

RBA Glass Is Half Full

The RBA minutes were released today, confirming that the board is waiting for more data, especially on inflation. They acknowledge slow wage growth and declining savings and a slow pickup in the non-mining sector. They also acknowledged risks in the housing market, especially in Sydney.  I have to say, they appear to be in the “glass half full” side of the room. Also. movements in exchange rates just before the last two rate announcements were referred to ASIC but no issues have been identified. Here is the release:

International Economic Conditions

Members noted that growth of Australia’s major trading partners had continued at around its average pace in early 2015. Growth in China looked to have eased a little further and this was likely to have contributed to further declines in iron ore and coal prices. Globally, the fall in oil prices in the second half of 2014 had led to lower inflation and was expected to provide additional support to demand in Australia’s trading partners. Monetary policies remained very accommodative.

In China, the authorities had announced a target for GDP growth in 2015 of 7 per cent, ½ percentage point below the target for 2014. Recent indicators suggested that economic conditions had softened. Growth of fixed asset investment had been slowing, particularly in real estate and manufacturing, and prices of residential property and sales volumes had declined further. Members noted that the deterioration in conditions in the property market had increased the vulnerability of leveraged property developers and local authorities that relied on revenue from land sales to support their infrastructure investment. They also noted that the central authorities had indicated a willingness to adjust policies to support employment growth, while remaining committed to putting financing on a more sustainable footing. The weakness in the property market in China had flowed through to slower growth in the demand for steel, which had, in turn, contributed to the recent falls in iron ore prices, even though Chinese imports of Australian iron ore had continued to increase.

The modest recovery of the Japanese economy was continuing. Labour market conditions remained tight and the recent annual spring wage negotiations had resulted in several large companies increasing base wages by more than they did a year earlier. In the rest of the Asia-Pacific region, growth had continued at around its average pace of the past decade, although there had been variation in the composition of growth across the region.

Members observed that the US economy had continued to grow, but that the pace of growth may have moderated in the early months of this year partly in response to the temporary effects of adverse weather conditions and industrial action at some ports. Labour market conditions had strengthened further over the past six months or so; employment had increased at around its fastest pace in several years and the unemployment rate had declined further. Members noted that overall wage growth in the United States remained subdued. The Federal Open Market Committee (FOMC) had indicated that it was likely to begin the process of normalising interest rates in the second half of this year if economic conditions continued to evolve as expected.

In the euro area, economic activity had continued to recover gradually. The unemployment rate had declined a little further and there had been a noticeable lift in activity in some euro area periphery economies. Lower oil prices had reduced consumer price inflation significantly, but core measures of consumer price inflation had not changed much in recent months and remained well below the target of the European Central Bank (ECB). There had been some signs that conditions in the construction sector had stabilised and credit to both households and businesses was increasing, albeit gradually.

Members observed that bulk commodity prices had declined further over the past month. Although much of the decline over 2014 was driven by expansion in global supply, the slowing in growth of Chinese demand had contributed more recently. A small (but increasing) share of Australian iron ore production was estimated to be unprofitable at prevailing prices, while the decline in oil prices since the middle of 2014 was expected to lower the prices of Australian liquefied natural gas exports over the next few months.

Domestic Economic Conditions

The December quarter national accounts, which were released the day after the March meeting, confirmed that the Australian economy had grown at a below-average pace over 2014. Members noted that growth in dwelling investment, consumption and resource exports had picked up, but that business investment had continued to fall and public demand had made little contribution to growth over the year. Recent indicators suggested that the below-trend pace of GDP growth had continued into the March quarter.

Overall conditions in the housing market had remained strong, supported by very low interest rates and relatively strong population growth. Housing prices had continued to rise strongly in Sydney and, to a lesser extent, Melbourne, but growth in prices had eased recently in some other parts of the country. Other indicators of activity had also suggested strong conditions in the established housing market in Sydney and Melbourne. Housing credit overall had been growing at about 7 per cent in six-month-ended annualised terms, while credit to investors had grown at a pace a little above 10 per cent on the same basis. Recent data on loan approvals suggested that growth in housing credit was likely to continue at this pace, but not accelerate, in the months immediately ahead. Meanwhile, new dwelling approvals and loan approvals for new construction were at high levels, pointing to strong growth in dwelling investment over coming quarters.

Household consumption had increased in the December quarter, supported by low interest rates and rising household wealth. Even so, growth in household consumption over the second half of 2014 had been slightly below average, reflecting subdued growth in household income, while the saving ratio had continued its gradual decline of the past two years. More timely data had indicated that growth in the value of retail trade in January and February was about average and that consumer confidence had been close to average levels.

Mining investment was estimated to have declined by 13 per cent over 2014 and an even larger decline was expected over 2015. Moreover, members observed that the recent declines in oil prices could lead to some scaling back of investment plans in the oil and gas sector. Non-mining investment had been subdued for some time. Forward-looking indicators (such as the ABS capital expenditure survey and non-residential building approvals) as well as liaison suggested that it was likely to remain subdued, and could even decline, over the next year or so. Members noted, however, that there had been a pick-up in growth of credit to businesses of late. They also observed that the strongest improvement in investment intentions (apparent in the recent capital expenditure survey) had been recorded for industries experiencing the strongest output growth, such as rental, hiring & real estate and retail trade. More recently, survey measures of business confidence and capacity utilisation remained a little below average, while measures of business conditions were around average levels.

Members observed that there had been significant variation in the composition of domestic demand growth across the states over the course of 2014. Dwelling investment and consumption had contributed to growth in all states, whereas business investment had subtracted from growth in Queensland and Western Australia, mainly reflecting the decline in mining investment in these states. Members noted that public demand had contributed to domestic demand growth only in New South Wales and Victoria over the year and had made no contribution to output growth for the country as a whole.

Resource exports had grown strongly in the December quarter and there were early indications of strength in resource exports in the first few months of 2015. However, lower commodity prices were expected to lead to some reduction in the growth of production, and therefore exports, in 2015, particularly for coal. The data for recent quarters were consistent with the lower exchange rate having provided support to net exports, particularly for services.

Recent employment growth had been stronger than a year earlier, but it was still below the growth of the working-age population. Consequently, the unemployment rate had continued its gradual upward trend of recent years, notwithstanding a modest decline in February to 6.3 per cent. Other indicators, such as hours worked and the participation rate, had provided further evidence of spare capacity in the labour market. The various forward-looking indicators were stronger than a year earlier, but remained at levels consistent with only modest employment growth in the months ahead.

Members noted that the national accounts measures of wage growth had remained subdued. Combined with some pick‑up in labour productivity growth over recent years, this had meant that unit labour costs had not changed much for about three years. Various measures of inflation expectations had remained slightly below their longer-run averages.

Financial Markets

The Board’s discussion of financial markets commenced with the unusual trading in the Australian dollar that occurred in the period immediately prior to the announcement of the Board’s decisions in both February and March. Members noted that the illiquid conditions that existed in the foreign exchange market at that time meant that small trades could move the price by relatively large amounts, and that once such movements occurred it would be highly likely that algorithmic trading strategies would exacerbate such movements, particularly given the illiquid environment. Moreover, the occurrence of these movements meant that liquidity was likely to decline further as more liquidity providers pulled back from the market during this window.

Members were aware of the investigations currently being undertaken by the Australian Securities and Investments Commission and were informed that internal work since the March meeting had not identified any evidence of procedural lapses or conduct that could have led to the early release of relevant information.

Global financial markets over the past month had continued to focus on the expected path of US monetary policy as well as the strained relationship between the Greek Government and its creditors.

Members noted that projections by members of the FOMC for the path of the federal funds rate had been revised down at the FOMC’s March meeting. Those projections remained above market expectations, which had flattened further following the FOMC’s reassessment and again after the release of weaker-than-expected employment data for March. Markets expected the first rise in the US federal funds rate to occur towards the end of the year.

Members also noted that negotiations between the new Greek Government and the European Commission, the ECB and the International Monetary Fund were fraught. As a result, there was some risk that Greece would not receive assistance funds in a timely fashion and the government would continue to rely on emergency measures to cover its liquidity needs. Greek banks in particular continued to face deposit outflows and had lost access to private funding markets, and as a result had increased their reliance on ECB funding. On a more positive note, members observed that there continued to be little contagion to other euro area periphery countries.

Members were briefed about the ECB’s balance sheet expansion in March, mainly reflecting lending to banks under its latest targeted longer-term refinancing operation and the commencement of government bond purchases. The ECB had also announced in March that it would not purchase bonds that carried yields below the rate that it paid on deposits (at present –0.2 per cent), indicating that the ECB would need to buy relatively long-dated German Bunds.

Government bond yields in most of the major economies remained at very low levels. They had shown little net change in the United States and Japan, while yields on long-term German Bunds had declined further following the launch of the ECB’s sovereign bond purchasing program. Domestically, longer-term government bond yields had also declined and the 10-year Australian bond yield was around its record low, with the spread to US yields close to its lowest level since 2001.

There were sizeable rises in equity prices in European and Japanese markets in March, while equity prices in China had increased by 15 per cent over the past month and by 90 per cent since the middle of 2014. In contrast, equity prices in Australia had been little changed in March. Prices of resource stocks remained under pressure.

The US dollar had appreciated a little further on a trade-weighted basis over March, taking the rise since July 2014 to 14 per cent. Over the same period, members observed that both the euro and the Australian dollar had depreciated by around 20 per cent against the US dollar. While the renminbi had both appreciated and depreciated at different times since July 2014, these moves had roughly netted out against the US dollar overall and the renminbi had therefore appreciated noticeably against most other currencies. Members also noted that the Australian dollar had recorded an all-time low against the New Zealand dollar.

Members concluded their discussion of financial markets with the observations that lending rates for business and housing in Australia had continued to edge down over the previous month, and that financial markets assigned a high probability to a reduction in the cash rate at the current meeting, and an even higher probability to a reduction occurring by the May meeting.

Considerations for Monetary Policy

Members’ overall assessment was that the outlook for global economic growth had not changed significantly over the past month and that it would be supported by stimulatory monetary policies and the fall in the price of oil since mid 2014. They observed that the apparent slowing of growth in China, in particular the further deterioration in conditions in the Chinese property market, had placed some additional downward pressure on the demand for steel and on the prices of Australia’s key commodity exports. Conditions in global financial markets had remained very accommodative. Changes to the stance of monetary policy by any of the major central banks and further significant developments in Europe had the potential to affect financial market conditions in Australia, including the exchange rate, over the coming year.

Data available at the time of the meeting suggested that the Australian economy had continued to grow somewhat below trend in the December quarter and into the first quarter of 2015. There had been evidence to suggest that the growth in consumption and dwelling investment had picked up, supported by the very low levels of interest rates. Exports were also growing. However, a significant pick-up in non-mining business investment was yet to occur and several indicators suggested it would remain subdued for longer than had earlier been anticipated. At the same time, the recent declines in bulk commodity prices could, at the margin, lead to a larger-than-expected fall in mining investment and some decline in the production of iron ore and coal. Data for the labour market suggested that the economy was likely to be operating with a degree of spare capacity for some time and that labour market conditions were likely to remain subdued. As a result, wage pressures were expected to remain contained and inflation was forecast to remain consistent with the target over the next year or so.

Members remained alert to the possibility that the low levels of interest rates could foster imbalances in the housing market. The most recent data suggested that activity in the housing market had remained strong, but there had been little change to housing market conditions overall or in the growth of housing credit in early 2015. Although prices continued to rise rapidly in Sydney and, to a lesser extent, Melbourne, trends elsewhere were more varied. Members noted that the Bank was working with other regulators to assess and contain risks arising from the housing market.

Overall, members considered that the current setting of monetary policy was accommodative and providing support to the economy. They also acknowledged that a lower exchange rate would help achieve more balanced growth in the economy. Further depreciation of the Australian dollar was likely given the recent declines in key commodity prices.

In considering whether or not to reduce the cash rate further at this meeting, members discussed the various channels through which monetary policy was affecting the economy at present, including the asset price and exchange rate channels. In assessing the operation of the cash flow channel in particular, they noted that the responsiveness of borrowers and savers to changes in interest rates and asset prices was unusually uncertain in a world of very low interest rates and high household leverage. Members also saw advantages in receiving more data, including on inflation, to assess whether or not the economy was on the previously forecast path and allowing more time for the economy to respond to the reduction in the cash rate earlier in the year.

Taking all these factors into account, the Board judged that it was appropriate to hold interest rates steady for the time being, while accepting that further easing of policy may be appropriate over the period ahead to foster sustainable growth in demand and inflation consistent with the target. The Board would continue to assess the case for such action at forthcoming meetings.

The Decision

The Board decided to leave the cash rate unchanged at 2.25 per cent.

RBA – Willing To Lower Rates Further, But May Not Be That Effective

Glenn Stevens speech, The World Economy and Australia given to The American Australian Association luncheon in New York, included comments on both the world economy, and conditions in Australia. It contained a clear signal the RBA is willing to lower rates further, and the expectation the dollar has further to fall. But it also refers to the limits of monetary policy when household debt is so high. Overall a balanced set of comments. Here is the transcript:

The World Economy

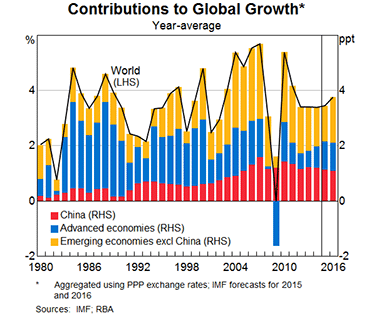
There are about as many indicators of the world economy as there are people studying it. My remarks will be fairly high-level, and since we have just had the IMF meetings, it seems appropriate to begin with the picture they present. The Fund’s latest publication estimates that output in the world economy grew by 3.4 per cent in 2014 (Graph 1). This is a bit shy of the long-run average of 3.7 per cent, and actually fractionally above the previous estimate in October. The projections are for a slight pick-up in 2015 and around average growth in 2016. These figures are broadly in line with the private sector consensus.

Most of the recent growth has come from the emerging world. As a group, the emerging world grew by 4½ per cent in 2014. China grew by about 7½ per cent, more or less as the authorities intended. It will probably grow by a little less in 2015; the IMF is saying below 7 per cent. But given its size now, China growing at 6–7 per cent would still be a major contributor to global growth. Indeed, the current projections have China contributing about the same growth in global output in 2015 and 2016 as it did in recent years. Meanwhile, growth looks to have picked up in India but softened in some other emerging markets.

Graph 1

Graph 1: Contributions to Global Growth

In the major advanced economies, in contrast, growth has generally been below previous averages for quite a number of years. It has taken longer to recover than we had all hoped. There are, happily, some signs of improvement at present. Growth is slowly recovering in the euro area and has resumed in Japan. In the United States, notwithstanding some recent softer numbers, the economy looks to have pretty reasonable momentum. So it would appear that we are heading in the right direction.

Unfortunately, that doesn’t mean the legacy of the 2008 crisis is yet behind us. From the vantage point of most central banks, the world could hardly, in some respects, look more unusual. Policy rates in the major advanced jurisdictions have been near zero for six years now. In fact, official deposit rates in the euro area and some other European countries are now negative. As it turns out, the ‘zero lower bound’ wasn’t actually at zero. Central bank balance sheets in the three large currency areas have expanded by a total of about US$5½ trillion since 2007, and the ECB and Bank of Japan will add, between them, about another US$2½ trillion to that over the next couple of years.

That central banks have had to take such extraordinary measures speaks both to the severity of the crisis that these countries faced and the limited capacity of other policies to support growth. History tells us that recovering from a financial crisis is an especially long and painful process, and more so if other countries are in the same boat.

The direct effect of this unprecedented monetary easing has been to lower whole yield curves to extraordinarily low levels, and that process is continuing. The most pronounced effects can be seen in Europe. If one were to invest in German government debt for any duration short of nine years, one would be paying the German government to take one’s money. The same can be said for Swiss government debt. Even some corporate debt in Europe has traded at negative yields. It seems likely that these European developments are also affecting long-term interest rates in the United States.

These ultra-easy monetary policies have helped along the process of balance sheet repair, bringing households and businesses closer to the point where they can start to spend and hire and invest again. And, it has to be observed, it has made fiscal constraints on governments much less binding than they would otherwise have been. Lower interest rates also increase the value of assets that can be used as collateral. Banks’ willingness to supply credit is affected by their balance sheet’s strength, of course, but it seems to be improving even in Europe at present. For larger businesses with access to capital markets, borrowing terms have probably never been more favourable.

Such policies are, then, working through the channels available to them to support demand. But these channels are financial in nature. They don’t directly create demand in the way that, for example, government fiscal actions do. They work on the incentives for private savers, borrowers and investors to alter their financial behaviour and, it is hoped in time, their spending behaviour.

A striking feature of the global economy, according to World Bank and OECD data, is the low rate of capital investment spending by businesses. In fact, the rate of investment to GDP seems to have had a downward trend for a long time.

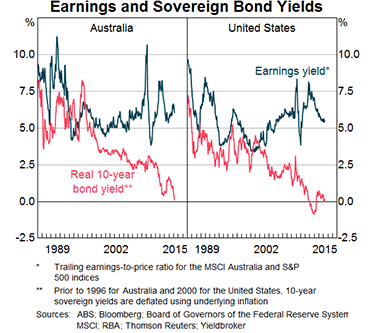
One potential explanation is that there is a dearth of profitable investment opportunities. But another feature that catches one’s eye is that, post-crisis, the earnings yield on listed companies seems to have remained where it has historically been for a long time, even as the return on safe assets has collapsed to be close to zero (Graph 2). This seems to imply that the equity risk premium observed ex post has risen even as the risk-free rate has fallen and by about an offsetting amount. Perhaps this is partly explained by more sense of risk attached to future earnings, and/or a lower expected growth rate of future earnings.

Graph 2

Graph 2: Earnings and Sovereign Bond Yields

Or it might be explained simply by stickiness in the sorts of ‘hurdle rates’ that decision makers expect investments to clear. I cannot speak about US corporates, but this would seem to be consistent with the observation that we tend to hear from Australian liaison contacts that the hurdle rates of return that boards of directors apply to investment propositions have not shifted, despite the exceptionally low returns available on low-risk assets.

The possibility that, de facto, the risk premium being required by those who make decisions about real capital investment has risen by the same amount that the riskless rates affected by central banks have fallen may help to explain why we observe a pick-up in financial risk-taking, but considerably less effect, so far, on ‘real economy’ risk-taking.

Potential Vulnerabilities

Whether this is best seen as a temporary increase in risk aversion, a genuine dearth of investment opportunities, evidence of monetary policy ‘pushing on a string’, a portent of secular stagnation, or just unusually long lags in the effects of policy, will probably be debated for some time yet. I don’t pretend to know what that debate may conclude.

In the meantime, we have to think about some of the vulnerabilities that may be associated with the build-up of financial risk-taking. This is one of the responsibilities of the Financial Stability Board, particularly (though not only) through its Standing Committee on Assessment of Vulnerabilities. Two factors stand out at present as potentially combining to heighten fragility at some point. The first arises from the sheer extent and longevity of the search for yield.

As I have noted, compensation in financial instruments for various risks is very skinny indeed. Investors in the long-term debt of most sovereigns in the major countries are receiving very little – if any – compensation for inflation and only minimal compensation for term. Some model-based decompositions of bond yields suggest that term premia on US long-term debt and some sovereign debt in the euro area are actually negative. Compensation for credit risk is also narrow in many debt markets.

Moreover, because the search for yield is a global phenomenon, considerable amounts of capital have flowed across borders. There is some evidence to suggest that as emerging country bond markets have developed, particularly in Asia, more issuers have been able to raise funds in their local currencies. This leaves the foreign exchange risk associated with the capital flows more with the investor rather than a local bank or corporate, which is a good development. Nonetheless, we don’t have full visibility of those risks and there has been a notable build-up of debt overall in some emerging markets.

The other factor of importance is a set of structural changes in capital markets, where there are two key features worth noting. One is the expanding role of asset managers. The search for yield, and the general tendency since the crisis for some intermediation activity to migrate to the non-bank sector, has resulted in large inflows to asset managers since the crisis.

Yet liquidity – the ability to shift significant quantities of assets in a short period without large price movements – has probably declined, which is the second of the structural changes worth noting. Certainly the willingness of banks and others to act as market-makers in the way they did in the past will have diminished considerably. Now, of course, to some extent this is a result of the changes to financial regulation which have aimed to improve the robustness of the financial system. We should be clear that it was intended that the cost of liquidity provision in markets be more fully borne by investors. Liquidity was under-priced prior to the crisis.

Nonetheless, the question is whether end-investors truly appreciate that the availability of liquidity in the system has declined. Good asset managers have sufficient liquidity holdings to meet redemptions that may occur over any short time period and will also offer appropriate redemption terms and so pose only limited risks to the broader financial system. But the cost of holding the most liquid assets in a world of very low returns overall may pressure some asset managers to hold less genuine liquidity than they might otherwise. Meanwhile, the amount of client funds being managed is much larger than it was and we don’t know how all those investors will behave in a more stressed environment, should one eventuate. A key concern the official sector has is that investors may be assuming a degree of liquidity that will not actually be available in a more stressed situation.

Putting all that together, we find a world where the banking system is much safer, but in capital markets some valuations are stretched, credit spreads are compressed, there has been significant cross-border capital flow and liquidity may be less available than investors are assuming. That raises the risk that a sell-off, were it to occur, could be abrupt.

What might trigger such an event?

The usual trigger people have in mind is a rise in US interest rates. The US economy now looks strong enough for the Federal Reserve to consider increasing its policy rate later in the year. In itself, this should be welcomed. And it will have been very well telegraphed. Understandably, the Fed is proceeding with the utmost caution. But it will also have been over nine years since the Fed previously raised interest rates. Some market participants won’t have lived through a Fed tightening cycle before. Hence, it would not be surprising to see some bumps along this road.

A second trigger could come from slower growth in emerging markets. Growth has already weakened in some economies, several of which have been bruised by falling commodity prices. Capital that flowed into emerging markets could flow out again, perhaps when interest rates begin to rise in the United States. That would probably occur alongside an appreciating US dollar. So the distribution of credit risk and foreign currency risk will be of considerable importance. One can easily see why investors could become less forgiving of borrowers on a shaky footing, be they corporates or sovereigns.

A complicating factor here is that the rise in US interest rates looks set to occur while the central banks of Japan and Europe are continuing an aggressive easing of monetary policy via balance sheet measures. The combined Japanese and European ‘QE’ will be very substantial. The extent to which such funds will flow across borders will depend on which sorts of investors are ‘displaced’ from their sovereign debt holdings and what their risk appetites are. To the extent that funds do flow across borders, the proportions in which they flow to emerging markets, as opposed to the United States, will also be important.

So there is a fair bit that we don’t know, but need to learn, about this environment. It will be important for the officials thinking about these and other risks to continue an effective dialogue with private market participants over the period ahead.

Australia

These major global trends have certainly affected financial and economic conditions in Australia. We see the effects of the search for yield all around us. Short and long-term interest rates are at record lows, but are still attractive to some international investors. Foreign capital has been attracted not just to debt instruments but to physical assets. The demand for commercial property has been particularly strong and meant that prices have risen even as rental income has softened and the outlook for construction seems reasonably subdued. That raises some risks, which we discussed in our recent Financial Stability Review.[1]

We also noted the attention being given by APRA (Australian Prudential Regulation Authority) and ASIC (Australian Securities and Investments Commission) to risks in the housing market. APRA has announced benchmarks for a few aspects of banks’ housing lending standards and both APRA and the Reserve Bank will be monitoring the effects of these measures carefully; at this stage, it is still too early to judge them. We can only say that over the past few months, the rate of growth of credit for housing has not picked up further.

Overall, we think the Australian financial system is resilient to a range of potential shocks, be they from home or abroad. Banks’ capital positions are sound and are being strengthened over time. They have little exposure to those economies that are under acute stress at present. Measures of asset quality – admittedly backward-looking ones – have been improving.

But it is developments in the ‘real’ sector of the economy that, right at the minute, seem more in focus. The economy is continuing to adjust to the largest terms of trade episode it has faced in 150 years. As part of that adjustment, there has been a major expansion in the capital stock employed in the resources and energy sector, accomplished by exceptionally high rates of investment. These are now falling back quickly, exerting a major dampening effect on demand. There has been a major cycle in the exchange rate, which is still under way. There has been considerable change to the structure of the economy. This all happened as the major economies encountered the biggest financial crisis in several generations, with its very long-lasting after effects, and which also had an impact on Australian attitudes to spending and leverage. To say there have been some pretty powerful, and disparate, forces at work is something of an understatement, even for a central banker.

At present, while growth in Australia’s group of trading partners is about average, and is higher than the rate of growth for the world economy as a whole, the nature of that growth is shifting. The growth in Chinese demand for iron ore, for example, has weakened at the same time that supply has been greatly increased, much of it from Australia. Iron ore prices are therefore falling and contributing to a fall in Australia’s terms of trade.

As the terms of trade fall, and national income grows more slowly than it would have otherwise, adjustment is occurring in several ways:

  • Incomes of those directly exposed to the resources sector, be it as employees, owners or service providers, are reduced.
  • Nominal wages generally are lower than otherwise.
  • The Australian dollar has declined and will very likely fall further yet, over time. This is one of the main ways that the lower national income is ‘transmitted’ to the population: purchasing power over foreign goods and services is reduced. At the same time, Australians receive some price incentives to substitute towards domestically produced goods and services. And the purchasing power of foreigners over the value added by Australian labour and capital is higher than otherwise.
  • Saving by households, which rose when the terms of trade rose, is tending to decline as the terms of trade fall. This is a natural response to lower income growth and is being reinforced by easier monetary policy, which has reduced the return on safe financial assets. That said, the fact that many households already carry a considerable debt burden means that the extent to which they will be prepared to reduce saving to fund consumption may be less than it once was. More on this in a moment.
  • As part of the same adjustment, government saving is increasing more slowly (more accurately, government dis-saving is lessening more slowly) than otherwise. This is more or less automatic to the extent that lower commodity prices directly reduce state and federal government revenues. More generally, the more reluctant households are to lower their saving and increase their spending the harder the government may find it to increase its saving.

Macroeconomic policy is supporting the adjustment. On the fiscal front, the government has little choice but to accept the slower path of deficit reduction over the near term. But over the longer term, hard thinking still needs to occur about the persistent gap we are likely to see (under current policy settings) between the government’s permanent income via taxes and its permanent spending on the provision of good and services.

In the case of monetary policy, the Reserve Bank has been offering support to demand, consistent with its mandate as expressed by the medium-term inflation target. Relevant considerations of late include the fact that output is below conventional estimates of ‘potential’, aggregate demand still seems on the soft side as resources investment falls sharply, and unemployment is elevated and above most estimates of ‘natural rates’ or ‘NAIRUs’. And inflation is forecast to be consistent with the 2–3 per cent target. So interest rates should be quite accommodative and the question of whether they should be reduced further has to be on the table.

What complicates the situation is that these are not the only pertinent facts. A good deal of the effect of easier monetary policy comes via the housing sector – through higher prices, which increase perceived wealth and encourage higher construction, through higher spending on durables associated with new dwellings, and so on. These are not the only channels but, according to research, together they account for quite a bit of the direct effects of easier monetary policy. And they do appear to be working, thus far. Housing starts will reach high levels this year and wealth effects do appear to be helping consumption, which is rising faster than income.

But household leverage starts from a high level, having risen a great deal in the 1990s and early 2000s. The extent to which further increases in leverage should be encouraged is not easily answered, but nor can it be conveniently side-stepped. Even if we chose to ignore it, monetary policy’s ability to support demand by inducing households to bring forward spending that would otherwise be done in future might well turn out to be weaker than it used to be. For a start, households already did a lot of that in the past and, in any event, future income growth itself looks lower than it did a few years ago.

Then there are dwelling prices, which, at a national level, have already risen considerably from their previous lows, at a time when income growth has been slowing. Popular commentary is, in my opinion, too focused on Sydney prices and pays too little attention to the more disparate trends among the other 80 per cent of Australia. That said, it is hard to escape the conclusion that Sydney prices – up by a third since 2012 – look rather exuberant. Credit conditions are only one of several factors at work here. But credit conditions are very easy. So while the conduct of monetary policy can’t allow these financial considerations to dominate the ‘real economy’ ones completely, nor can it simply ignore them. A balance has to be found.

To this point, the balance that the Reserve Bank Board has struck has seen the policy rate held at what would once have been seen as extraordinarily low levels for quite a while now. The Board has, moreover, clearly signalled a willingness to lower it even further, should that be helpful in securing sustainable economic growth. The Board has been proceeding with a degree of caution that is appropriate in the circumstances. It also has, I would say, a realistic assessment of how much monetary policy can be expected to achieve in supporting the adjustment the economy needs to make.

Any help in boosting sustainable growth from other policies would, of course, be welcome. In particular, things that could credibly be seen as lifting prospects for future income, and increasing confidence in those prospects, would give easy monetary policy a good deal more traction.

In fact, that point generalises to the rest of the world. Across much of the world, too much weight is being put on monetary policy to try to achieve what it can’t: a durable and sustainable increase in growth, in an environment where private leverage is already rather high or even too high. Monetary policy alone won’t deliver that.

This is probably a moment to recall the commitments we all made in the G20 meetings in Australia last year, as we agreed on the goal of an additional rise in global GDP of 2 per cent over five years.

Those commitments were not actually about monetary policy; they were about other policies. It will be important this year, after one of the five years has passed, to see whether we are all making good on our various promises. More generally, actions which promote entrepreneurship, innovation, adaptation and skill-building, that reward ‘real’ risk-taking, while providing a stable macroeconomic environment and a well-functioning financial system, will best support our future wellbeing.

What Does The Fed’s Bank Stress Tests Tell Us?

Last month the results from the latest Dodd-Frank Act Stress Tests were released. Unlike the APRA tests the outcomes of which (other than high-level general comments), are totally secret; the results for individual banks are disclosed, allowing comparisons to be made. In addition, there is real focus on capital ratios, which in Australia according to the Murray report should be lifted here, because currently our banks are supported by an implicit government guarantee.  Looking at the US regime provides insights into how banking supervision works.

By way of background, in the wake of the recent financial crisis, under the DoddFrank Act, the US Federal Reserve is required to conduct an annual stress test of banks with total consolidated assets of $50 billion or more as well as designated nonbank financial companies. The tests are designed to see if these banks have appropriate capital adequacy processes and capital to absorb losses during stressful conditions, whilst meeting obligations to creditors and counterparties and continuing to serve as credit intermediaries.

There are two elements to the tests, first examining a banks capital adequacy, capital adequacy process, and planned capital distributions, such as dividend payments and common stock repurchases – Comprehensive Capital Analysis and Review (CCAR), and second a forward-looking quantitative evaluation of the impact of stressful economic and financial market conditions – Dodd-Frank Act Stress Test (DFAST). The scenarios are not disclosed prior to testing, so to an extent, the banks are not able to dress up their results.

This is the fifth round of stress tests led by the Federal Reserve since 2009 and the third round required by the Dodd-Frank Act. The 31 firms tested represent more than 80 percent of domestic banking assets. The Federal Reserve uses its own independent projections of losses and incomes for each firm.

Moreover, the banks have to pass the tests in order to pay out rewards to its investors, so it is much more than a mathematical academic exercise. The Fed is more and more focussing on the culture of the organisations and some banks failed the qualitative assessment. As the testing has evolved, this activity has become more are more part of normal supervisory activities, rather than a once a year proof.

Overall, the Fed’s judgment is that American banks carry enough cash and have strong enough internal risk management systems to weather a severe economic downturn. 28 of 31 financial institutions tested had adequately balanced capital and risk in hypothetical downturn, allowing them to return cash to shareholders as planned.

We look at the work in more detail.

The Scenario Modelling, (DFAST).

The Federal Reserve’s projections of revenue, expenses, and various types of losses and provisions that flow into pre-tax net income are based on data provided by the 31 banks participating in the test and on models developed or selected by Federal Reserve staff and reviewed by an independent group of Federal Reserve economists and analysts. The models are intended to capture how the balance sheet, RWAs, and net income of each BHC are affected by the macroeconomic and financial conditions described in the supervisory scenarios, given the characteristics of the banks loans and securities portfolios; trading, private equity, and counterparty exposures from derivatives; business activities; and other relevant factors.

The adverse and severely adverse supervisory scenarios used this year feature U.S. and global recessions. In particular, the severely adverse scenario is characterized by a substantial global weakening in economic activity, including a severe recession in the United States, large reductions in asset prices, significant widening of corporate bond spreads, and a sharp increase in equity market volatility. The adverse scenario is characterized by a global weakening in economic activity and an increase in U.S. inflationary pressures that, overall, result in a rapid increase in both short- and long-term U.S. Treasury rates.

The Severely Adverse Scenario

The severely adverse scenario for the United States is characterized by a deep and prolonged recession in which the unemployment rate increases by 4 percentage points from its level in the third quarter of 2014, peaking at 10 percent in the middle of 2016. By the end of 2015, the level of real GDP is approximately 4.5 percent lower than its level in the third quarter of 2014; it begins to recover thereafter. Despite this decline in real activity, higher oil prices cause the annualized rate of change in the Consumer Price Index (CPI) to reach 4.3 percent in the near term, before subsequently falling back. In response to this economic contraction—and despite the higher near-term path of CPI inflation, short-term interest rates remain near zero through 2017; long-term Treasury yields drop to 1 percent in the fourth quarter of 2014 and then edge up slowly over the remainder of the scenario period.  Consistent with these developments, asset prices contract sharply in the scenario. Driven by an assumed decline in U.S. corporate credit quality, spreads on investment-grade corporate bonds jump from about 170 basis points to 500 basis points at their peak.

Equity prices fall approximately 60 percent from the third quarter of 2014 through the fourth quarter of 2015, and equity market volatility increases sharply. House prices decline approximately 25 percent during the scenario period relative to their level in the third quarter of 2014.

The international component of the severely adverse scenario features severe recessions in the euro area, the United Kingdom, and Japan, and below-trend growth in developing Asia. For economies that are heavily dependent on imported oil—including developing Asia, Japan, and the euro area—this economic weakness is exacerbated by the rise in oil prices featured in this scenario. Reflecting flight-to-safety capital flows associated with the scenario’s global recession, the U.S. dollar is assumed to appreciate strongly against the euro and the currencies of developing Asia and to appreciate more modestly against the pound sterling. The dollar is assumed to depreciate modestly against the yen, also reflecting flight-tosafety capital flows.

In this severely adverse scenario, Over the nine quarters of the planning horizon, losses at the 31 BHCs under the severely adverse scenario are projected to be $490 billion.

LossesByLoanTypeDoddThis includes losses across loan portfolios, losses from credit impairment on securities held in the BHCs’ investment portfolios, trading and counterparty credit losses from a global market shock, and other losses.  SevereLossesDoddProjected net revenue before provisions for loan and lease losses (pre-provision net revenue, or PPNR) is $310 billion, and net income before taxes is projected to be –$222 billion.  There are significant differences across banks in the projected loan loss rates for similar types of loans. For example, while the median projected loss rate on domestic first-lien residential mortgages is 3.5 percent, the rates among banks with first-lien mortgage portfolios vary from a low of 0.9 percent to a high of 12.5 percent. Similarly, for commercial and industrial loans, the range of projected loss rates is from 3.0 percent to 14.0 percent, with a median of 4.8 percent. Differences in projected loss rates across BHCs primarily reflect differences in loan and borrower characteristics.

The aggregate tier 1 common capital ratio would fall from an actual 11.9 percent in the third quarter of 2014 to a post-stress level of 8.4 percent in the fourth quarter of 2016.

CapitalRatiosDoddThe Adverse Scenario

In the adverse scenario, the United States experiences a mild recession that begins in the fourth quarter of 2014 and lasts through the second quarter of 2015. During this period, the level of real GDP falls approximately 0.5 percent relative to its level in the third quarter of 2014, and the unemployment rate increases to just over 7 percent. At the same time, the U.S. economy experiences a considerable rise in core inflation that results in a headline CPI inflation rate of 4 percent by the third quarter of 2015; headline inflation remains elevated thereafter. Short-term interest rates rise quickly as a result, reaching a little over 2.5 percent by the end of 2015 and 5.3 percent by the end of 2017. Longer-term Treasury yields increase by less. The recovery that begins in the second half of 2015 is quite sluggish, and the unemployment rate continues to increase, reaching 8 percent in the fourth quarter of 2016, and flattens thereafter. Equity prices fall both during and after the recession and by the end of the scenario are about 25 percent lower than in the third quarter of 2014. House prices and commercial real estate prices decline by approximately 13 and 16 percent, respectively, relative to their level in the third quarter of 2014.

In the adverse scenario, projected losses, PPNR, and net income before taxes are $314 billion, $501 billion, and $178 billion, respectively. The accrual loan portfolio is the largest source of losses in the adverse scenario, accounting for $235 billion of projected losses for the 31 BHCs. The lower peak unemployment rate and more moderate residential and commercial real estate price declines in the adverse scenario result in lower projected accrual loan losses on consumer and real estate-related loans. The ninequarter loan loss rate of 4.1 percent is below the peak industry-level rate reached during the recent financial crisis but still higher than the rate during any other period since the Great Depression of the 1930s. As in the severely adverse scenario results, there is considerable diversity across firms in projected loan loss rates, both in the aggregate and by loan type. The aggregate tier 1 common capital ratio under the adverse scenario would fall 110 basis points to its minimum over the planning horizon of 10.8 percent before rising to 11.7 percent in the fourth quarter of 2016.

Standing back, a few observations are worth thinking about, courtesy of the The Harvard Law School Forum on Corporate Governance and Financial Regulation.

1. More post-stress capital exists today than did pre-stress capital during the financial crisis: The 31 banks’ post-stress Tier 1 Common ratio (T1C) average 8.2% under the severely adverse scenario, which is higher than the same banks’ pre-stress T1C average of 5.5% at the beginning of 2009. Average pre-stress T1C is also up again this year from last year (11.9% versus 11.5%) as is post-stress T1C (8.2% versus 7.6%).

2. Industry capital ratios improve faster overall than at the largest banks: The six largest banks accounted for about half of the total increase in industry Tier 1 common equity. However, these institutions make up 70% of industry-wide RWA, demonstrating that the other 25 banks are disproportionately accounting for the increase in industry-wide capital.

3. Leverage ratio appears binding for many of the largest banks: The leverage ratio is the binding constraint for many large banks as they remain close to the 4% minimum. The leverage ratio is particularly punitive for banks with significant capital markets activities. However, as the proposed G-SIB capital surcharge comes into play, these banks will further increase their common equity, lessening the impact of the leverage ratio in the future.

4. Fed models seem to be maturing and becoming more predictable: For the first time, the Fed disclosed the degree to which its stress models have changed, indicating that there were only incremental changes to most models. This model stability (and the fact that the Fed’s economic scenarios have been held fairly constant over time) should allow banks to better anticipate the Fed’s projected capital losses in the future. Banks can integrate this information into their future capital distribution plans in order to maximize their distributions to shareholder without having to raise regulatory flags by taking the mulligan.

5. Loan loss rates improve due to fewer legacy problem portfolios and improved underwriting standards: Total loan loss rates continued their march downward, reaching 6.1% under the severely adverse scenario (down from 6.9% in 2014 and 7.5% in 2013). This decline is driven by improvements in first lien loans, junior liens, and credit cards, as legacy problem portfolios are being removed from balance sheets and improved underwriting standards are taking hold (as alluded to above, Fed models and scenarios in these areas have remained stable). First lien and junior lien loss rate declines are particularly impactful, with decreases of 2.1 and 1.6 percentage points respectively. Commercial and industrial loan loss rates remained stable from last year, but were generally higher for banks with significant leveraged lending businesses (which the Fed has been expressing concern about in recent years).

6. Banks overall are positioned well under the adverse scenario’s rising interest rate environment: Firms have generally prepared for the prospect of rising rates, as reflected in the adverse scenario results that show 27 of the 31 firms posting a pre-tax profit over the nine quarters. The average T1C falls only 110 bps from start to minimum, and 80 bps of that erosion is recouped by the end of the nine quarters through an increase in PPNR for these banks, largely due to asset-sensitive balance sheets more than offsetting unrealized AFS losses over time.

7. Minimum capital ratios look worse than reality: A few banks that heavily trade in the capital markets have post-stress minimum capital ratios close to the 8% requirement. However, we do not believe these banks will be as constrained in their capital distributions as it may appear. The trough in their ratios comes very early in the nine-quarter stress horizon, due to the market shock component which disproportionately impacts these firms, but rises in subsequent quarters.

8. DFAST (and CCAR) will likely be tougher in the future: The Fed indicated late last year that it may add all or a portion of the proposed G-SIB capital surcharge to post-stress capital ratios. Although we would not expect a proposed rule in this regard until at earliest the second half of this year, it is possible that such a rule could be finalized in time for DFAST 2016 given that stress testing deadlines will occur three months later. Timing aside, in our view the G-SIB capital surcharge will ultimately factor into stress testing. At a minimum for 2016, Fed expectations will be higher as a result of the extra three months for banks to prepare.

The Comprehensive Capital Analysis and Review (CCAR)

In November 2011, the Federal Reserve issued the capital plan rule and began requiring Bank Holding Companies (BHCs) with consolidated assets of $50 billion or more to submit annual capital plans to the Federal Reserve for review. For the CCAR 2015 exercise, the Federal Reserve issued instructions on October 17, 2014, and received capital plans from 31 BHCs on January 5, 2015. The capital plan rule specifies four mandatory elements of a capital plan:

  1. an assessment of the expected uses and sources of capital over the planning horizon that reflects the BHC’s size, complexity, risk profile, and scope of operations, assuming both expected and stressful conditions, including estimates of projected revenues, losses,reserves, and pro forma capital levels and capital ratios (including the minimum regulatory capital ratios and the tier 1 common ratio) over the planning horizon under baseline conditions, supervisory stress scenarios,and at least one stress scenario developed by the BHC appropriate to its business model and portfolios;. a discussion of how the company will maintain all minimum regulatory capital ratios and a pro forma tier 1 common ratio above 5 percent under expected conditions and the stressed scenarios; a discussion of the results of the stress tests required by law or regulation, and an explanation of how the capital plan takes these results into account; and a description of all planned capital actions over the planning horizon;
  2. a detailed description of the BHC’s process for assessing capital adequacy;
  3. the BHC’s capital policy; and
  4. a discussion of any baseline changes to the BHC’s business plan that are likely to have a material impact on the BHC’s capital adequacyor liquidity.

When the Federal Reserve objects to a BHC’s capital plan, the BHC may not make any capital distribution unless the Federal Reserve indicates in writing that it does not object to the distribution.

CCAR differs from DFAST by incorporating the 31 participating bank holding companies’ (“BHC” or “bank”) proposed capital actions and the Fed’s qualitative assessment of BHCs’ capital planning processes. When the CCAR was subsequently released, some banks came close to failing the tests. The Fed objected to two foreign BHCs’ capital plans and one US BHC received a “conditional non-objection,” all due to qualitative issues. Bank of America received the only sanction among U.S. firms and the bank is to resubmit its capital plan due to weaknesses in its modeling practices and internal controls. Bank of America’s conditional failure means it will have to shelve plans to increase dividends and issue stock buybacks until the Fed reviews its updated submission in six months. Santander and Deutsche Bank will also have to put investor payouts on hold. It was widely expected that the two banks would trip up on the stress tests, which have proven difficult for foreign-based banks. Santander failed its first test last year, while this was Deutsche Bank’s first attempt.

Looking at the CCAR, here are some further key points:

1. Capital planning process enhancements pay off: The fact that only two plans were rejected indicates that BHCs’ investments in quality processes have been worthwhile, most recently at Citi. Banks now have more room to make the CCAR exercise more sustainable by reducing costs and integrating with financial planning for better strategic decision making.

2. No amount of capital can make up for deficient processes: In objecting to the capital plans, the Fed cited foundational risk management issues such as risk identification and modeling quality. The press leak of this year’s rejections could have been an intentional effort to avoid an overreaction to last week’s positive quantitative-only DFAST results (avoiding confusion from prior years).

3. Return of the “conditional non-objection”: The Fed reintroduced the conditional non-objection in CCAR 2015 for one US BHC, Bank of America, after a one-year hiatus. Under this qualified pass, the Fed is requiring the bank to fix issues related to its loss and revenue modeling and internal controls, and to resubmit its capital plan by the end of the third quarter of 2015. Although matters requiring immediate attention (“MRIAs”) generally must be remediated within one CCAR cycle, conditional passes seem to operate as super-MRIAs by giving the Fed teeth to require remediation within six months (which may be particularly important this year, given the three month extended CCAR cycle for 2016). However, BHCs receiving this pass have ultimately been able to follow through on their proposed capital distributions, so the return of the conditional pass may be more of a broad message from the Fed: even though all US BHCs passed this year, their CCAR processes must continue to improve.

4. Large banks see little downside to taking the mulligan, so are being more aggressive with planned capital actions: Three of the largest US BHCs exercised the option to adjust their planned capital distributions downward, after receiving last week’s DFAST results indicating their initial plans distributed too much capital. The use of this “mulligan” continues to be limited to the largest institutions with the most sophisticated capital planning processes, and is increasingly being taken as they attempt to pay out more to shareholders. However, the Fed may look unfavorably on this development if viewed as a sign of weak capital planning capabilities (and may rethink stress testing guidelines in the future).

5. Fed and BHC loan loss modeling differences are converging, but the gap remains wide: Continuing the previous two years’ trend, the gap between Fed and BHC loan loss rate projections has again shrank this year—by about 30% across loan-types driven mostly by residential loan loss projections. This convergence will likely help management better align its proposed capital actions with the Fed’s views and more precisely assess the risk of taking the mulligan. However, the gap remains wide, at over 140 basis points across loan categories, including about 440 basis points for CRE loans. While the Fed’s projected loan loss rates have been declining rapidly under the severely adverse scenario (reaching a 6.1% average this year, down from 6.9% in 2014 and 7.5% in 2013), BHCs’ projections have been declining more slowly.

6. Fed asset growth projections continue to exert downward pressure on stressed Tier 1 common ratios: CCAR 2014 marked the first time that the Fed projected banks’ growth in risk-weighted assets, which significantly reduced stressed Tier 1 common ratios. This year Fed projections again exceed BHC projections, this time by about 10% under Basel I (versus about 12% last year) under the severely adverse scenario. As a result, banks’ stressed Tier 1 common ratios are about 90 basis points lower on average than they would have been under the Fed’s 2013 approach.

7. Caution signs line the road ahead for new CCAR entrants: As part of last year’s CCAR, the Fed noted that the 12 then-new CCAR entrants would not be held to the same high standards applicable to the largest BHCs. This year, in contrast, the Fed made clear that this grading curve does not apply to new entrants that are supervised by the Fed’s Large Institution Supervision Coordinating Committee (“LISCC”). Therefore, large intermediate holding companies and certain nonbanks deemed systemically important should take notice that the Fed’s heightened standard for LISCC firms will likely apply to them when they enter CCAR down the road.

8. Proving comprehensive risk identification will be one of the biggest challenges for CCAR 2016: A new expectation for 2015 required banks to prove (rather than simply describe) the comprehensiveness of their risk identification process and its linkage to capital planning and scenario generation. Given the experienced challenges in doing so this year, expect this area to be an important Fed focus for CCAR 2016.

9. Binding constraints on capital will evolve: The Tier 1 leverage ratio continues to be a binding constraint, especially among the BHCs with the largest capital markets businesses. However, as the proposed G-SIB capital surcharge is implemented, these banks will further increase their common equity which will lessen the impact of the leverage ratio. The binding constraint will remain a moving target as banks seek to optimize their capital holdings given the phase-in of the G-SIB capital surcharge (along with expected short-term funding capital penalties and long-term debt requirements) and the upcoming implementation of the supplementary leverage ratio (“SLR”).

10. CCAR is bigger than stress testing: The Fed explicitly stated this year that outstanding supervisory issues, beyond capital planning, may result in a qualitative objection to a BHC’s capital plan. This statement clarifies that matters outside of capital planning, such as regulatory reporting (beyond the FR Y-14 and FR Y-9C series), enterprise risk management, and governance may lead to the Fed halting additional capital distributions to shareholders.

A Quick Look At Individual Banks

The individual bank data is interesting.  You can read the details in the reports via the links above. However, here is the list of players assessed, sorted by the minimum tier 1 common ratio under the severely adverse scenario, which the WSJ reproduced from the report. Note the 5% hurdle rate which is becoming a critical lens to assess the true position of the banks, rather than the complexity of internal models.

DoddGoing Forward

The Federal Reserve evaluates planned capital actions for the full nine-quarter planning horizon to better understand each BHC’s longer-term capital management strategy and to assess post-stress capital levels over the full planning horizon.  While the nine-quarter planning horizon reflected in the 2015 capital plans extends through the end of 2016, the Federal Reserve’s decision to object or not object to BHCs’ planned capital actions is carried out annually and typically applies only to the four quarters following the disclosure of results. However, starting in 2016, the stress testing and capital planning schedules will begin in January of a given year, rather than October, resulting in a transition quarter before the next CCAR exercise. As a result, the Federal Reserve’s decisions with regard to planned capital distributions in CCAR 2015 will span five quarters and apply from the beginning of the second quarter of 2015 through the end of the second quarter of 2016.

It seems to me that Australia really needs to step up its focus on capital regulation, and simply waiting for the next Basel dictates will not cut the mustard. I think we need a massive lift in disclosure here, and the Dodd-Frank model points a potential path.

NSW Booming, Thanks To Housing – CommSec

In CommSec’s latest State of the States report, NSW has retained its top ranking on population growth and retail trade and is also now number one on dwelling starts. It is second placed on business investment, and housing finance. NSW is fourth on overall construction work, unemployment and fifth on economic growth.

CommSecApr2015

Each quarter CommSec attempts to find out by analysing eight key indicators: economic growth; retail spending; equipment investment;  unemployment; construction work done; population growth; housing finance and dwelling commencements. Just as the Reserve Bank uses long-term averages to determine the level of ‘normal’ interest rates; we have done the same with key economic indicators. For each state and territory, latest readings for the key indicators were compared with decade averages – that is, against the ‘normal’ performance.

Last quarter NSW shared the top spot of Australia’s economic performance rankings alongside the Northern Territory. However this time around NSW has edged ahead to take sole ownership of the top ranking. In second place is the Northern Territory. The next grouping is Western Australia and Victoria. Queensland holds on to fifth spot. The ACT and South Australia are closely grouped in sixth and seventh respectively. Tasmania is ranked eighth. Over the past quarter, NSW has improved its position on housing finance and dwelling starts to consolidate its position at the top of the economic performance rankings.


High Super Fees Erode Returns By 5% – Grattan Institute

The latest report from the Grattan Institute – an independent think tank dedicated to developing high quality public policy for Australia’s future – is on superannuation. It reconfirms fees are too high, savers are getting lower returns than they should, and further reforms are needed urgently. We concur. You can read DFA analysis on super here.  As the balances on super accounts grow ever bigger, the imperative for significant reform builds.

Grattan Institute’s 2014 report, Super Sting, found that Australians are paying far too much for superannuation. We pay about $21 billion a year in fees. That report proposed that government reduce fees by running a tender to select funds to operate the default accounts used by most working Australians.

The Murray Financial System Inquiry came to similar conclusions to those in Super Sting. Its 2014 report finds there is not strong competition based on fees in the superannuation sector. It recommends a “competitive mechanism”, or tender, to select default products, unless a review held by 2020 shows the sector has become much more efficient.

This report analyses superannuation fees and costs in depth. It shows that there are excess costs in both administration and investment management. It evaluates recent policy initiatives to lower fees and recommends further reforms. Our new analysis confirms the conclusions of our previous report. In both default and choice funds, administration fees are too high, and take a toll on net returns. There is little evidence that funds that charge higher fees provide better member services. There are too many accounts, too many funds, and too many of them incur high administrative costs. We pay $4 billion a year above what would be charged by lean funds. Investment fees are also too high. Many funds do not deliver returns that justify their fees. Cutting fees to what high-performing, lean funds charge could save more than $2 billion a year. In sum, superannuation could be run for much less than the $16 billion currently charged by large funds (self-managed super costs another $5 billion).

The superannuation industry argues that its $21 billion costs are not excessive, and will fall over time. It opposes a tender for default accounts based on fees, claiming that it would reduce investment quality and net returns. But current initiatives to reduce costs are not enough. The Stronger Super reforms to reduce administration costs and make default products transparent will cut total default fees by about $1 billion. The Future of Financial Advice reforms could yield benefits for choice account holders. But even if regulators pursue these initiatives with zeal, they will leave billions on the table. If remaining excess costs are not removed, they will drain well over 5 per cent – or $40,000 – out of the average default account holder’s fund by retirement. Excess costs in choice superannuation are even larger.

Government must act to close accounts, merge funds and run a tender to select default products. The tender would save account holders a further $1 billion a year, and create a benchmark to force other funds to lift their game. A high performing superannuation system will take the pressure off taxpayers and give Australians greater confidence in their retirement.