Latest DFA Survey – Investor Motivations

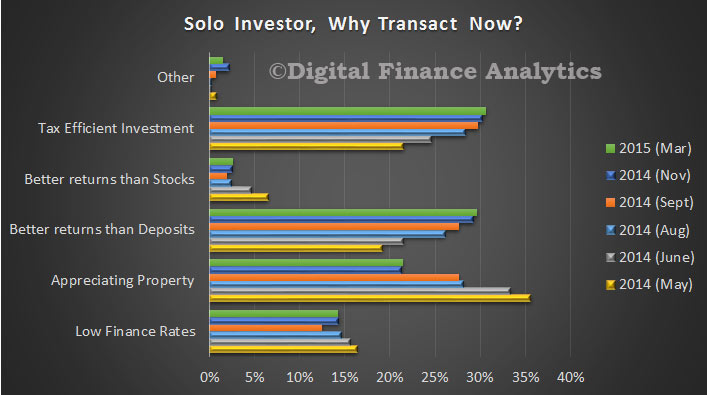
Continuing our series of updates from our latest household surveys, today we look at the latest investment property trends. Looking at solo investors first (using the DFA segmentation) we see the main drivers to transact relate to the continued potential for appreciating property values and the tax efficient nature of the investment. We also see an expectation of higher returns than deposits. This all explains why property investment is so hot. It is, from an investment perspective, for many, the best game in town. The average age for a first time property investor continues to fall, and now stands at 38 years, partly reflecting the rise of first time buyer investors, as we featured recently.
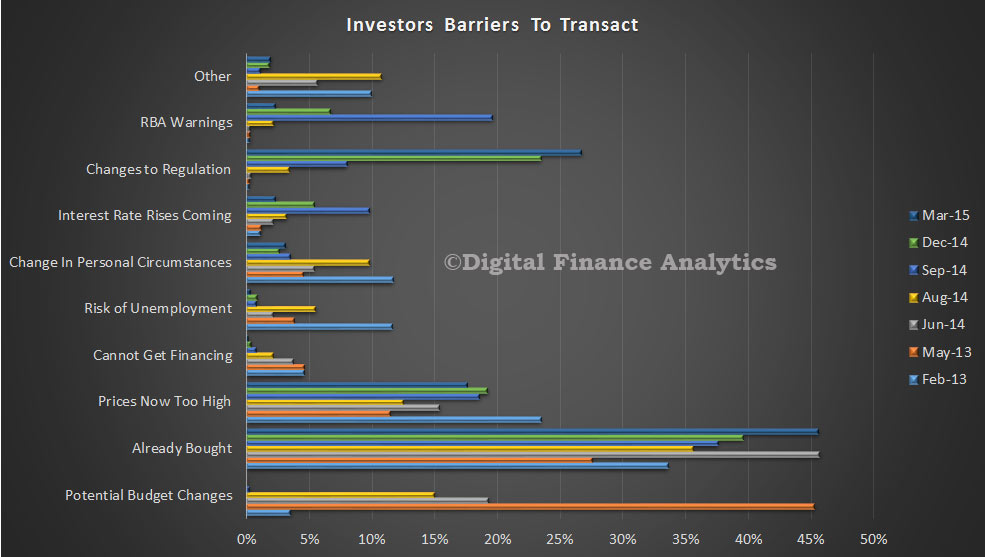
SoloInvMar2015Turning to potential barriers which may stop investors transacting, current prices are not seen as a critical issue – only 18% said this was a turn-off. Whilst 45% had already transacted, there is still significant potential for further purchases, especially in the Sydney and Melbourne markets. We also see that whilst there is some recognition of potential changes to regulation (relating to LVR hurdles, interest only, and gearing), less than one third of investors are worried by this. Finally, only 15% were worrying about potential budget changes, we saw a spike after the budget last year, we may see the same again in our post budget survey.  Nearly half expect to select an interest only loan.
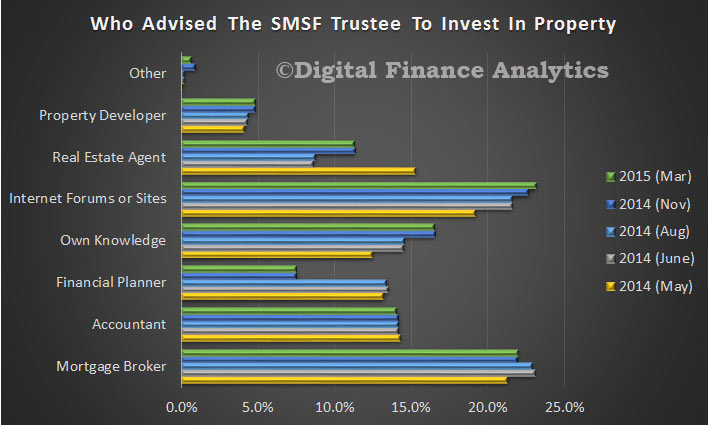
InvBarriersMar2015Investing via a super fund is still a minority sport, though some investors are getting advice from internet forums, or mortgage brokers. We estimate about 3.5% of SMSF have an investment property in their fund, and a further 3% are actively considering this investment route.
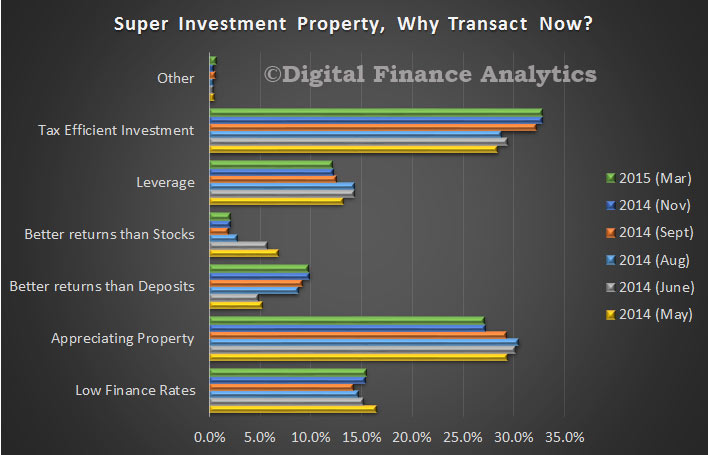
SMSFAdvisorsMar2015Those who are thinking of a SMSF transaction continue to be attracted by tax efficient outcomes and appreciating property values. These drivers match the broader investment sector quite well as we showed above.
SuperInvMar2015Finally we look at portfolio investors. This is becoming an ever more important sector, because the capital gains and imcone from current properties are being used to leverage further investment, to crease a self-sustaining (some would say critical mass) proposition. The proportion with a holding of 10 properties or more is steadily increasing. Again, these investors are driven by tax efficiency and appreciating property values and also an expectation of better returns than deposits.  One trend we detected in this segment is the rise in the number of portfolio investors who now see property investment as their main source of income, it has essentially become their job.

PortfolioInvMar2015 Next time we will look at some of our other segment findings.

NZ Loan To Income Ratios Higher

The Reserve Bank of NZ released a report today “Vulnerability of new mortgage borrowers prior to the introduction of the LVR speed limit: Insights from the Household Economic Survey.” The paper uses household level data for New Zealand to assess the vulnerability of new mortgage loans to owner-occupiers between 2005 and 2013.

They modelled financial vulnerability, considering:

  • Does the household have adequate cash flow to support mortgage borrowing?
  • How large is the equity buffer of the household?

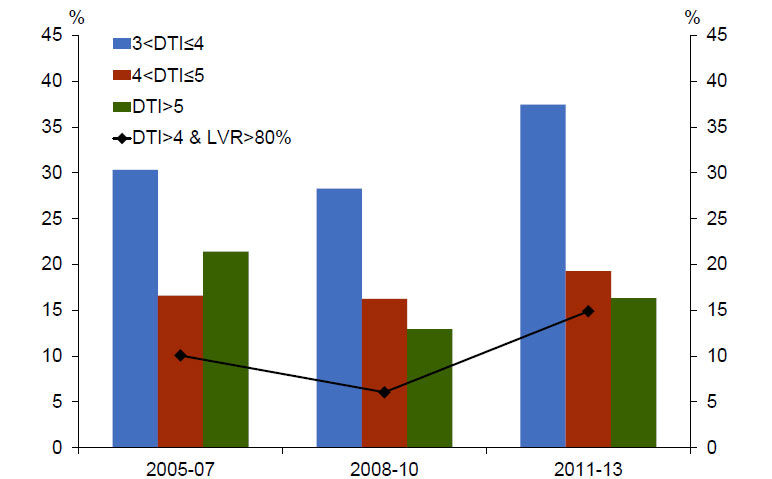
Their analysis suggests a move towards more stretched debt-to-income ratios between the 2008-10 and 2011-13 cohorts.

RBNZ-LTIThey highlighted that most banks will lend at much higher DTIs to high income borrowers than low income borrowers. Owner occupiers with an income of greater than $80,000 do account for almost half of high DTI lending in the 2011-13 cohort. However, this is significantly lower than their share of total lending of around 70 percent. By number, such households account for only 30 percent of owner occupiers with a high DTI.19 Subject to the caveat that our sample of high DTI borrowers is relatively small, this suggests that owner-occupiers with a high DTI are more likely to have an income below $80,000 than those with a low DTI (despite banks’ preference to supply high DTI loans to high income households).

They found an increase in typical DTI multiples compared to earlier years, in addition to the well-known rise in the share of high-LVR lending. The proportion of borrowers with both a high-DTI and a high-LVR also increased sharply and was higher than prior to the GFC. These results are consistent with an increase in the vulnerability within the 2011-13 cohort, although the quantum of lending undertaken and the tail of very high DTI borrowers both remained smaller than prior to the GFC.

Note that an assessment of the vulnerability of other borrower types – including investors and owner occupiers that have not recently bought – is left for future work.

Mortgage Delinquencies Up In Q4

Fitch says that competitive lending, high house prices and low interest rates did not benefit residential mortgage performance in 4Q14, with the delinquencies in the Dinkum RMBS index increasing by 7bp to 1.15%. However, overall performance was better than a year earlier when the 30+ days delinquency ratio was 1.21%.

Fitch believes that in the current low-interest rate environment, rising unemployment will be a key driver of mortgage performance in 2015, as indicated by the 90+ days arrears increase by 3bp to 0.50% despite the strong housing market.

Self-employed and non-conforming borrowers continue to benefit from the strong Australian economy, appreciating housing market and competitive lending environment. Low-documentation (low-doc) loans are usually provided to self-employed borrowers and tend to experience four to five times the level of full-documentation (full-doc) loan delinquencies. The low-doc Dinkum Index worsened by 14bp down to 4.91%, which is better in relative terms compared to the 7bp decrease among full-doc loans.

Non-conforming loans, which are usually provided to borrowers that have an adverse credit history or do not conform to Lenders Mortgage Insurer’s (LMI) standards, continue to show strong resilience with 30+ days arrears improving to 6.70% in December 2014, down from 6.85% in September 2014. Repayment rates in the non-conforming segment have increased to pre-2008 levels, driven by refinancing in the currently competitive lending environment.

Australian house prices gained 7.9% year-on-year at December 2014. This was predominantly driven by increases in Sydney and Melbourne’s property prices. High property prices have benefited LMI claims as it reduced the likelihood of a principal shortfall on defaulted loans. In 4Q14, the Dinkum LMI payment ratio was 95.2%, compared to 93.6% in 3Q14, with an average 4Q14 LMI claim of AUD71,498, below the average cumulative LMI claim of AUD73,097.

A stable Australian economy, low interest rates, and appreciating housing market have assisted mortgage performance. Fitch expects the current rate of property price growth to be unsustainable in the long term, unless household income increases. The agency believes unemployment rate and house prices are key drivers of 90+ days arrears in the current low interest rate environment. The agency expects that the seasonal Christmas spending will be offset by the February 2015 interest-rate cut and the temporary reduction in petrol prices, in turn resulting in stable 1Q15 arrears.


Latest DFA Survey – House Prices Expected To Rise [Still]

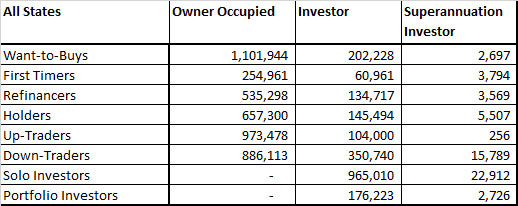
Today we continue our analysis of the DFA household survey data to March 2015 by looking at the cross segment comparative data. We use the DFA segment definitions and have updated our models to take account of changes in population, and property purchase type. The proportion of households who are excluded from property rose again, and the investment sector continues to grow strongly. The current distribution of households by segment are shown below.

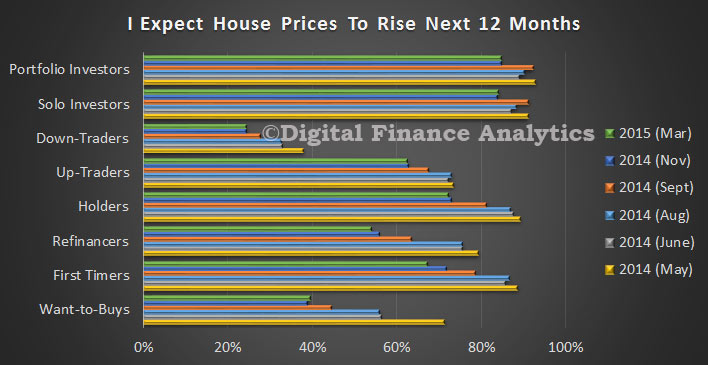
HouseholdsMar2015There is still significant expectation that house prices will continue to rise in the next 12 months, despite the recent gains, though Sydney centric households are most bullish. Investors have high expectations, and as we will see when we drill into this segment, capital gains are top of mind. Down traders are relatively less confident of prices continuing to rise, which explains why this segment still wants to sell now, to crystalise recent gains.

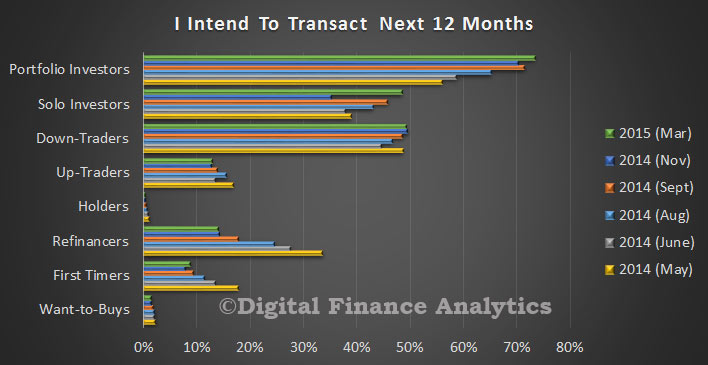
PricesRiseMar2015Looking at plans over the next 12 months, more investors are piling in, so we would expect to see this translate into further momentum in the investment sector. Last month more than half of loans were for investment purposes.

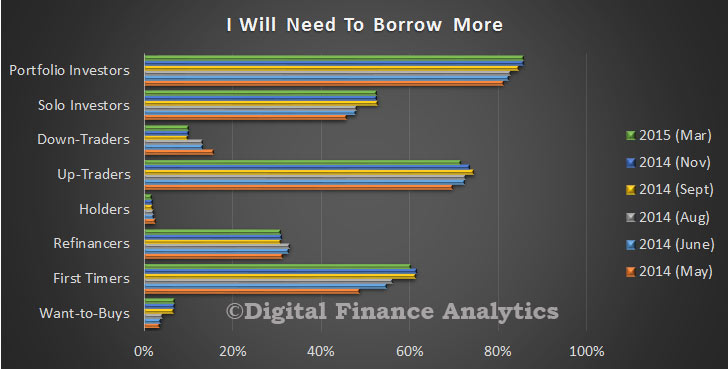
TransactMar2015In terms of borrowing plans, investors, up-traders and first time buyers are the most likely to borrow. Those down traders who are thinking of grabbing an investment property are quite likely to gear, to take advantage of tax breaks.

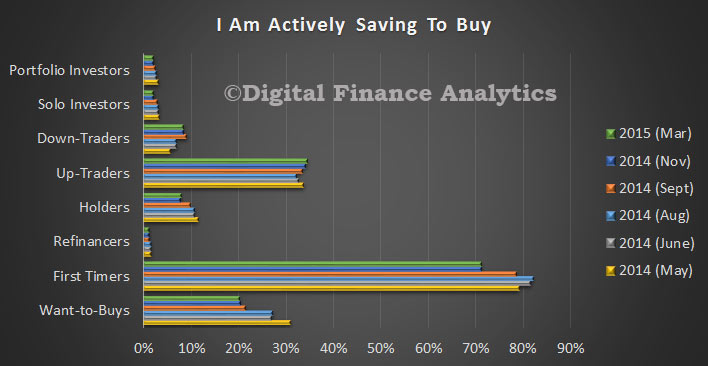
BorrowMore-Mar2015We see that up-traders, first time buyers and want to buys are most likely to be saving to buy, although the lower returns on deposits are proving to be a real problem for many.

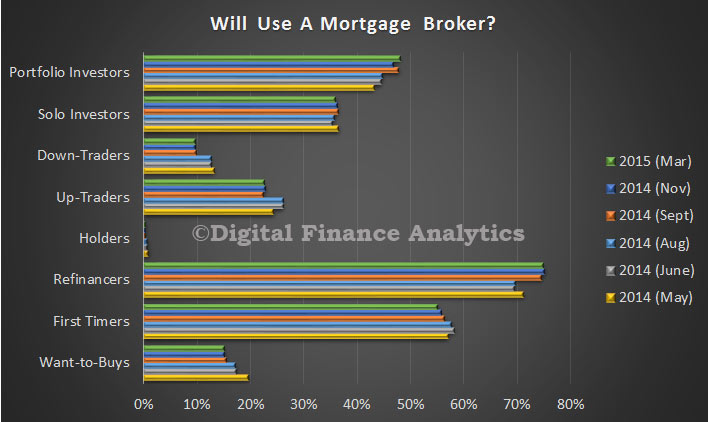
Buy-Mar2015Finally, segments have different propensities to use a mortgage broker. Whilst refinancers, and first time buyers are most likely to use a broker, we also see a continued rise in the number of portfolio investors using a broker. However we see in the survey data a high level of dissatisfaction from this segment with the quality and range of advice from brokers as their needs are more complex, and many brokers tend to focus on simple binary transactions. We think there is an opportunity for brokers to better tailor their services to portfolio (a.k.a. more sophisticated) customers.

BrokerMar2015Next time we will look at the segment specific data drawn from the surveys.

RBA Leaves Door Open For More Rate Cuts

The RBA released their Minutes of the Monetary Policy Meeting of the Reserve Bank Board from 3 March 2015. Clearly housing is the potential brake on further cuts, but that said further falls are possible.

In assessing the appropriate stance for monetary policy in Australia, members noted that the outlook for global economic growth had not changed, with Australia’s major trading partners forecast to grow by around the average of recent years in 2015. Lower oil prices were expected to boost growth in major trading partners and reduce inflation temporarily. More generally, although the decline in many commodity prices over the past year had largely been in response to expansions in global supply, members observed that demand-side factors, including the weakness in Chinese property markets, had also played a role. Although the Australian dollar had depreciated, particularly against the US dollar, it remained above most estimates of its fundamental value, particularly given the significant declines in key commodity prices. Conditions in global financial markets remained very accommodative. Changes to the stance of monetary policy by the major central banks were likely to be important influences on financial markets over the coming year.

Data available at the time of the meeting suggested that the Australian economy had continued to grow at a below-trend pace in the December quarter and that domestic demand growth had remained weak overall. There had been some evidence suggesting that growth of dwelling investment and consumption had picked up in the December quarter, but there had also been indications that business investment could remain subdued for longer than had been previously expected. On balance, the evidence suggested that labour market conditions were likely to remain subdued and the economy would continue to operate with a degree of spare capacity for some time. As a result, wage pressures were expected to remain contained and inflation was forecast to remain consistent with the target over the next year or so, even with a lower exchange rate.

At the same time, activity in the housing market had remained strong. Housing prices had continued to increase strongly in Sydney and at a solid pace in Melbourne. In other capital cities, trends had been more mixed and annual increases in capital city housing prices (excluding Sydney and Melbourne) had averaged about 3 per cent. Growth of dwelling investment was estimated to have picked up in the December quarter and was expected to remain at a high level in the near term. While credit had continued to grow a little faster than incomes, household leverage had not increased significantly and the Bank would continue to work with other regulators to assess and contain risks that might arise from the housing market.

Members noted that the current setting of monetary policy had been accommodative for some time and that the recent reduction in the cash rate would provide some further support to the economy. They also acknowledged that a lower exchange rate would help achieve balanced growth in the economy. Nonetheless, on the basis of the current forecasts for growth and inflation, members were of the view that a case to ease monetary policy further might emerge.

In considering whether or not to reduce the cash rate further at this meeting, members saw benefit in allowing some time for the structure of interest rates and the economy to adjust to the earlier change. They also saw advantages in receiving more data to indicate whether or not the economy was on the previously forecast path. Further, they noted the greater degree of uncertainty about the behaviour of borrowers and savers in a world of very low interest rates. Taking account of all these factors, members judged it appropriate to hold the cash rate steady for the time being, while recognising that further easing over the period ahead may be appropriate to foster sustainable growth in demand while maintaining inflation consistent with the target.

Latest DFA Survey – Drilling Down On Overseas Investors

Over the next few days we will be posting the results of our latest household surveys. We are going to start with the hot investment segment, and look specifically at the vexed question of the proportion of overseas investors buying investment property for the first time. This is a tough data set to capture, because by definition such households are hard to contact, or prefer not to talk and they do not use an Australian mortgage. However, we devised a proxy set of questions focussing on funding sources, and as a result we now have a view of the proportion of first time investors in the market, and the overseas mix.

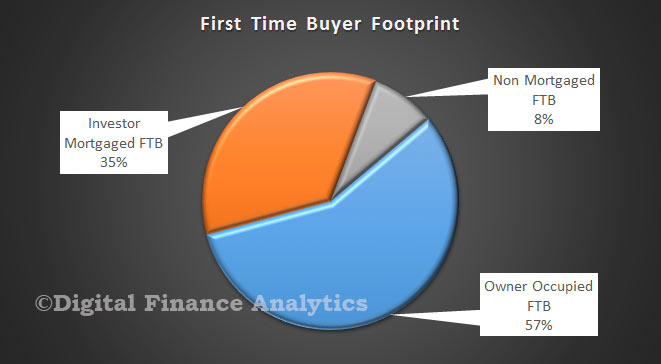
Taking the January data as a starting point, ABS tells us that there were 5,961 loans to owner occupied purchasers. In addition, we identified a further 3,661 first time buyers getting a mortgage for investment purposes. These amount to 35% of loans who are not identified as first time buyers in the ABS data, but are in the overall loan volume data. 8%, or 850, require no mortgage at all, and do not show in the mortgage statistics. We would need reliable purchase transfer records to get at the true picture, something not readily available.

FTBFootprintMar2015From our surveys we teased out the funding options that first time buyers went with. 36% of deals used an interest only mortgage, 41% used a standard repayment mortgage, but the rest, 850 transactions (8%) did not require mortgage funding from an Australian bank but rather used other sources including parents, or were an overseas purchase.

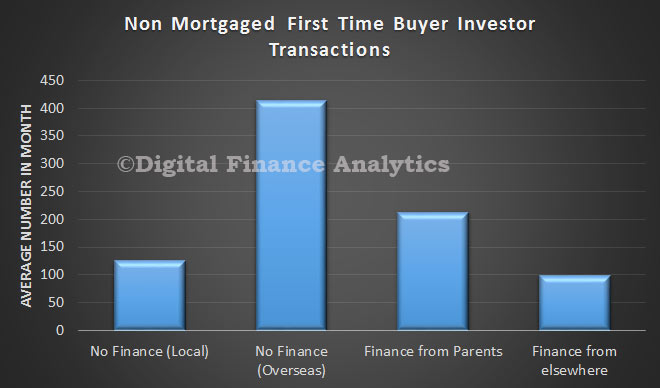
FTBFundingStatusMar2015 We can dissect these purchases based on funding. About 125 were local purchasers without finance, over 200 were financed by parents and under 100 financed from other sources. However the most significant number was the 415 by overseas investors, using funding from offshore.

NonMortgagedInvFTBMar2015

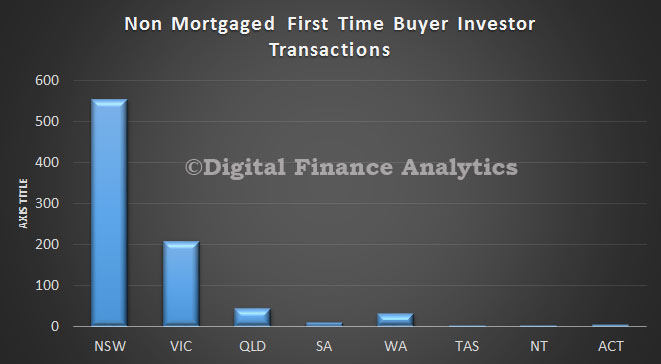
Looking at these 850 transactions through the lens of our surveys, we found that more than 550 were in NSW, more than 200 in VIC and a few sprinkled across the other states. This equates to about 4% of all first time buyers and 9.2% of investor first time buyers. Enough to more than move the dial, especially given the concentration in Sydney.

NonMortgagedFTBStateMar2015  Next time we will look at investor motivations, and future plans. We think the investment housing boom is likely to continue to run, as more investors get the bug.

ASIC puts payday lending industry on notice to lift standards

ASIC today released a report Payday lenders and the new small amount lending provisions that found that payday lenders need to improve compliance with some of the key consumer protection laws operating in the industry. As at December 2014 there were approximately 1,136 Australian credit licensees that identified that they operate in the payday lending industry (out of a total of 5,842 Australian credit licensees). This figure has declined slightly (by about 6%) over the last 12 months.

Nine of the 13 payday lenders in the review have also diversified their business since the new cap-on-costs provisions commenced. Other business interests and products offered identified in the review include:

  • medium amount loans;
  • other credit contracts;
  • cheque cashing;
  • gold buying;
  • purchasing delinquent debts;
  • secured loans; and
  • pawnbroking.

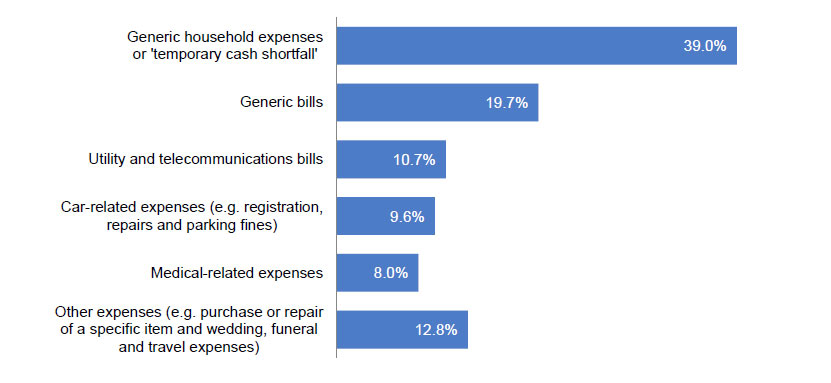
ASIC’s review of 288 consumer files for 13 payday lenders – who are responsible for more than 75 per cent of payday loans made to consumers in Australia – found some lenders engaging in conduct that risks breaching responsible lending obligations. 187 recorded the consumer’s purpose for the loan.

PayDayPurposeWhile ASIC’s review found compliance with some rules was working, it also found that payday lenders are falling short in meeting important new obligations introduced as part of the small amount lending reforms in 2013.

ASIC’s review found particular compliance risks around the tests for loan suitability, which must be considered when the consumer has multiple other payday loans or is in default under a payday loan.

The review also identified concerns where payday lenders set their loan terms at 12 months or more, thereby charging the consumer more fees, in circumstances where a consumer had requested a shorter term and paid the loan back in that shorter time.

The report also found systemic weaknesses in documentation and record keeping, including around the issue of the consumer’s objectives and needs.

ASIC’s review found better levels of compliance with some regulations, including the requirement to provide a warning about alternative credit options and the income protection rules for Centrelink recipients.

ASIC’s review follows a series of enforcement actions against payday lenders, including the recent Cash Store decision which saw penalties of almost $19 million handed down by the Federal Court for irresponsible lending and unconscionable conduct.

Following the work and the conduct that has been uncovered ASIC has commenced investigations and further follow-up work in certain cases, and will consider enforcement action or other regulatory action.

ASIC became the national credit regulator in 2010. Tighter consumer credit rules for small amount lending were introduced in 2013.

ASIC has focused on three areas of misconduct in the payday lending sector:

  • irresponsible lending
  • avoidance through business models that attempt to circumvent the law, and
  • unfair fees and misleading advertising.

Since 2010, ASIC enforcement action has resulted in close to $2 million in refunds to more than 10,000 consumers who have been overcharged when taking out a payday loan. Payday lenders have also been issued with 13 infringement notices totalling approximately $120,000 in response to ASIC concerns about their compliance with the credit laws.

ASIC notes the 2013 small amount credit reforms will be independently reviewed after 1 July 2015. ASIC will continue its focus on enforcing the current provisions and raising industry standards.

Policy Responses In A Falling Market

The IMF just published a discussion paper looking at what happened in Spain, Ireland, US and Iceland after the 2007 crash. In some countries, as house prices fell (some as much a 50%) creating an negative equity situation, the main response was a default sale, whereas elsewhere other strategies were tried, sometimes with government assistance or intervention. With the benefit of hindsight, it appears that loan modification or restructuring offered the best path to economic recovery and provided better outcomes for individual households. Worth noting when the Aussie housing market finally turns!

A number of interesting variations to loan modification were found in the research:

Trial modification – A trial period allows borrowers to showcase their debt service commitment and provides time to further calibrate the efficiency of the loan modification terms, in particular when the recovery is ongoing. In the US, HAMP requires borrowers to enter into a 90-day Trial Period Plan, during which a Net Present Value test is carried out to determine whether the borrower can be offered a permanent loan modification.

Split mortgage – A split mortgage divides the original principal into a part that continues to be serviced in full and a warehoused part that falls due at a later time. The warehoused part may be charged interest. At maturity, this portion may be refinanced, repaid if borrower circumstances allow, paid off from the sale of the home, or written off.

Shared appreciation – A shared appreciation modification reduces the outstanding balance on a mortgage until the borrower is no longer underwater, while entitling the lender to a portion of any home price gain once the home is sold.

Earned principal forgiveness – Arrears or principal forgiveness necessary to ensure long term sustainability may be granted to borrowers that remain in good standing on their mortgage payments. In Ireland and the US, earned principal forgiveness schemes forebear interest on a portion of the loan which may subsequently be forgiven if the borrowers remain current on all debt service obligations.

Negative equity transfer – Products allowing the transfer of negative equity to a new mortgage give mortgagees in negative equity the opportunity to benefit from refinancing at lower rates or move to smaller homes, which may improve their overall debt servicing capacity.

Debt overhang in the aftermath of a systemic housing crisis can cause a weak and protracted recovery. The effects of debt overhang from excessive debt payment burdens or declines in household wealth can create negative feedback effects that hamper the recovery and increase the cost of a crisis. As in other downturns, monetary policy and social safety nets provide a first line of defense. In addition, policies that temporarily allow forbearance of lenders vis-à-vis borrowers and facilitate the modification of distressed mortgages can help to contain the undershooting of house prices by reducing the extent of foreclosure and associated deadweight losses and social costs. Systemic crises can affect the trade-offs involved in these policy choices and warrant policies that deviate from “normal” times. However, different country circumstances suggest there cannot be a “one-size-fits-all” approach, and policy formulation should take into account important country specific factors as well as the stage of the recovery.

Temporary forbearance offers breathing space during a crisis, but should be selective and time-bound. Forbearance can reduce household financial distress in the short run, helping households to adjust their consumption more smoothly. However, temporary forbearance can induce free riding and should only be considered in cases of sufficiently strong prospects for a recovery of the borrower’s debt service capacity. While forbearance can help to act as a circuit breaker at the peak of the crisis, it is important that lenders remain selective in granting forbearance and reach formal forbearance agreements in order to avoid an erosion of the debt service culture and to ensure that borrowers remain engaged. Temporary forbearance can also tie in with loan modification by serving as a “trial modification” and bridging a period of elevated uncertainty about future incomes and house prices.

Systemic housing crises can tilt workout choices from foreclosure towards loan modification. Foreclosures are costly and can have negative externalities on house prices. Negative equity and prospects for the recovery of borrowers’ income suggest that loan modification becomes a net present value efficient solution for a larger share of delinquent borrowers. However, renegotiation cost and other obstacles often obstruct loan modification.

Policies can help to facilitate loan modification. Frameworks for orderly debt renegotiation in form of a code of conduct for lenders dealing with distressed borrowers, together with an efficient statutory framework for personal insolvency, can shape expectations and improve coordination, thereby facilitating timely loan modification. Prudential policies can set appropriate incentives to encourage loan modifications and facilitate the use of innovative modification techniques. A temporary tax exemption could help to enable loan principal relief. Depending on the availability of fiscal resources, support could be provided for mortgage counseling and targeted incentive payments could promote loan modifications. However, experience from Ireland and the US shows that even with such policies, a significant number of mortgages can remain unsustainable and require foreclosure.

Efficient foreclosure procedures provide a resolution of last resort and an important incentive for constructive borrower behavior. In cases where constructive cooperation between borrowers and lenders breaks down, or where no sustainable loan modification would be net present value optimal, foreclosure must remain as last resort. Delays in foreclosure procedures have been found to increase defaults and overall workout costs. Instead, a temporary increase in foreclosure costs through fees or taxes could reduce lenders’ reliance on foreclosure as workout tool. To avoid a deterioration of credit service culture, protections from foreclosure should only be extended to cases where other solutions are likely sustainable (with exceptions for hardship cases), and a foreclosure threat needs to remain present to deter strategic borrower behavior.

Across-the-board debt relief is costly and may require intrusive government intervention. Across-the-board debt relief is sometimes considered as crisis measure as it can be implemented quickly and provides immediate relief to many mortgagees. However, the macroeconomic benefit of a broad-based debt reduction tends to be small relative to its cost, and blanket debt reductions are not well targeted to address debt servicing difficulties. Implementing across-the-board debt relief can also have negative ramifications for the supply of mortgage credit in the long run.

New Vehicle Sales Up, A Little

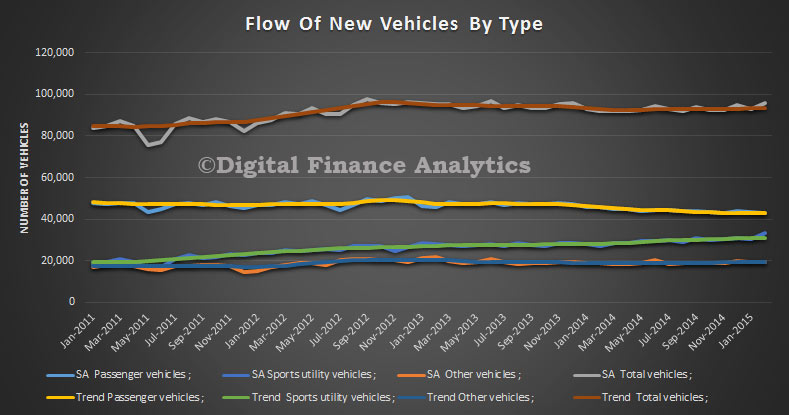
The ABS released the February 2015 New Vehicle Sales data today. In trend terms, February 2015 (93 432) has increased by 0.2% when compared with January 2015, whilst the seasonally adjusted estimate (95 737) has increased by 2.9% when compared with January 2015.

Sales of Sports utility and Other vehicles increased by 0.7% and 0.1% respectively. Over the same period, Passenger vehicles decreased by 9 units, whilst the seasonally adjusted sales of Passenger and Other vehicles decreased by 0.9% and 0.3% respectively. Over the same period, Sports utility vehicles increased by 10.5%.

Feb-Vehciles-By-TypeFive of the eight states and territories experienced an increase in new motor vehicle sales when comparing February 2015 with January 2015 in trend terms. Tasmania recorded the largest percentage increase (1.7%), followed by Queensland (0.6%) and both Victoria and South Australia (0.3%). Over the same period, Western Australia, the Northern Territory and the Australian Capital Territory all recorded decreases in sales of 0.3%.

All states and territories experienced an increase in new motor vehicle sales when comparing February 2015 with January 2015 in seasonally adjusted terms. The Northern Territory recorded the largest percentage increase (22.4%) followed by South Australia (8.8%) and the Australian Capital Territory (5.9%).

Is Higher Market Volatility The New Normal?

Chris Salmon, Executive Director, Markets, Bank of England, gave a speech “Financial Market Volatility and Liquidity – a cautionary note”. He suggests that financial market conditions have changed quite noticeably over the past year or so, with significantly higher volatility. For example, on 15 October and 15 January the immediate intra-day reaction to the news was unprecedented. The intra-day change in 10-year US bond yields was 37 bps, with most of this move happening within just an hour of the data release. The intraday range represented nearly eight standard deviations, exceeding the price moves that happened immediately following the collapse of Lehman Brothers. On 15 January, the Swiss franc appreciated by 14%. The intraday range was several times that number, and market participants continue to debate the highest traded value of the franc on the day.

Could such events could imply that a number of major asset markets may have become more sensitive to news, so that a given shock causes greater volatility? Is this the new normal?

If so, what is the root cause? We know the macroeconomic outlook has changed and perhaps become less certain. Central banks have reacted, and in some cases pushed the innovation envelope further. Unsurprisingly these developments have been associated with more volatile financial markets. Given that policy-makers have previously been concerned that persistently tranquil financial markets could encourage excessive risk-taking, this development is not necessarily an unwelcome development. But recent months have also seen a number of short episodes of sharply-higher volatility which coincided with periods of much impaired market liquidity. There are good reasons to believe that the severity of these events was accentuated by structural change in the markets. There must be a risk that future shocks could have more persistent and more widespread impacts across financial markets than has been the case in the recent past.

Whilst market intelligence suggests that uncertainty surrounding the global outlook has been one factor; itself in no small part a consequence of the unexpected rough halving in the price of oil since last summer. This uncertainty can be seen in the recent increase in the dispersion of economists’ forecasts for inflation in the US, UK and euro area during 2015. Central banks themselves have reacted to the changed global outlook and monetary policy makers have been active in recent months. Indeed, so far this year 24 central banks have cut their policy rates. Moreover, the decisions by the ECB and three other central banks since last summer to set negative policy rates have raised questions about where the lower bound for monetary policy exists.

But he suggests there are two other factors in play, which may indicate a more fundamental change, and lead to continuing higher volatility.

First, market makers have become more reluctant to commit capital to warehousing risk. Some have suggested that this reflects a combination of reduced risk tolerance since the financial crisis, and the impact of regulation designed to improve the resilience of the financial system. This reduction in market making capacity has been associated with increased concentration in many markets, as firms have been more discriminating about the markets which they make, or the clients they serve. And this trend has gone hand-in-hand with a growth in assets under management by the buy-side community. The combination has served to amplify the implications of reduced risk warehousing capacity of the intermediary sector relative to the provision of liquidity from market makers during times of market stress relative to the past.

The second is the evolution of the market micro-structure. Electronic platforms are now increasingly used across the various markets. In some cases regulation has been the cause but in others, such as foreign exchange markets, firms have over a number of years increasingly embraced electronic forms of trading. This includes using ‘request-for-quote’ platforms to automate processes previously carried out by phone. Electronic platforms are effective in pooling liquidity in ‘normal’ times but may have the potential, at least as currently calibrated and given today’s level of competition, to contribute to discontinuous pricing in periods of stress if circuit-breakers result in platforms shutting down. There has been much commentary about the temporary unavailability of a number of electronic trading platforms in the immediate aftermath of the removal of the Swiss franc peg.