First Time Buyer Investors On The March

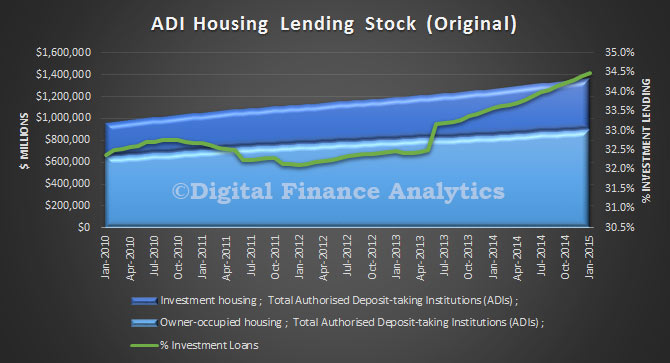
The ABS published their Housing Finance to January 2015. Total lending for housing (both investment and owner occupied lending) lifted the stock 0.6% to $1.37 trillion. Investment rose 0.8% and owner occupied loans rose 0.5% in the month. Investment loans are close to 34.5% of all loans, a record.

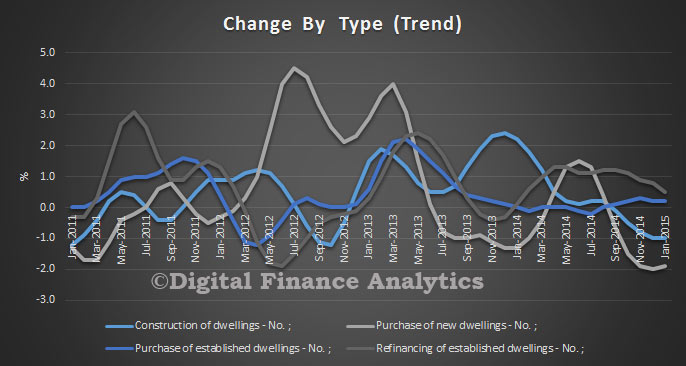
ADILendingStockJan2015Looking at the changes in volumes by type, we see that the purchase of existing dwellings is rising, but refinancing, construction of new dwellings and purchase of new dwellings are down.

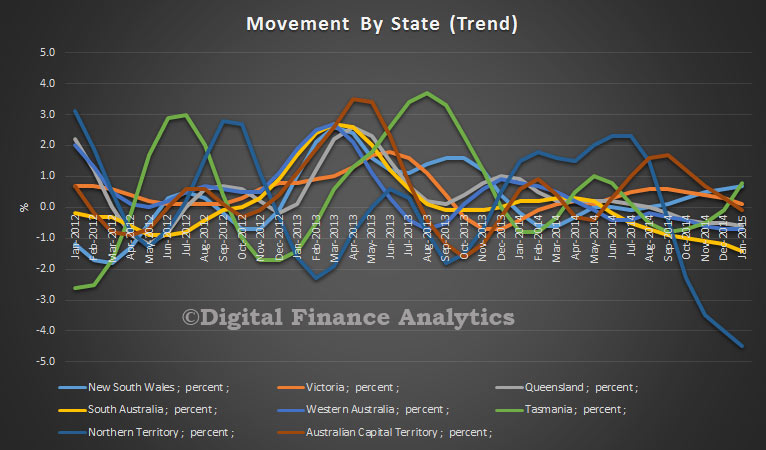
TrendChangeByTypeJan2015Looking across the states, momentum is rising in just two states, NSW and TAS. All other states are slowing.

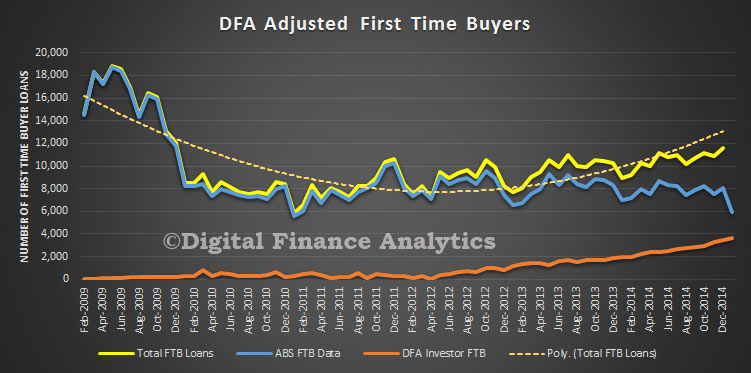
StateTrendMovementsJan2015Turning to first time buyers, using the revised ABS data (method changed last month) and DFA survey data, we see that whilst first time buyers for owner occupation fell slightly (14.3% to 14.2% of all owner occupied loans), an additional 4,000 loans were written by first time buyers going direct to the investment sector. Much of this is centered on Sydney. As a result the cumulative first time buyer count is rising, with more than 21% of all loans effectively to first time buyers. You can read more analysis on this important trend here.

DFAFTBLoansJan2015This is another reason why no further assistance should be offered to “help” first time buyers into the market. It would be a waste of money.


Oil Price Falls And Monetary Policy

In a speech at Durham University Business School, MPC member Ian McCafferty considers the factors contributing to the recent fall in the oil price, the impact on inflation and its likely persistence and how, given this analysis, UK monetary policy should respond.

Ian argues that as with the oil price falls seen in 1985 and 1998, ‘there is merit in examining recent oil price developments, and the implications for the outlook for the oil market, through the prism of hog-cycle theory.’ As with the livestock markets hog cycle theory is based on, short term elasticity of oil supply is low but the longer-term elasticity substantially higher.  As a result the main adjustment to price falls comes from changes in investment plans which in turn impact productivity and supply in the longer term.

This analysis shows that ‘the lag in the supply response means that for a while, even after the initial price fall, supply continues to exceed demand, such that inventories continue to build.’ As the market balances and inventory levels fall back ‘the market tightens and prices begin to rise, encouraging supply to recover. But here too, there are noticeable lags – first, it will require a period of higher prices to encourage producers to commit to new investment, and geographical, geological and political issues mean that the lead time to new supply is relatively lengthy.’

Ian suggests that ‘we can expect oil production to ease in the second half of the year’ and for demand for oil to increase due to the net positive impact to global demand, estimated by Bank staff to stand at around 0.8%, which in turn will support greater demand for oil. ‘Overall, it is reasonable to assume that, by the end of 2015, supply and demand for oil will be coming back into balance, although inventories will remain high for a further period. This should translate into more stable yet still relatively low prices,’ though further out ‘prices might be expected to recover’.

The fall in oil prices, and their predicted persistence, has important implications for both the likely path of inflation and the appropriate response of monetary policy. While the immediate direct effect is clearly disinflationary, detracting ‘a bit more than half a percentage point from headline inflation for the rest of the year’ indirect effects could emerge in both directions. The fall in the oil price could generate inflationary pressure by boosting demand and with little effect on potential supply in the economy. Conversely, the risk of falling inflation expectations feeding through to lower wage settlements could create further disinflationary pressure.

‘How should monetary policy respond to such a sharp oil price shock?  As always in monetary policy, the answer depends on the source of the shock.’ As it is supply rather than demand that has ‘been the dominant factor behind the recent fall in the oil price… it should be treated primarily as a simple cost or price-level shock’. This would mean looking-through the temporary impact on inflation as the MPC has done previously when rising oil prices pushed inflation well above target.

‘But how temporary is temporary? Policymakers need to consider not just the source of the shock but also its persistence.’ In doing so they should, Ian suggests, refer to the ‘optimal policy rule’ which states that ‘looking through an undershoot of inflation, even a prolonged one, is more justified if the real economy is operating at or above full capacity’.

This, combined with the likely path for spare capacity set out in the Inflation Report and Ian’s view that ‘there may be less spare capacity left in the labour market’ than the MPC’s collective judgement, would suggest that it would be right to ‘look through’ the current low level of inflation.

This, however, is complicated by the potential for the persistent, depressing effect on annual inflation to constrain a growth in pay by causing inflation expectations to become de-anchored. ‘Judging the scale of this downside risk is difficult. Some measures of inflation expectations have fallen but others suggest that inflation expectations remain well-anchored, and there are no signs at present that anything approaching deflationary psychology is likely to take hold.’ Nonetheless, it is not a risk the MPC can dismiss, ‘at least while inflation remains close to zero’. This, Ian concludes, is why he decided not to vote for an increase in Bank Rate at the January and February policy meetings.

Hot Sydney Market Distorts National Property Picture

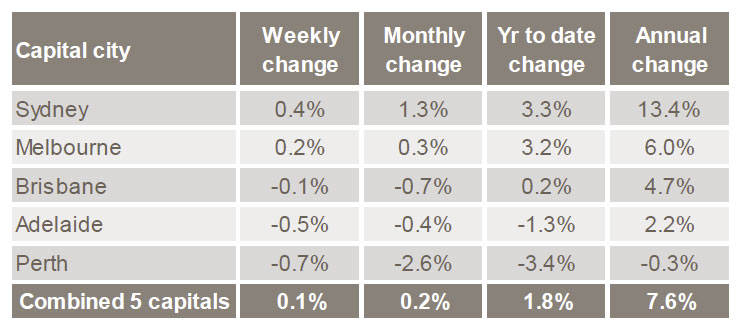
The CoreLogic RP Data Market Summary to 8th March highlights the disparity between the Sydney market and other capital cities. For example, the monthly lift in prices was 1.3% in Sydney, compared with a combined capital city change of 0.2%. It should also sound a warning, if the London market is anything to go by.

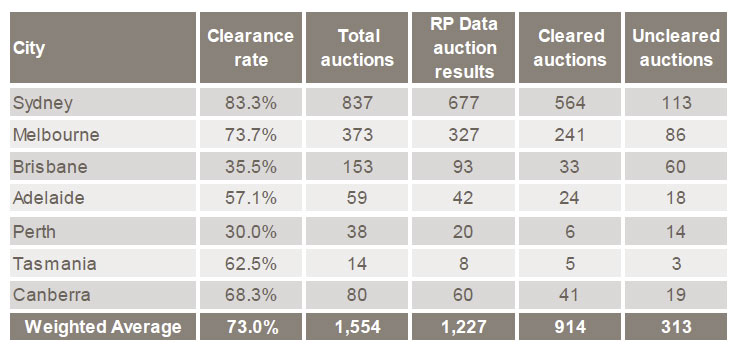
8MarchValues2015Auction clearance rates in Sydney were at 83.3%, compared with a weighted average of 73%, and half of all properties sold were in Sydney (677 out of 1,227).

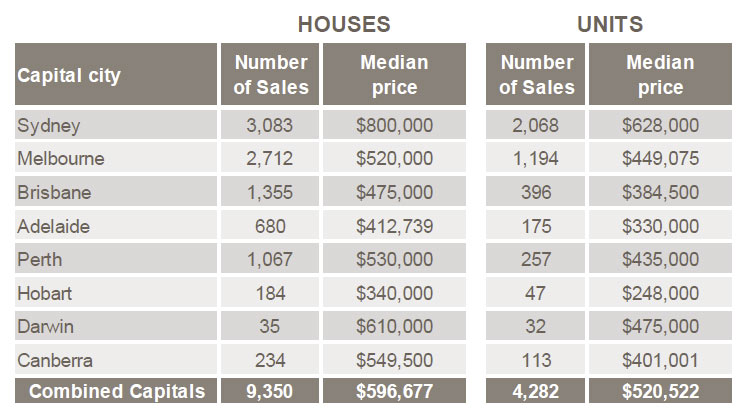
8MarchAuctions2014The average house price in Sydney has now broken above $800,000, compared with a combined average of $596,677.  8MarchPrices2015A word of warning, parallels have been drawn between Sydney and the London property markets in recent time. So, its worth reflecting on this commentary relating to the London market.

Further evidence is emerging that the central London housing market bubble has burst and price falls are spreading throughout the rest of Greater London, the latest index suggests. Prime central London prices are still falling as the supply of properties rises and confidence in property as an investment ebbs away,’ according to the data from Home.co.uk. Central London locations dominate the latest list of biggest house price falls across the UK, with Walworth in the London Borough of Southwark seeing a 15% fall in average house prices between January 2014 and January 2015.

House prices in Belgravia fell by 10.3% over the same period and Cromwell Road in Kensington saw a slump of 8.3%. Of the 20 UK areas with the biggest annual fall in sales prices, 11 are in London. Landlords’ return on investment on central London properties is also falling. Of the 15 UK locations recording negative real % yield, which occurs when the value of the property depreciates by more than the annual rent, 12 are in central London.

The index shows that in January 2015, landlords with a property in Walworth recorded a negative real % yield of 11.3%, while in Belgravia the negative real % yield stood at 7.1%.

Central London flat prices are among the hardest hit. On average, the price of a flat fell by 9% in central London between January 2014 and January 2015. Over the same time, the number of flats for sale in central London has increased by 64%.

Since November 2013, the price of a typical flat in Belgravia has fallen 20%, from £1,995,000 to £1,600,000. A similar price correction has already spread into Islington, where the typical asking price of a flat has dropped 11% since March 2014. This represents a loss of £85,000 for flat buyers in Islington over the last 10 months.

There is further evidence that price falls are rippling out to more remote areas of Greater London and look set to spread further into the South East. The spectre of negative equity is looming large for recent buyers.

Further out in Greater London, Holloway flat prices peaked in May 2014 but have since dropped by 13%, while the typical time on market for flats in the area has more than doubled. Meanwhile, Muswell Hill in North London has seen flat prices fall 4% since October last year.

‘Optimism in the UK housing market is still riding high in the rest of the country, but it comes as a shock to many to learn that prices are?crumbling in the most expensive streets in London,’ said Doug Shephard, Home.co.uk director.

‘These price movements may soon have a knock-on effect for the rest of Greater London and, later, the Home Counties,’ he added, pointing out that prices in central London went up too far, too fast during 2012 and 2013.

‘In a synthetic property boom and bust such as London has experienced, on account of ultra-low interest rates and other stimulus measures, it is hard to imagine any possible remedial action on the part of the government. Prices this time may simply have to fall back to a more natural equilibrium,’ he added.

Stress Testing Households – RBA Paper

The RBA published a Research Discussion Paper “Stress Testing the Australian Household Sector Using the HILDA Survey”.  They use data from the Household, Income and Labour Dynamics in Australia (HILDA) Survey to quantify the household sector’s financial resilience to macroeconomic shocks.

Given high household indebtedness, large mortgages and high house prices, estimating the potential impact of changes to interest rates and unemployment are important. Especially so when so much of banks lending is property related, and capital ratios are lower than pre-GFC. DFA of course models mortgage stress in our own surveys, so we have an interest in this work.

Their model suggests that through the 2000s the household sector remained resilient to scenarios involving asset price, interest rate and unemployment rate shocks, and the associated increases in household loan losses under these scenarios were limited. Indeed, the results suggest that, despite rising levels of household indebtedness in aggregate, the distribution of household debt has remained concentrated among households that are well placed to service it. In turn, this suggests that aggregate measures of household indebtedness may be misleading indicators of the household sector’s financial fragility. The results also highlight the potential for expansionary monetary policy to offset the effects of increases in unemployment and decreases in asset prices on household loan losses.

Our perspective is that the household analysis they are using is not granular enough to get at the differential stress across households, and how potential interest rate rises or unemployment will impact. In addition, interest rates are low today, so it is not possible to extrapolate from events in 2000’s. Given the larger loans, adverse interest rate movements will impact harder and faster, especially amongst households with high loan to income ratios. Therefore the results should not be used as justification for further easing of monetary policy.

Some additional points to note:

The stress-testing model uses data from the HILDA Survey, is a nationally representative household-based longitudinal study collected annually since 2001. The survey asks questions about household and individual characteristics, financial conditions, employment and wellbeing. Modules providing additional information on household wealth (‘wealth modules’) are available every four years (2002, 2006 and 2010). So some data elements are not that recent.

As they rely on information from the HILDA Survey’s wealth modules, they had to impute responses to minimise the number of missing responses and thus increase the sample size. The total sample size for each year is around 6 500 households. Individual respondent data were used to estimate probabilities of unemployment; this part of the model is based on a sample of around 9 000 individuals each year. DFA uses 26,000 households each year, our sample is larger.

How then do they estimate potential household stress? Their model uses the financial margin approach where each household is assigned a financial margin, usually the difference between each household’s income and estimated minimum expenses. This is different from a ‘threshold’ approach, where each household is assumed to default when a certain financial threshold is breached (for example, when total debt-servicing costs exceed 40 per cent of income). DFA captures data on the precursors of stress, and models the cash flow changes as unemployment and interest rates move. We also model the cumulative impact of stress which builds over time (typically households survive for 18-24 months, before having to take more drastic action).

Looking at the potential economic shocks, they examined how an increase in interest rates leads to an increase in debt-servicing costs for indebted households, by lowering their financial margins. Interest rate rises tend to increase the share of households with negative financial margins, and thus the share of households assumed to default. Interest rate shocks are assumed to pass through in equal measure to all household loans.

Falling asset prices have no effect on the share of households with negative financial margins. They assume that a given asset price shock applies equally to all households.

A rise in the unemployment rate causes the income of those individuals becoming unemployed to fall to an estimate of the unemployment benefits that they would qualify for, lowering the financial margins of the affected households. Their approach uses a logit model to estimate the probability of individuals becoming unemployed. This means that unemployment shocks in the model will tend to affect individuals with characteristics that have historically been associated with a greater likelihood of being unemployed.

In their most extreme example, households in the middle of the income distribution and renters are the most affected. Households with younger heads are also affected, while household with older heads are not especially affected in any year, suggesting that the increase in indebtedness among these households through the 2000s did not significantly expose the household sector to additional risks. Households with debt are more likely to be impacted by the scenario than those without debt. However, of those households with debt, the impact of the scenario is greatest on those with relatively little debt.

Their results from the hypothetical scenario suggest that the household sector would have remained fairly resilient to macroeconomic shocks during the 2000s, and that the households that held the bulk of debt tended to be well placed to service it, even during macroeconomic shocks. However, based on this scenario, the effect of macroeconomic shocks appears to have increased over the 2000s. This suggests that household vulnerability to shocks may have risen a little. This might be because some households were in a less sound financial position following the global financial crisis (for instance, because the labour market had weakened and the prices of some assets had declined). As a consequence, shocks of a magnitude that previously would have left these households with a positive financial margin and/or sufficient collateral so as not to generate loan losses for lenders may, following the crisis, have been large enough to push these households into having a negative financial margin and/or insufficient collateral.

The results imply that expected losses (under the scenario outlined) on banks’ household loans were equivalent to a little less than 10 per cent of total bank capital (on a licensed ADI basis), assuming that eligible collateral consists of housing assets only. This result assumes that banks have already provisioned for pre-stress losses, but this may not always be the case, as the deterioration in asset quality may surprise some institutions or may take place before objective evidence of impairment has been obtained. Assuming pre-stress losses are not provisioned for, potential losses as a share of total bank capital roughly double. It is important to reiterate that these estimates are simplistic and could differ to actual losses incurred in reality under this scenario by a large margin. For example, some of these loan losses may be absorbed by lenders mortgage insurance.

It’s The Supply Side Stupid!

Housing is, no surprise, an issue in the NSW election, with Baird promising to facilitate a small number of extra homes (20,000 over 4 years) and Labor talking about deferring stamp duty for first time buyers.

Here is the thing. DFA modelling for NSW indicates we need an additional 150,000 homes in and around Sydney, each year, for the next three years, just to bring things back to equilibrium. Many of these should be starter homes in the inner suburban area, not on the urban fringe. We also need properties designed for older less mobile households.  Our modelling takes account of net migration, demographic shifts, and household preferences. In particular we know there is demand for units and small houses in the inner suburban area, from both first time buyers and investors.

We do not believe that further “assistance” to first time buyers, whether via stamp duty, or access to super, per Hockey’s comments recently have any economic merit (more likely they should be seen as dog whistle politics).

Anything which eases the purchase price will simply lift the price, as for example in the now defunct first time buyer incentives.

The right question is how will policy be changed to release more land for development, and how will planning regulations be tweaked to allow the development of starter homes. How many will be built? If the answer is not in the 100,000’s we do not have the right answer. Such an inflection in supply would have a dampening effect on house price growth.

The root cause of the current issues in property in NSW goes back to pure Economics. Simply put, supply and demand are out of kilter.

On the supply side, not enough property is being constructed to meet increasing demand from local and overseas purchasers. Either space is a problem, land releases have not kept pace, or builders cannot get funding.

Demand is being stoked by demographic shifts, like more single households, older independents and young families. Also, investment purchasers see property as a good hedge against wider uncertainty, so are very active. Many can enjoy tax breaks. Plus Chinese investors have become a major force.

Thanks to the banks, purchasers can borrow more, and this lifts prices. First, low interest rates are making larger mortgages more affordable. Second, they have been able to increase the supply of home lending credit, thanks to lower capital rules, especially for those using the most sophisticated capital management. Next, they see risks in property lending much lower than commercial lending, so are happy to skew their portfolio. Finally, they have changed their lending criteria (although some regulators are pushing back), making larger loans possible, for some.

As a result, rising property prices are artificially lifting bank and household balance sheets. History shows that prices won’t necessarily defy gravity for ever. If they do correct there could be significant consequences for households, banks and the community.

We need proper supply-side strategies.


NZ Reserve Bank Consulting On Property Investor Loans

The Reserve Bank of New Zealand is consulting on a new asset class treatment for mortgage loans to residential property investors within its capital adequacy requirements. They propose to separate investment and owner occupied loans from a capital perspective, (once loan types are defined), and apply different capital treatments, requiring more capital for investment loans, reflecting potential higher risk. This would be applied to both standards and advanced IRB banks, and they would allow a period of transition to the new arrangements, commencing 1 July 2015. The net impact would be to increase the capital costs to lenders of making investment mortgages, and potentially slowing momentum in this sector. RBA please note!

The Reserve Bank’s analysis shows that residential property investor loans are a sufficiently distinct category of loans and that by grouping them with other residential mortgage loans one is not in a position adequately to measure their risk as a separate group of loans. This can have negative consequences for a bank’s awareness of the proper risk associated with those loans and lead to insufficient levels of capital being allocated to them. The Reserve Bank therefore proposes that all locally incorporated banks hold residential property investment loans in a separate asset or sub-asset class. In addition, a primary purpose of the consultation is to seek views on how to best define a property investment loan.

Consultation closes on 7 April and once the Reserve Bank has settled upon a definition, it proposes to amend existing rules by requiring all locally incorporated banks to include residential property investment mortgage loans in a specific asset sub-class, and hold appropriate regulatory capital for those loans.

Reserve Bank Head of Prudential Supervision Toby Fiennes said: “International evidence suggests that default rates and loss rates experienced during sharp housing market downturns tend to be higher for residential property investment loans than for loans to owner occupiers.

“The proposal would bring the Reserve Bank’s framework more into line with the international Basel standards for bank capital. The proposed rule amendment is designed to ensure that banks hold adequate capital for the risks that they face from investment property lending.”

The Reserve Bank has previously consulted on a possible definition that would have seen loans to borrowers with five or more residential properties classified as loans to residential property investors. Partly as a result of submissions received, the Bank has reconsidered the definition, and is now consulting on three possible alternative ways to define loans to residential property investors:

  • if the mortgaged property is not owner-occupied; or
  • if servicing of the mortgage loan is primarily reliant on rental income; or
  • if servicing of the mortgage loan is at all reliant on rental income.

The proposed new rule would apply to all locally incorporated banks.

While the current proposal is not a macro-prudential policy proposal, creating consistent asset class groupings to be used by all banks would help the Reserve Bank to implement targeted macro-prudential policies in the future, should that become necessary.

Looking at the proposals in more detail:

They propose that residential property lending should be grouped in a separate asset class because the risk profile of these loans is observably different from owner-occupier mortgage loans, particularly in a severe downturn. The capital requirements that apply to IRB banks require long run PDs to be estimated on the basis of data that includes a severe downturn or, where that is not possible, to include an appropriate degree of additional conservatism.

Fortunately in New Zealand, we have not had a severe housing downturn in recent decades. But this also means that we do not have information on the difference in terms to default rates between residential property investors and owner-occupiers in such a scenario.

Based on the information available from other countries that have had a severe housing downturn, there is evidence to suggest that property investor loans are more strongly correlated with systemic risk factors than owner-occupier loans. This would point to a higher correlation factor in the Basel capital equation than the one that is currently used for all residential property loans. Moreover, although minimum downturn LGDs are prescribed within BS2B, they are effectively calibrated to owner-occupiers. It is therefore likely that the estimated risk weights that banks currently use for residential investor loans are too low and do not adequately reflect the risk that these loans represent.

The higher risk associated with residential property investment loans does not only apply to IRB banks. A residential property investment loan made by a bank operating on the standardised approach is equally a higher risk loan compared to a loan to an owner-occupier. The Basel approach seems to deal with this by recommending higher average risk weights for all residential property loans under the standardised approach.

In New Zealand, this has been implemented by allocating risk weights to residential mortgage loans that range from 35 to 100 percent, depending on a loan’s LVR and the availability of lender’s mortgage insurance.5 However, housing loans are a crucial area for maintaining financial stability in New Zealand and these risk weights do not adequately capture the higher risk associated with residential property investment loans.

The Reserve Bank believes that in this area, there are good reasons why a consistent conceptual approach across standardised and IRB banks makes sense. In addition, the Reserve Bank has a suite of macro-prudential tools available to help address financial stability concerns in certain circumstances. Having the same asset class groupings across all banks would help the Reserve Bank to implement targeted macro-prudential policies if that becomes necessary. Contrary to previous consultation papers on this subject therefore, the Reserve Bank now proposes to include a new asset class for residential property investors within the standardised approach, i.e. BS2A. This new asset class would also have separate, prescribed, risk weights from those that apply to non-residential property investment loans.

It is necessary to define what constitutes an investment loan. The first and in some ways simplest option would be to restrict the current retail residential mortgage asset class to owner-occupiers only. Any mortgage on a residential property that is not owner-occupied would be classified as a residential property investment loan and grouped in a new asset class.

Banks would have to verify the use of a property under this option. This information is already being collected at loan origination to some degree. Possible ways of identifying whether a property is owner-occupied or not include checking the borrower’s residential address and
whether the property generates any rental income. Other possible indicators could include eligibility for tax deductibility of the mortgage servicing costs on the property. The Reserve Bank appreciates that there could be cases where a borrower has more than one owner-occupied residential property and splits his or her time between those addresses. An example could be if a borrower uses one address during the week for work purposes and another on the weekends when he or she is with the family. Another case might be a bach that is not permanently occupied but also does not generate any rental income. The information the Reserve Bank collects from banks on new commitments already distinguishes between owner-occupiers and residential property investors while allowing for owner-occupiers to occupy more than one residential address. The same or a very similar definition could be used to distinguish between second and more properties that are still owner-occupied and properties that are used as residential properties, subject to considering adequate safeguards to ensure that this is not used as an avoidance mechanism.

The Reserve Bank also appreciates that there could be challenges for banks to monitor how a property is being used. A second flat that is used as a second residence by the owner-occupier when the loan is taken out could at some point be let out. While the Reserve Bank does not expect banks to regularly seek confirmation form borrowers as to the use of a property, it is expected that reasonable steps are taken to maintain up to date information. This could mean updating important information when there is a credit event.

An alternative option would be to use mortgage servicing costs as an indicator. If mortgage servicing are predominantly reliant on the rental income the property generates, then that loan should be classified as a residential property investment loan. Predominantly was defined as more than fifty percent. In other words, if a borrower’s other sources of income minus the bank’s usual allowances for living expenses, other loan servicing obligations and so on are sufficient to cover more than fifty percent of the loan servicing obligation of the residential property, that is interest as well as repayment of principal, then the loan continues to be classified as a residential mortgage loan in the retail asset class. This test would only apply to investment properties. Owner-occupied properties would be exempt from this requirement and continue to be classified as residential mortgage loans. There is, however, a question as to the point at which the reliance on the property’s rental income separates that loan from loans to owner-occupiers. The Reserve Bank has previously consulted on a threshold of 50 percent. But this still leaves plenty of scope for borrowers to acquire a small portfolio of investment properties without those mortgages being classified as residential property investment loans. A stricter definition would be to make it dependent on any rental income.

Irrespective of which definition and asset class treatment is decided on, banks are likely to require some time to implement the new requirements. For example, banks will have to assess which of their existing exposures are caught by the residential property investment loan definition, make changes to their information capture and IT systems and retrain staff. This will take some time. The Reserve Bank is therefore currently minded to phase the new requirement in over a period of nine months.

IRB banks may also have to develop new models for their residential property investment loan portfolio, although that is not necessarily the case and existing PD models would form a good basis on which to build residential property investor specific models. IRB banks, however, would have to amend their capital engines for residential investor loans to use the proposed LGDs and correlation factors.

It is proposed that IRB banks operate under the same risk weight requirements as standardised banks until their new models have been approved by the Reserve Bank. Furthermore, it is proposed that the new asset classification for residential property investors takes effect from 01 July 2015.

They are also proposing changes to capital requirements for reverse mortgages. Managing a portfolio of reverse mortgages requires long term assumptions to be made concerning a number of factors. If those assumptions turn out to be wrong, the risk to a lender could be significantly affected. For example, advances in geriatric healthcare might mean that people stay longer in their houses than currently anticipated. That could increase the risk of incurring a loss on a portfolio of reverse mortgages due to compound interest, the possibility of the borrower being granted further top ups and the difficulty of predicted house prices years and decades ahead.

While arrangements whereby the reverse mortgage has to be repaid after a certain period of time or stay below a set LVR are theoretically possible, they are not the norm and would most likely be to the disadvantage of the borrower, and thus undermine the attractiveness of a reverse mortgage.

To emphasise, one way in which the risk profile of a reverse mortgages differs from a normal mortgage is in the time dimension. Whereas a normal mortgage loan decreases over time, the opposite is the case for a reverse mortgage.

Finally, the Reserve Bank considers it more appropriate group credit card and revolving retail loans in the “other retail category and to remove QRRE as an option from its capital requirements for IRB banks. This would improve clarity within BS2B while having no direct impact on banks since no bank has been given approval to use the QRRE option.

Basel II framework for IRB banks introduced the concept of a ‘Qualifying Revolving Retail Exposure’ as one of three categories of retail loans. The other two categories are residential mortgages and other retail, a catch all for retail loans other than residential mortgages. The QRRE category is intended to be used for short-term unsecured revolving lines of credit, e.g. credit cards and certain overdraft facilities. In New Zealand credit card loans account for approximately 1 to 3 percent of banks’ total lending portfolios. Compared to the other two categories, the capital requirement for QRRE loans is generally lower (except for some very high probability of default (PD) buckets).

In line with Basel II, the Reserve Bank’s capital adequacy requirements provide for the use of the QRRE category. However, use of the QRRE classification is subject to Reserve Bank approval and no bank has been granted approval as yet. The Reserve Bank is concerned that some of the underlying assumptions of the QRRE category do not apply in the New Zealand context. The evidence supplied by banks when seeking approval for QRRE use has not able to demonstrate the validity of those assumptions in New Zealand.
 

New Zealand’s Potential New Capital Rules on Investor Mortgages are Credit-Positive – Fitch

Fitch Ratings views positively the Reserve Bank of New Zealand’s (RBNZ) consultation on the capital treatment for mortgages to residential property investors. Higher capital requirements for investor loans combined with the existing loan to value ratio (LVR) limit could help protect banks against material losses in the event of a property price correction.

The RBNZ proposes to modify existing capital rules by requiring banks to include investor mortgages in a specific asset sub-class, and hold appropriate regulatory capital for those assets. Investor mortgages in New Zealand have performed similarly to owner-occupied mortgages but the experience in other markets has shown weaker asset quality performance in a downturn. The consultation paper seeks to define the terminology of investor mortgages in order to make policy decisions by end-April 2015. Currently investor mortgages are treated the same as owner-occupier mortgages for regulatory capital purposes in New Zealand.

The introduction of higher capital rules for investor mortgages may also slow the growth rates of property prices, particularly in Auckland. Increased investor demand and a rise in investor mortgages appear to be a contributor to this strong growth, and the RBNZ’s proposed limit could address some of the risks associated with these loans. The agency expects banks to charge higher interest rates on investor mortgages to offset the higher capital requirements which may deter some of the more marginal investment activity in the market. Price rises in Auckland have exceeded 10% per annum over the last 24 months which is unlikely to be sustainable in the long-term.

Investor mortgages typically have lower LVRs relative to owner-occupier loans and therefore are less susceptible to the RBNZ’s existing LVR restrictions, introduced in October 2013. Banks are only allowed to underwrite a maximum of 10% of new mortgages with an LVR in excess of 80% which has reduced some potential risk in the banks’ mortgage portfolios.

The new measures could also indirectly help to limit growth in household indebtedness by reducing house price appreciation closer to income growth. New Zealand’s household debt, measured as a percentage of disposable income stood at 156% at end-September-2014, which is high relative to many peer countries and has increased by 5pp since 2012. Although interest rates are still low compared to the historical long-term average, a rise in the official cash rate could place borrowers at risk of being unable to service their mortgages, and may eventually lead to asset quality problems for the banks. However, this risk is partly mitigated through bank affordability testing, which includes adding a buffer above the prevailing market interest rate when assessing serviceability.


Limits To Low Interest Rate Policy

In a recent speech, “Low Inflation in a World of Monetary Stimulus” RBA Deputy Governor Philip Lowe highlighted the impact of low interest rates. Significantly he observes that low interest rates are not translating into buoyant consumer spending. As a result, such monetary policy will not necessarily deliver the desired economic outcomes.

One area where low interest rates do appear to be having the broadly expected effect is on asset prices: global equity markets have been strong; property prices are again recording solid gains in some countries; and bond prices have increased substantially. However, for these increases in asset prices to boost the global economy, households and businesses need to respond by increasing their spending. While in the United States there are now some signs that this is happening, on the whole the response of private spending to higher asset prices has been muted.

Overall, looking at this experience, I find it difficult to escape the conclusion that changes in interest rates are not affecting decisions about spending and saving in the way they might once have done. Undoubtedly, low interest rates are helping to repair balance sheets by lowering debt-servicing costs and by pushing up asset prices. In so doing, they are helping lay the foundations for future growth in consumption and investment. But, while this repair process is taking place, consumption is weaker than it otherwise would be. In turn, subdued consumption growth is feeding through to a more subdued business climate and weaker investment.

Arguably, a similar dynamic has been playing out in government finances in a number of countries. After the financial crisis, many governments found themselves with debt levels that were very high. Like many households, they have responded by tightening their belts. Given the high levels of debt and ongoing imbalances between recurrent revenue and expenditure, few governments have seen the very low interest rates as an opportunity to support long-term infrastructure investment at low cost. Rather, much as households have done, governments have taken advantage of the lower debt-servicing costs to help shore up their finances.

He concludes that low interest rate monetary policies are unlikely to succeed.

Finally, stepping back from the short term, the low interest rates we are seeing globally and in Australia are a direct consequence of an elevated appetite for saving and a muted appetite for real investment in many economies. Monetary policy globally has responded to this reality in a way that a decade or so ago would have hardly seemed imaginable. In doing so it has helped the global economy through a very difficult period. But, at the end of the day, the solution to the problems caused by the disconnect between the desire to save and the desire to invest cannot lie with monetary policy. Instead, it lies in measures to improve the investment environment so that once again there is strong productive demand for the use of our societies’ savings.

Review of Card Payments In Australia

The RBA has issued a paper outlining the proposed scope of a review of card payments in Australia. Given the evolution of payments, the rise of new payment platforms, weaknesses in the current interchange arrangements, payment surcharging and changed economics in the payments value chain, this is timely. Submission on aspect of the Bank’s card payments reforms, should be provided by no later than 24 April 2015.

The RBA outlines a number of factors which indicate a review is needed:

  • Aspects of the interchange fee system and merchant surcharging practices have raised concerns, some of which were noted in the Board’s 2013 Annual Report and the Bank’s two submissions to the Financial System Inquiry (FSI).

  • There have been some significant changes to the regulation of card payments in other jurisdictions.

  • The completion in 2014 of the Bank’s third Consumer Use Survey and second Payment Costs Study have provided a useful evidence base for considering possible changes to policy.

  • The continuing growth in the role of cards in the payments system since the initial reforms underscores the need for an appropriate regulatory framework for such payments.

  • Interchange arrangements in the card systems will also affect the nature of new payment arrangements that are adopted by the payments industry. In particular, a more efficient and lower-cost new payment system might be hampered in its development to the extent that it had to match existing interchange payments to card issuing institutions to ensure the participation of banks in the new system.

  • The FSI has made recommendations directed at the Bank and its regulation of card payments, with particular focus on interchange fee regulation and surcharging.

The Payments System Board would be interested in hearing the views of stakeholders about the issues raised in the previous chapter and possible changes to the regulatory framework that might address those issues.

Some of the possible changes to the regulatory framework are along the lines of those suggested in the Final Report of the Financial System Inquiry (FSI). The Final Report endorsed the broad nature of the Bank’s reforms over the past decade or more. In particular, the Report stated that ‘the Inquiry believes interchange fee caps improve the efficiency of the payments system. Without interchange fee caps, price signals for customers are less clear and outcomes are less efficient because customers can be encouraged to use higher-cost payment methods’ (FSI 2014b, p 171). In addition, the Final Report stated that ‘the Inquiry agrees with the RBA that surcharging can improve the efficiency of the payments system by providing accurate price signals to customers’ (FSI 2014b, p 175).

However, the Final Report noted a few areas where the Inquiry believed the existing regulatory framework could be improved. These included lowering the existing interchange fee caps and broadening their application, and improving the accuracy of price signals in surcharging and the enforceability of mechanisms against excessive surcharging. The FSI Final Report took a holistic view of the card systems, just as the Bank’s earlier reforms have recognised the interlinkages between different aspects of the operations of the card systems. One example is that the Report’s recommendations on surcharging were linked to its recommendations on interchange fees. In particular, the surcharging recommendations reflect the idea that if it was possible to promote the availability of low-cost methods of payment for consumers and merchants, the case for merchants retaining the right to surcharge for those low-cost methods of payment would be reduced.

Specific Issues for Consultation

The Board is interested in the views of stakeholders on the following issues.

With respect to the regulation of interchange fees, the Board is interested in views on the following options:

  • Publishing thresholds for which payment system providers will be subject to interchange or related regulation, possibly based on transaction values and/or market shares. The FSI Final Report suggests that that this would give new entrants and existing providers greater certainty about how regulation will be applied and would enhance competitive neutrality between providers. Such thresholds could potentially apply to providers such as American Express, as well as other international schemes such as UnionPay, if they entered the domestic market. Thresholds might also be applied for surcharging regulation and could potentially apply to providers such as PayPal.
  • Broadening interchange fee caps to include other payments between schemes and issuers. There are a range of payments (such as marketing fees, sign-on fees, incentive fees and rebates) from schemes to issuers that are used in both three- and four-party schemes. These other payments can potentially be used to circumvent interchange caps: for example, a four-party scheme can increase fees charged to acquirers and use these funds to pay rebates to issuers, mimicking an interchange payment. Similarly, rebates or incentives paid by a network to an issuer in a companion card arrangement can achieve similar outcomes to an interchange fee. The FSI Final Report suggests that broadening the current interchange fee caps to apply on a broader functional basis would help prevent circumvention of interchange caps and enhance competitive neutrality in the case of companion card arrangements. Regulation of other incentive payments has already been implemented for debit cards in the United States, and is proposed for both debit and credit card schemes in the new EU payments regulation.
  • Making changes to the interchange benchmark system to reduce the upward ‘drift’ in average interchange rates inherent in the current three-year reset cycle. One option would be to shift to more frequent benchmark observance, such as annually or even quarterly. This would ensure that average interchange rates were much closer to the benchmark, though this might not have much effect on the tendency for the gap between the highest and lowest interchange rates to widen.
  • Lowering interchange caps. The FSI Final Report suggests that payments system efficiency could be enhanced by lowering interchange fee caps, with the benefits including lower product prices for all consumers as a result of lower merchant service fees, and less cross-subsidisation in the payments system.
  • Replacing weighted-average interchange caps with hard caps. The FSI Final Report notes that weighted-average caps allow schemes to set interchange schedules which imply relatively high payments costs for smaller merchants without market power and low costs for larger merchants. In addition, the widening in the range of interchange fees raises questions about the transparency of costs for many merchants. Furthermore, the current system of observance of the caps has meant that weighted-average interchange fees in the MasterCard and Visa systems have typically been above the caps. In the new European Union (EU) payments regulation previous settlements reached with MasterCard and Visa, constraining interchange fees for cross-border consumer credit card transactions to 30 basis points per transaction or a maximum weighted-average cap of 30 basis points respectively, will be replaced by a hard cap of 30 basis points on all credit card transactions.
  • Applying caps as the lesser of a fixed amount and a fixed percentage of transaction values. The FSI Final Report suggests that applying a fixed percentage cap for debit cards, in addition to a fixed-value cap, would ensure low interchange payments on low-value transactions which would promote merchant acceptance. The use of a dual percentage/value cap has also been proposed in the new EU payments regulation, where debit card interchange could be capped at the lower of 20 basis points or a fixed-value cap which member states may set at their own discretion. In the case of credit cards, the FSI Report notes that the introduction of a fixed-value cap would be a significant change and that a transition period might be warranted if it were adopted.
  • Including prepaid cards within the caps for debit cards. As noted above, there is a degree of ambiguity in how prepaid cards are dealt with under the interchange benchmarks. Accordingly, it would be helpful to clarify this in a review.
  • Allowing for ‘buying groups’ for smaller merchants to group together (subject to any competition law restrictions) to negotiate to receive the lower interchange rates that are accessible to larger merchants. This option might be considered in the event a future interchange system continued to generate large differences in the interchange rates faced by different types of merchants. A similar measure was part of a settlement between US merchants and MasterCard and Visa in 2012, although that agreement only requires that card companies meet with merchant buying groups, and not that card schemes must offer similar rates to merchant groups that bring similar transaction volumes.

With respect to surcharging, the Board is interested in views on the following options:

  • A tiered surcharging system, perhaps along the lines of the FSI recommendations. The FSI Final Report suggests that a three-tier approach would be likely to reduce cases of excessive surcharging by providing merchants with clearer surcharging limits that will reduce problems with enforcement in the current system. Alternatively, other variants of a tiered system might be appropriate. The FSI Final Report proposal would include:
    – Allowing low-cost system providers to prevent merchants from surcharging, to encourage consumers to use low-cost payment methods. The Final Report suggests that systems would qualify as low-cost if their interchange fees were below the caps for debit systems (or if three-party systems were equivalently low-cost in terms of merchant service fees). Given the widespread holding of debit cards, this would imply that essentially all consumers would be able to make card payments (presumably including in the online environment) without being surcharged.
    – Allowing medium-cost providers to limit surcharges to limits set by the Board. The Final Report suggests that schemes would qualify as medium-cost if their interchange fees were below credit card interchange fee caps (and three-party systems could qualify if their merchant service fees were equivalent to those of other medium-cost providers). The limit set by the Board might be based on average card acceptance costs. Such limits would be published, which would ensure that it was immediately observable to card schemes, consumers and others if a merchant was surcharging excessively – this would enhance the enforceability of such limits.
    – Allowing high-cost providers to limit surcharges to the reasonable cost of acceptance. Such providers would also be required to disclose that they were high-cost providers so that their customers would understand why they were likely to be surcharged. The reasonable cost of card acceptance would be based on the costs of the particular merchant, meaning that there would remain scope for dispute over whether a merchant was surcharging excessively.
  •  Targeted changes to reduce particular cases of excessive surcharging. The two industries where concerns about surcharging are most vocal are the taxi and airline industries. Surcharging in the taxi industry is becoming the focus of most state taxi regulators. In the case of the airlines, the current fixed-dollar surcharges would appear to be well above the reasonable cost of card acceptance for low-value fares, given that the costs associated with credit cards are typically mostly ad valorem or percentage-based. Accordingly, a simple measure might be to modify the Bank’s surcharging Standard or Guidance Note to allow schemes to cap any surcharges that are not percentage-based at some low fixed-dollar amount. This could result in a significant reduction in surcharges payable on lower-value fares. It is possible that a change such as this, which would be largely independent of potential other changes to the regulatory framework, could be made relatively quickly.
  • Any other changes to enforcement procedures and disclosure practices. Where merchants wish to surcharge for particular high-cost payment instruments it is important that any charge should be properly disclosed up front and that there is at least one non-surcharged method of payment that is generally available to consumers. The Board is interested in stakeholder views regarding the extent to which these requirements are met by merchants and also in more general views as to mechanisms by which excessive surcharging or incomplete disclosure of surcharges might be addressed.

The Board is also interested in views on some other possible regulatory changes that could improve the way that market forces operate in the cards system:

  • Strengthened transparency over the cost of payments to merchants and cardholders. To the extent that there continued to be large differences in interchange rates on cards from a particular system, it would seem important for merchants to know the cost of accepting a card at the time of the transaction, so they can make informed decisions regarding acceptance or surcharging. Greater transparency would also be important for consumers to enhance their understanding of whether they are using a low-cost card or a high-cost card that may be surcharged. Measures to improve transparency could include:
    – Ensuring that debit and credit cards are more readily identifiable by merchants electronically.
    – Requiring, as in the new EU payments regulation, that categories of cards with different interchange fees should be identifiable both visually and electronically, so that consumers and merchants are aware when a high-cost card is being used.
    – Requiring, as in the EU payments regulation, that acquirers must offer merchants pricing and billing that separately shows the interchange fee and merchant service charges that apply to each brand and category of cards. While many Australian merchants are now subject to ‘interchange-plus’ pricing for each scheme, others are still subject to blended rates, including between debit and credit, and some merchant statements do not promote a good understanding of card costs borne by merchants.
  • Further easing of ‘honour-all-cards’ rules to allow merchants to decline to accept cards with high interchange fees. The current restrictions on honour-all-cards rules allow merchants to make separate acceptance decisions on debit versus credit, but could be extended to allow merchants the freedom to decline high-cost cards within a particular scheme.
  • Facilitation of differential surcharging by merchants. To the extent that the acquiring market was not providing the ability for merchants to surcharge differentially based on the nature of the card, it might be desirable to explore measures that would require card schemes and acquirers to provide merchants with such ability to differentiate. This might be supplemented, as in the EU proposal, with controls on scheme rules or contractual terms that prevent merchants from informing consumers about the cost of interchange fees or merchant service charges: this would mean that Australian merchants could not be prevented from informing customers of their cost of card acceptance if they wished to justify their surcharging policies.
  • Ensuring that merchants have the ability to choose to route their transactions via lower-cost networks or processors. This might involve requiring, as is the case for debit cards in the United States, that acquirers must route transactions through the network which the merchant has nominated as their preferred option among those networks available on a card. This could provide some offset to the tendency for competition between schemes to drive interchange fees higher. A stronger option, as will be required in the EU payments regulation currently being considered, would be that the scheme activities and processing infrastructure of card networks are legally separated, so as to facilitate competition in the market for processing transactions.
  • Clarifying arrangements for competing payment options within a single device or application. One option might be along the lines of the proposed EU payments regulation concerning ‘cobadging’ and choice of payment application. Regulatory measures might include restrictions on scheme rules that prevent the inclusion of other payment brands or payment applications on a device (e.g. mobile phone) or that may prevent different payment options being included within a payment application. The proposed EU payments regulation also requires that security standards or technical specifications, and arrangements for routing transactions, should be applied in a non-discriminatory manner when handling two or more different payment brands or applications on a single device. Similarly, providers of payment services might be required to allow merchants or cardholders the option of specifying their own preferences regarding the priority of different networks or payment methods, both on co-badged devices and in mobile wallet applications.

Finally, the Board is also interested in stakeholder views on the appropriate regulatory arrangements for prepaid cards.

General Issues for Consultation

The Board expects that stakeholders may wish to raise other issues concerning card payments and their role in the broader retail payments system. Accordingly, it encourages stakeholders to suggest any additional measures that the Bank should consider in a review of the regulatory framework. The Board will also take account of any relevant responses to the Government’s current consultation on the recommendations in the Final Report of the Financial System Inquiry.

The Board recognises that some of the possible regulatory changes discussed above (e.g. changes to the interchange fee caps) could imply significant changes to business models in the cards industry while other possible changes (e.g. to improve the transparency of costs to merchants) could imply significant systems changes by schemes and acquirers. It will be mindful of these issues as the Review proceeds. However, the Board notes its concerns about the existing cards model which results in most merchants facing significant variability in the cost of card transactions within the four-party schemes, while having no visibility over these costs at the time of the transaction. Similarly, merchants have limited or no ability to respond to these differences by charging differentially or declining to accept high-cost cards. Accordingly, the Board encourages stakeholders to suggest measures that could address its concerns in ways that would minimise adjustment costs for the payments industry.

During the 2007–08 Review, the Board and the Bank spent a considerable amount of time exploring a non-regulatory approach whereby voluntary undertakings from schemes in relation to interchange fees could serve in place of formal regulation. As noted above, ultimately industry participants were unable to arrive at arrangements that the Board considered were in the public interest. International experience also suggests that non-regulatory solutions have been difficult to achieve. Furthermore, the option of removing interchange fee caps was touched on in the Interim Report of the FSI (FSI 2014a, p 2-31) but not endorsed by the Final Report (FSI 2014b). The Board sees challenges in a nonregulatory approach, but would nonetheless be interested in stakeholder views on approaches that could result in a sustainable framework that met the Board’s concerns and were in the interests of competition and efficiency in the Australian payments system.

Finally, while it is important that any changes to the regulatory system should occur in a way that recognises all the interdependencies, the Board is interested in views about whether there are particular targeted changes, for example to the surcharging framework, that could usefully occur ahead of any more general package of reforms.

Asia’s Digital-Banking Boom

According to McKinsey, among the consumers surveyed in developed Asian markets, including Australia, more than 80 percent said they were willing to shift some of their holdings to a bank that offers a compelling digital proposition. Further evidence for the digital disruption incumbents are facing and highlighted in our “Quiet Revolution” report, which looks in detail at consumer preferences in Australia.

Here is the McKinsey commentary. You can get their full report here.

Since 2011, adoption of digital-banking services has soared across Asia. Consumers are turning to computers, smartphones, and tablets more often to do business with their banks, while visiting branches and calling service lines less frequently. In developed Asian markets, Internet banking is now near universal, and smartphone banking has grown more than threefold since 2011. In emerging Asian markets, the trend is similarly dynamic, with about a quarter of consumers using computers and smartphones for their banking. And despite some structural obstacles, we believe this surge will continue—and incumbents and market entrants alike should prepare for the consequences.

Last year, we surveyed about 16,000 financial consumers in 13 Asian markets,1 and the results showed drastic shifts in behavior compared with a similar survey in 2011. Put simply: Asian financial-services consumers are going digital, and fast. While this rise of digital banking has been anticipated for many years, several factors have combined to accelerate it, most notably the rapid increase in Internet and smartphone adoption and growth in e-commerce. Both have helped demand for digital banking move from early adopters to a broad range of customers.

For incumbent banks, the stakes are particularly high. Among the consumers we surveyed in developed Asian markets, more than 80 percent said they were willing to shift some of their holdings to a bank that offers a compelling digital proposition. In emerging Asia, more than 50 percent of consumers indicated such willingness. Many types of accounts are in play, with respondents saying generally that they could shift 35 to 45 percent of savings-account deposits, 40 to 50 percent of credit-card balances, and 40 to 45 percent of investment balances, such as those held in mutual funds.

Across Asia, we estimate more than 700 million consumers use digital banking regularly, with a significant portion in fast-growing markets like China and India. In developed Asia, 92 percent of respondents in 2014 said they had used Internet banking, compared with 58 percent in 2011. Also, 61 percent had accessed banking services using smartphones, more than three times the penetration seen in 2011. Behaviors in emerging markets showed a faster shift, although from a much smaller base. Internet-banking penetration in these markets rose from 10 percent in 2011 to 28 percent in 2014, and smartphone access rose from 5 percent in 2011 to 26 percent in 2014.

Further, customers across Asia are using digital banking more frequently. In developed Asia, customers connect with their banks over the Internet or via smartphones more often each month than over traditional channels. In emerging Asia, these traditional channels, especially ATMs, still dominate, but customers are using Internet and smartphone banking almost five times more often than in 2011. Across Asia, consumers made fewer branch visits and calls in 2014 than in 2011.

The rapid shift toward digital banking might suggest the demise of the bank branch, but several factors assure that branches will retain an important role in Asia for the foreseeable future. For example, consumers are using multiple channels, rather than turning solely to online or branch services. Regulatory requirements, demand for personal advice, and a sense of security support the continued need for branches, the survey shows.

Drawing in digital consumers will require more than an online presence, even one that is best in class.2 Our research shows that in developed Asia, consumers value the quality of basic services, the strength of financial products, brand reputation, and the quality of customer service and experience. Among these, they are typically least satisfied with the financial products offered and with customer experience. Survey results from emerging Asia were less conclusive, indicating these markets are at the early stages in digital banking.

Our findings also show that simplicity and security are crucial aspects for online offerings. Of banking customers who have not made any online purchase of banking products, 47 percent in developed Asia and 35 percent in emerging Asia said the primary obstacle is that the products are so complicated that they needed a person to explain them. At the same time, security concerns stopped about 56 percent of the respondents in emerging Asia and 44 percent of those in developed Asia from purchasing products online.