The World Economy
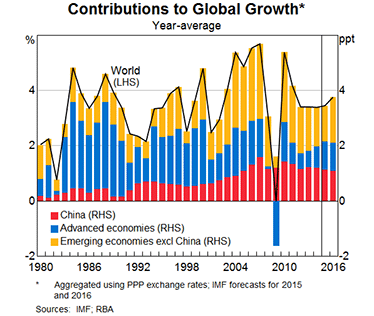
There are about as many indicators of the world economy as there are people studying it. My remarks will be fairly high-level, and since we have just had the IMF meetings, it seems appropriate to begin with the picture they present. The Fund’s latest publication estimates that output in the world economy grew by 3.4 per cent in 2014 (Graph 1). This is a bit shy of the long-run average of 3.7 per cent, and actually fractionally above the previous estimate in October. The projections are for a slight pick-up in 2015 and around average growth in 2016. These figures are broadly in line with the private sector consensus.
Most of the recent growth has come from the emerging world. As a group, the emerging world grew by 4½ per cent in 2014. China grew by about 7½ per cent, more or less as the authorities intended. It will probably grow by a little less in 2015; the IMF is saying below 7 per cent. But given its size now, China growing at 6–7 per cent would still be a major contributor to global growth. Indeed, the current projections have China contributing about the same growth in global output in 2015 and 2016 as it did in recent years. Meanwhile, growth looks to have picked up in India but softened in some other emerging markets.
Graph 1
In the major advanced economies, in contrast, growth has generally been below previous averages for quite a number of years. It has taken longer to recover than we had all hoped. There are, happily, some signs of improvement at present. Growth is slowly recovering in the euro area and has resumed in Japan. In the United States, notwithstanding some recent softer numbers, the economy looks to have pretty reasonable momentum. So it would appear that we are heading in the right direction.
Unfortunately, that doesn’t mean the legacy of the 2008 crisis is yet behind us. From the vantage point of most central banks, the world could hardly, in some respects, look more unusual. Policy rates in the major advanced jurisdictions have been near zero for six years now. In fact, official deposit rates in the euro area and some other European countries are now negative. As it turns out, the ‘zero lower bound’ wasn’t actually at zero. Central bank balance sheets in the three large currency areas have expanded by a total of about US$5½ trillion since 2007, and the ECB and Bank of Japan will add, between them, about another US$2½ trillion to that over the next couple of years.
That central banks have had to take such extraordinary measures speaks both to the severity of the crisis that these countries faced and the limited capacity of other policies to support growth. History tells us that recovering from a financial crisis is an especially long and painful process, and more so if other countries are in the same boat.
The direct effect of this unprecedented monetary easing has been to lower whole yield curves to extraordinarily low levels, and that process is continuing. The most pronounced effects can be seen in Europe. If one were to invest in German government debt for any duration short of nine years, one would be paying the German government to take one’s money. The same can be said for Swiss government debt. Even some corporate debt in Europe has traded at negative yields. It seems likely that these European developments are also affecting long-term interest rates in the United States.
These ultra-easy monetary policies have helped along the process of balance sheet repair, bringing households and businesses closer to the point where they can start to spend and hire and invest again. And, it has to be observed, it has made fiscal constraints on governments much less binding than they would otherwise have been. Lower interest rates also increase the value of assets that can be used as collateral. Banks’ willingness to supply credit is affected by their balance sheet’s strength, of course, but it seems to be improving even in Europe at present. For larger businesses with access to capital markets, borrowing terms have probably never been more favourable.
Such policies are, then, working through the channels available to them to support demand. But these channels are financial in nature. They don’t directly create demand in the way that, for example, government fiscal actions do. They work on the incentives for private savers, borrowers and investors to alter their financial behaviour and, it is hoped in time, their spending behaviour.
A striking feature of the global economy, according to World Bank and OECD data, is the low rate of capital investment spending by businesses. In fact, the rate of investment to GDP seems to have had a downward trend for a long time.
One potential explanation is that there is a dearth of profitable investment opportunities. But another feature that catches one’s eye is that, post-crisis, the earnings yield on listed companies seems to have remained where it has historically been for a long time, even as the return on safe assets has collapsed to be close to zero (Graph 2). This seems to imply that the equity risk premium observed ex post has risen even as the risk-free rate has fallen and by about an offsetting amount. Perhaps this is partly explained by more sense of risk attached to future earnings, and/or a lower expected growth rate of future earnings.
Graph 2
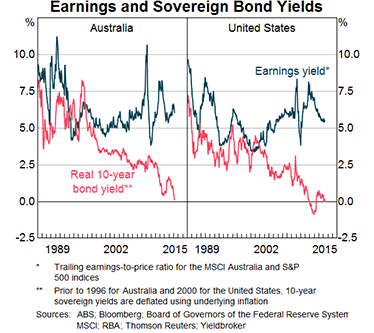
Or it might be explained simply by stickiness in the sorts of ‘hurdle rates’ that decision makers expect investments to clear. I cannot speak about US corporates, but this would seem to be consistent with the observation that we tend to hear from Australian liaison contacts that the hurdle rates of return that boards of directors apply to investment propositions have not shifted, despite the exceptionally low returns available on low-risk assets.
The possibility that, de facto, the risk premium being required by those who make decisions about real capital investment has risen by the same amount that the riskless rates affected by central banks have fallen may help to explain why we observe a pick-up in financial risk-taking, but considerably less effect, so far, on ‘real economy’ risk-taking.
Potential Vulnerabilities
Whether this is best seen as a temporary increase in risk aversion, a genuine dearth of investment opportunities, evidence of monetary policy ‘pushing on a string’, a portent of secular stagnation, or just unusually long lags in the effects of policy, will probably be debated for some time yet. I don’t pretend to know what that debate may conclude.
In the meantime, we have to think about some of the vulnerabilities that may be associated with the build-up of financial risk-taking. This is one of the responsibilities of the Financial Stability Board, particularly (though not only) through its Standing Committee on Assessment of Vulnerabilities. Two factors stand out at present as potentially combining to heighten fragility at some point. The first arises from the sheer extent and longevity of the search for yield.
As I have noted, compensation in financial instruments for various risks is very skinny indeed. Investors in the long-term debt of most sovereigns in the major countries are receiving very little – if any – compensation for inflation and only minimal compensation for term. Some model-based decompositions of bond yields suggest that term premia on US long-term debt and some sovereign debt in the euro area are actually negative. Compensation for credit risk is also narrow in many debt markets.
Moreover, because the search for yield is a global phenomenon, considerable amounts of capital have flowed across borders. There is some evidence to suggest that as emerging country bond markets have developed, particularly in Asia, more issuers have been able to raise funds in their local currencies. This leaves the foreign exchange risk associated with the capital flows more with the investor rather than a local bank or corporate, which is a good development. Nonetheless, we don’t have full visibility of those risks and there has been a notable build-up of debt overall in some emerging markets.
The other factor of importance is a set of structural changes in capital markets, where there are two key features worth noting. One is the expanding role of asset managers. The search for yield, and the general tendency since the crisis for some intermediation activity to migrate to the non-bank sector, has resulted in large inflows to asset managers since the crisis.
Yet liquidity – the ability to shift significant quantities of assets in a short period without large price movements – has probably declined, which is the second of the structural changes worth noting. Certainly the willingness of banks and others to act as market-makers in the way they did in the past will have diminished considerably. Now, of course, to some extent this is a result of the changes to financial regulation which have aimed to improve the robustness of the financial system. We should be clear that it was intended that the cost of liquidity provision in markets be more fully borne by investors. Liquidity was under-priced prior to the crisis.
Nonetheless, the question is whether end-investors truly appreciate that the availability of liquidity in the system has declined. Good asset managers have sufficient liquidity holdings to meet redemptions that may occur over any short time period and will also offer appropriate redemption terms and so pose only limited risks to the broader financial system. But the cost of holding the most liquid assets in a world of very low returns overall may pressure some asset managers to hold less genuine liquidity than they might otherwise. Meanwhile, the amount of client funds being managed is much larger than it was and we don’t know how all those investors will behave in a more stressed environment, should one eventuate. A key concern the official sector has is that investors may be assuming a degree of liquidity that will not actually be available in a more stressed situation.
Putting all that together, we find a world where the banking system is much safer, but in capital markets some valuations are stretched, credit spreads are compressed, there has been significant cross-border capital flow and liquidity may be less available than investors are assuming. That raises the risk that a sell-off, were it to occur, could be abrupt.
What might trigger such an event?
The usual trigger people have in mind is a rise in US interest rates. The US economy now looks strong enough for the Federal Reserve to consider increasing its policy rate later in the year. In itself, this should be welcomed. And it will have been very well telegraphed. Understandably, the Fed is proceeding with the utmost caution. But it will also have been over nine years since the Fed previously raised interest rates. Some market participants won’t have lived through a Fed tightening cycle before. Hence, it would not be surprising to see some bumps along this road.
A second trigger could come from slower growth in emerging markets. Growth has already weakened in some economies, several of which have been bruised by falling commodity prices. Capital that flowed into emerging markets could flow out again, perhaps when interest rates begin to rise in the United States. That would probably occur alongside an appreciating US dollar. So the distribution of credit risk and foreign currency risk will be of considerable importance. One can easily see why investors could become less forgiving of borrowers on a shaky footing, be they corporates or sovereigns.
A complicating factor here is that the rise in US interest rates looks set to occur while the central banks of Japan and Europe are continuing an aggressive easing of monetary policy via balance sheet measures. The combined Japanese and European ‘QE’ will be very substantial. The extent to which such funds will flow across borders will depend on which sorts of investors are ‘displaced’ from their sovereign debt holdings and what their risk appetites are. To the extent that funds do flow across borders, the proportions in which they flow to emerging markets, as opposed to the United States, will also be important.
So there is a fair bit that we don’t know, but need to learn, about this environment. It will be important for the officials thinking about these and other risks to continue an effective dialogue with private market participants over the period ahead.
Australia
These major global trends have certainly affected financial and economic conditions in Australia. We see the effects of the search for yield all around us. Short and long-term interest rates are at record lows, but are still attractive to some international investors. Foreign capital has been attracted not just to debt instruments but to physical assets. The demand for commercial property has been particularly strong and meant that prices have risen even as rental income has softened and the outlook for construction seems reasonably subdued. That raises some risks, which we discussed in our recent Financial Stability Review.[1]
We also noted the attention being given by APRA (Australian Prudential Regulation Authority) and ASIC (Australian Securities and Investments Commission) to risks in the housing market. APRA has announced benchmarks for a few aspects of banks’ housing lending standards and both APRA and the Reserve Bank will be monitoring the effects of these measures carefully; at this stage, it is still too early to judge them. We can only say that over the past few months, the rate of growth of credit for housing has not picked up further.
Overall, we think the Australian financial system is resilient to a range of potential shocks, be they from home or abroad. Banks’ capital positions are sound and are being strengthened over time. They have little exposure to those economies that are under acute stress at present. Measures of asset quality – admittedly backward-looking ones – have been improving.
But it is developments in the ‘real’ sector of the economy that, right at the minute, seem more in focus. The economy is continuing to adjust to the largest terms of trade episode it has faced in 150 years. As part of that adjustment, there has been a major expansion in the capital stock employed in the resources and energy sector, accomplished by exceptionally high rates of investment. These are now falling back quickly, exerting a major dampening effect on demand. There has been a major cycle in the exchange rate, which is still under way. There has been considerable change to the structure of the economy. This all happened as the major economies encountered the biggest financial crisis in several generations, with its very long-lasting after effects, and which also had an impact on Australian attitudes to spending and leverage. To say there have been some pretty powerful, and disparate, forces at work is something of an understatement, even for a central banker.
At present, while growth in Australia’s group of trading partners is about average, and is higher than the rate of growth for the world economy as a whole, the nature of that growth is shifting. The growth in Chinese demand for iron ore, for example, has weakened at the same time that supply has been greatly increased, much of it from Australia. Iron ore prices are therefore falling and contributing to a fall in Australia’s terms of trade.
As the terms of trade fall, and national income grows more slowly than it would have otherwise, adjustment is occurring in several ways:
- Incomes of those directly exposed to the resources sector, be it as employees, owners or service providers, are reduced.
- Nominal wages generally are lower than otherwise.
- The Australian dollar has declined and will very likely fall further yet, over time. This is one of the main ways that the lower national income is ‘transmitted’ to the population: purchasing power over foreign goods and services is reduced. At the same time, Australians receive some price incentives to substitute towards domestically produced goods and services. And the purchasing power of foreigners over the value added by Australian labour and capital is higher than otherwise.
- Saving by households, which rose when the terms of trade rose, is tending to decline as the terms of trade fall. This is a natural response to lower income growth and is being reinforced by easier monetary policy, which has reduced the return on safe financial assets. That said, the fact that many households already carry a considerable debt burden means that the extent to which they will be prepared to reduce saving to fund consumption may be less than it once was. More on this in a moment.
- As part of the same adjustment, government saving is increasing more slowly (more accurately, government dis-saving is lessening more slowly) than otherwise. This is more or less automatic to the extent that lower commodity prices directly reduce state and federal government revenues. More generally, the more reluctant households are to lower their saving and increase their spending the harder the government may find it to increase its saving.
Macroeconomic policy is supporting the adjustment. On the fiscal front, the government has little choice but to accept the slower path of deficit reduction over the near term. But over the longer term, hard thinking still needs to occur about the persistent gap we are likely to see (under current policy settings) between the government’s permanent income via taxes and its permanent spending on the provision of good and services.
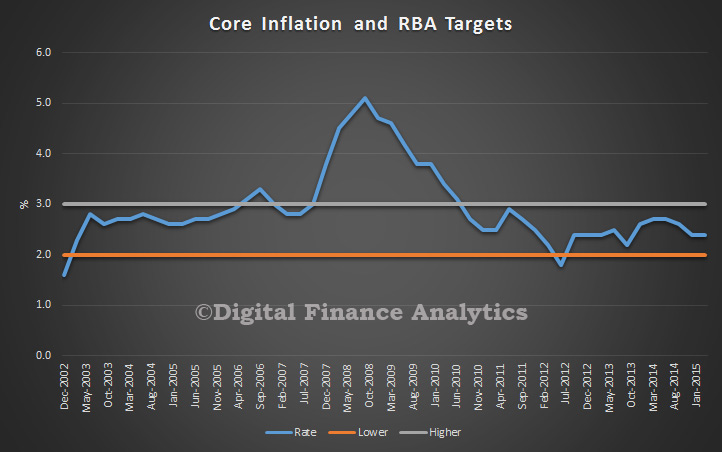
In the case of monetary policy, the Reserve Bank has been offering support to demand, consistent with its mandate as expressed by the medium-term inflation target. Relevant considerations of late include the fact that output is below conventional estimates of ‘potential’, aggregate demand still seems on the soft side as resources investment falls sharply, and unemployment is elevated and above most estimates of ‘natural rates’ or ‘NAIRUs’. And inflation is forecast to be consistent with the 2–3 per cent target. So interest rates should be quite accommodative and the question of whether they should be reduced further has to be on the table.
What complicates the situation is that these are not the only pertinent facts. A good deal of the effect of easier monetary policy comes via the housing sector – through higher prices, which increase perceived wealth and encourage higher construction, through higher spending on durables associated with new dwellings, and so on. These are not the only channels but, according to research, together they account for quite a bit of the direct effects of easier monetary policy. And they do appear to be working, thus far. Housing starts will reach high levels this year and wealth effects do appear to be helping consumption, which is rising faster than income.
But household leverage starts from a high level, having risen a great deal in the 1990s and early 2000s. The extent to which further increases in leverage should be encouraged is not easily answered, but nor can it be conveniently side-stepped. Even if we chose to ignore it, monetary policy’s ability to support demand by inducing households to bring forward spending that would otherwise be done in future might well turn out to be weaker than it used to be. For a start, households already did a lot of that in the past and, in any event, future income growth itself looks lower than it did a few years ago.
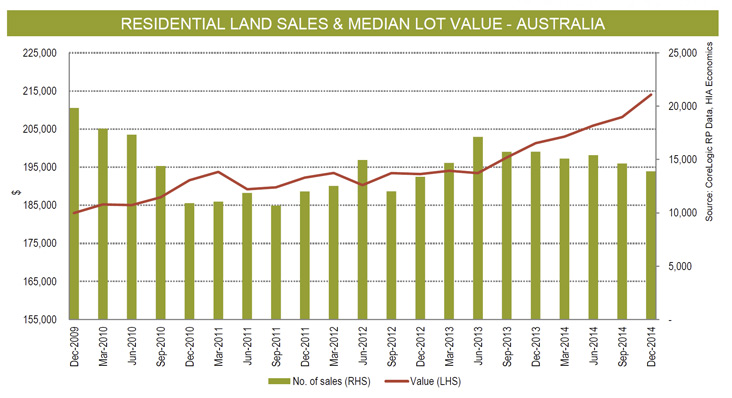
Then there are dwelling prices, which, at a national level, have already risen considerably from their previous lows, at a time when income growth has been slowing. Popular commentary is, in my opinion, too focused on Sydney prices and pays too little attention to the more disparate trends among the other 80 per cent of Australia. That said, it is hard to escape the conclusion that Sydney prices – up by a third since 2012 – look rather exuberant. Credit conditions are only one of several factors at work here. But credit conditions are very easy. So while the conduct of monetary policy can’t allow these financial considerations to dominate the ‘real economy’ ones completely, nor can it simply ignore them. A balance has to be found.
To this point, the balance that the Reserve Bank Board has struck has seen the policy rate held at what would once have been seen as extraordinarily low levels for quite a while now. The Board has, moreover, clearly signalled a willingness to lower it even further, should that be helpful in securing sustainable economic growth. The Board has been proceeding with a degree of caution that is appropriate in the circumstances. It also has, I would say, a realistic assessment of how much monetary policy can be expected to achieve in supporting the adjustment the economy needs to make.
Any help in boosting sustainable growth from other policies would, of course, be welcome. In particular, things that could credibly be seen as lifting prospects for future income, and increasing confidence in those prospects, would give easy monetary policy a good deal more traction.
In fact, that point generalises to the rest of the world. Across much of the world, too much weight is being put on monetary policy to try to achieve what it can’t: a durable and sustainable increase in growth, in an environment where private leverage is already rather high or even too high. Monetary policy alone won’t deliver that.
This is probably a moment to recall the commitments we all made in the G20 meetings in Australia last year, as we agreed on the goal of an additional rise in global GDP of 2 per cent over five years.
Those commitments were not actually about monetary policy; they were about other policies. It will be important this year, after one of the five years has passed, to see whether we are all making good on our various promises. More generally, actions which promote entrepreneurship, innovation, adaptation and skill-building, that reward ‘real’ risk-taking, while providing a stable macroeconomic environment and a well-functioning financial system, will best support our future wellbeing.



 Go here to request a copy.