Seasonally Adjusted Employment Data Not Reliable – ABS

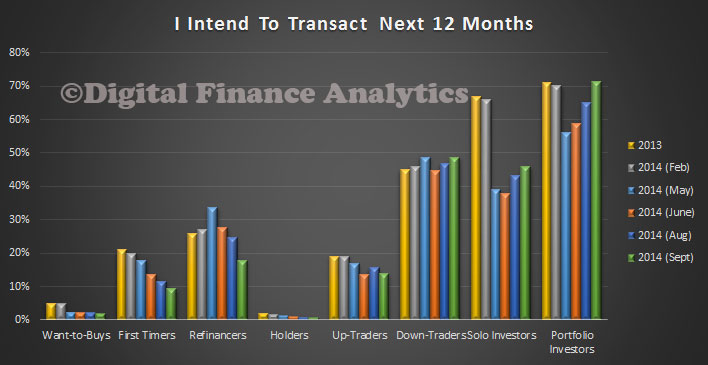
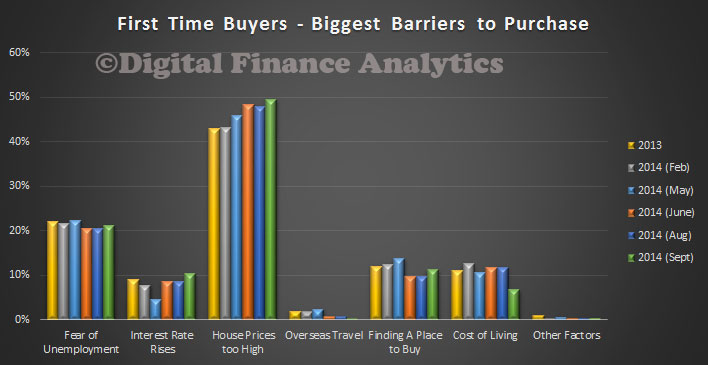
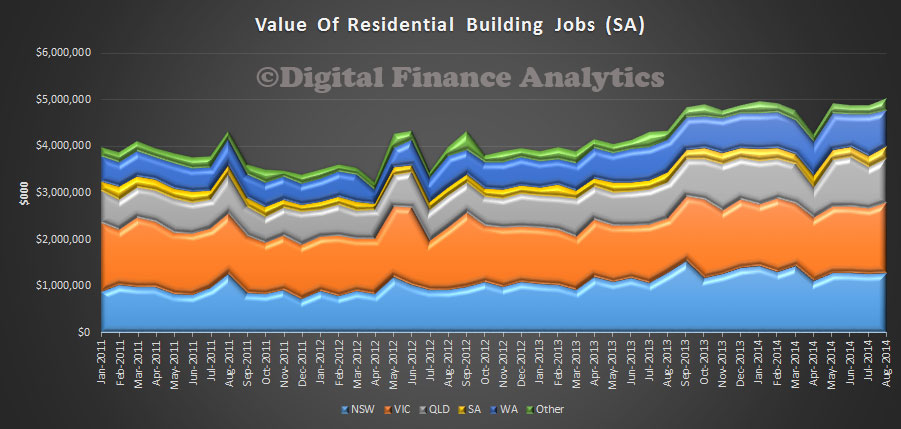
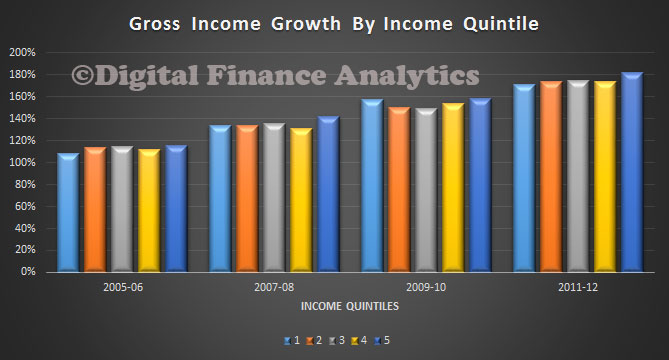
Today the ABS confirmed what we already knew, there was something weird about the employment data. When the last set came out, showing major and surprising movements, we highlighted the figures were probably not reliable. See the chart below.

UmeploymentAugust2014Now the ABS has said

The ABS has concluded that the seasonal pattern previously evident for the July, August and September labour force estimates is not apparent in 2014. This assessment was made while preparing labour force estimates for September 2014 and relates to all seasonally adjusted labour force estimates other than the aggregate monthly hours worked series.

As there is little evidence of seasonality in the July, August and September months for 2014, the ABS has decided that for these months the seasonal factors will be set to one (reflecting no seasonality). This means the seasonally adjusted estimates (other than for the aggregate monthly hours worked series) for these months will be the same as the original series and this will result in revisions to the previously published July and August seasonally adjusted estimates.

“It is critical that the ABS produces the best set of estimates that it can,” said acting Australian Statistician Jonathan Palmer “so that discussion is on what the estimates mean, and not the estimates themselves.

“To assist in this, the ABS will commission a review with independent external input to develop an appropriate method for seasonally adjusting October 2014 and following months’ estimates.

“The report on the results of this review will be presented in due course.”

The ABS has not made this decision lightly and believes this approach will result in a more meaningful set of seasonally adjusted estimates.

The ABS will continue to produce trend estimates and, as always, encourages users to use the trend estimates to help understand underlying movements in the labour force series.

This admission will increase the level of uncertainty about the accuracy of the data, at a time when unemployment and underemployment are set to remain high (as the IMF stated today). This is exacerbated by the recent cuts to the ABS budgets, making the sample smaller, and less reliable. We are flying somewhat blind at a time when good reliable data is essential if we are to chart a path through current uncertainties. Or maybe the inconvenient truth about rising unemployment will be muted as a result, and this was not entirely without intent.

Ireland Joins The Macroprudential Bandwagon

In the paper released by the Central Bank of Ireland, it is clear they have gone macroprudential! According to the Irish Times new rules will be applied to mortgage lenders in Ireland from 1 January 2015. A 2 month consultation period now starts, so they may get tweaked before implementation. The UK had announced parallel measures earlier.

New mortgage rules published today mean that most house buyers will have to have a 20 per cent deposit when applying for a home loan. The regulations come into force on January 1st.

The Central Bank is proposing that no more than 15 per cent of all new mortgages for private dwelling homes should have a loan to value (LTV) ratio above 20 per cent. This means that most first-time buyers are now going to be expected to have at least a 20 per cent deposit when buying a home.

In addition, it has also decided that just one-fifth of new mortgages should be issued above a level of three and a half times income (LTI).

In the case of buy-to-let properties, no more than 10 per cent of the value of all new loans should have an LTV above 80 per cent.

The Central Bank’s deputy governor said these measures should help to avoid another property crash in Ireland and dampen the rate of price rise currently being experienced in the market.

“Our research has shown there is strong evidence that mortgage losses are much higher where borrowers have a high LTV or LTI rate,” he said. “We believe that measures such as these are a standard part of a well regulated financial system and introducing these precautionary measures should contribute to a stable and well-functioning mortgage lending market.”

The regulator said the income caps would be “more binding” than the LTV ratios in a period of boom as pay levels could never keep pace with soaring property prices.

The LTV caps are not “completely counter-cyclical” as loan values will rise in line with property prices.

Certain exemptions are proposed to the new rules. These cover residual debt from home loans in negative equity, switcher mortgages, and home loans in arrears. Buy-to-let borrowers will also be exempt from the income restrictions.

Here is the Economist’s comparison chart, showing UK, Ireland and Australia – and we thought we had a problem!

EconomistIrelandOct2014

IMF On Macroprudential – It Works!

In the just release IMF World Economic Outlook, as well as revising down growth estimates, they discuss macroprudential, highly relevant in the light of RBA comments. The main observations are:

  1. there is evidence that macroprudential can assist in manage house price growth, and credit growth. Different settings should be applied to different types of purchases, e.g. differentiate first time buyers from multiple investors, but
  2. it is less effective if the cause of extended price rises stems from overseas investors, who bypass local controls and credit policy, so specific separate measures may need to be used to target foreign investors
  3. need to make sure business is not simply redirected to the non-bank sector, and
  4. supply side issues also need to be addressed.

RBA please note! The comments in full from the IMF are below, and worth a read. In particular they cite a number of success stories, so macroprudential is perhaps more proven than many would like to admit.

Many countries—particularly those in the rebound group—have been actively using macroprudential tools to manage house price booms. The main macroprudential tools employed for this purpose are limits on loan-to-value ratios and debt-service to-income ratios and sectoral capital requirements. Such limits have long been in use in some economies, particularly in Asia.

IMFSurveyMacroPrudOct2014For example, Hong Kong SAR has had a loan-to-value cap in place since the early 1990s and introduced a debt-service-to-income cap in 1994. In Korea, loan to-value limits were introduced in 2002, followed by debt-service-to-income limits in 2005. Recently, many other advanced and emerging market economies have followed the example of Hong Kong SAR and Korea. In some countries, such as Bulgaria, Malaysia, and Switzerland, higher risk weights or additional capital requirements have been imposed on mortgage loans with high loan-to-value ratios. Empirical studies thus far suggest that limits on loan-to-value and debt-service-to-income ratios have effectively cooled off both house price and credit growth in the short term.

Implementation of these tools has costs as well as benefits, so each needs to be designed carefully to target risky segments of mortgage loans and minimize unintended side effects. For instance, stricter loan-to value limits can be applied to differentiate speculators with multiple mortgage loans from first-time home buyers (as in, for example, Israel and Singapore) or to target regions or cities with exuberant house price appreciation (as in, for example, Korea). Regulators also should monitor whether credit operations move toward unregulated or loosely regulated entities and should expand the regulatory perimeter to address the leakages if necessary. For example, when sectoral macroprudential instruments are used to limit mortgage loans from domestic banks, they can be circumvented through a move to nonbanks (as in, for example, Korea) or foreign banks or branches (as in, for example, Bulgaria and Serbia). Macroprudential tools may also not be effective for targeting house price booms that are driven by increased demand from foreign cash inflows that bypass domestic credit intermediation. In such cases, other tools are needed. For instance, stamp duties have been imposed to cool down rising house prices in Hong Kong SAR and Singapore. Evidence shows that this measure has reduced house demand from foreigners, who were outside the loan-to-value and debt-service-to-income regulatory perimeters. In other instances, high house prices could reflect supply bottlenecks, which would need to be addressed through structural policies such as urban planning measures.


RBA Leaves Rates On Hold, Again

At its meeting today, the Board decided to leave the cash rate unchanged at 2.5 per cent.

Growth in the global economy is continuing at a moderate pace. China’s growth has generally been in line with policymakers’ objectives, though some data suggest a slowing in recent months. Weakening property markets there present a challenge in the near term. Commodity prices in historical terms remain high, but some of those important to Australia have declined further in recent months.

Volatility in some financial markets has picked up in recent weeks. Overall, however, financial conditions remain very accommodative. Long-term interest rates and risk spreads remain very low. Markets still appear to be attaching a low probability to any rise in global interest rates or other adverse event over the period ahead.

In Australia, most data are consistent with moderate growth in the economy. Resources sector investment spending is starting to decline significantly, while some other areas of private demand are seeing expansion, at varying rates. Public spending is scheduled to be subdued. Overall, the Bank still expects growth to be a little below trend for the next several quarters.

Labour market data have been unusually volatile of late. The Bank’s assessment remains that although some forward indicators of employment have been firming this year, the labour market has a degree of spare capacity and it will probably be some time yet before unemployment declines consistently. Growth in wages has declined noticeably and is expected to remain relatively modest over the period ahead, which should keep inflation consistent with the target even with lower levels of the exchange rate.

Monetary policy remains accommodative. Interest rates are very low and have continued to edge lower over recent months as competition to lend has increased. Investors continue to look for higher returns in response to low rates on safe instruments. Credit growth is moderate overall, but with a further pick-up in recent months in lending to investors in housing assets. Dwelling prices have continued to rise over recent months.

The exchange rate has declined recently, in large part reflecting the strengthening US dollar, but remains high by historical standards, particularly given the further declines in key commodity prices in recent months. It is offering less assistance than would normally be expected in achieving balanced growth in the economy.

Looking ahead, continued accommodative monetary policy should provide support to demand and help growth to strengthen over time. Inflation is expected to be consistent with the 2–3 per cent target over the next two years.

In the Board’s judgement, monetary policy is appropriately configured to foster sustainable growth in demand and inflation outcomes consistent with the target. On present indications, the most prudent course is likely to be a period of stability in interest rates.

This was in line with expectation, despite some calling for a rise to signal the markets in relation to speculative housing. However, these ultra-low rates cannot last for ever, and the average mortgage rate is closer to 7% rather than the current 4.75%.

RateTrend


SMSF Property Investment Continues – DFA Survey

We updated our household surveys with the September data. Today we focus in on SMSF property transactions, which is a small, but rising factor in the market. We start by looking at the reason why trustees for SMSF’s are considering retail property. The strongest incentives are the tax efficient nature of the investment, and appreciating property values. Low rates also have  part to play. I have excluded commercial property from the analysis.

SMSFPropertyTransactSept2014We also asked where the trustees were getting advice from regarding retail property investment. Most interesting is a fall in advice from financial planners (maybe a reaction to FOFA, CBA etc?), and a rise in advice from real estate agents. Mortgage brokers also figure in the mix, alongside internet sources and own knowledge. We wonder how well qualified these sources are to provide the right advice, bearing in mind the long term nature of super.

SMSFAdvisorSept2014Finally, we looked at changes in relative distribution of property in super funds, and of those who were investing in property (about 3% of all funds are investing in retail property, and another 3% are considering it). We see retail property making up quite a significant share of superannuation savings for some. The blue bar is last year, the orange bar is to September 2014.SMSFPropertySept2014Others can decide if this a good or bad thing, but it does highlight the linkages between property and super, and demonstrates that if house prices fall, then some super funds will be impacted, just at the time house valves are also falling. The impact of the double whammy is potentially significant and concerning.

RBA Comments On Housing Have Impact – DFA Survey

We have updated our household surveys with the results for September. This forward-looking research revealed some significant changes in sentiment amongst households thinking of transacting, and many of these changes can be traced to recent comments made by the RBA in respect of investment housing. Our approach to household segmentation and our surveys is described in an earlier post.  Today we will discuss some of the most important recent findings, which updates the results from our Property Imperative report.

So first we look at which segments are most likely to transact in the next 12 months. The changes over time are significant, with first time buyer ever less likely to purchase whilst investors, especially portfolio investors, more likely to buy. The impact of down-traders (remember there are more than one million households in this category) are also significant.

Transact12MonthsSept2014Demand for mortgage funding sits firmly with certain segments, especially investors, first time buyers and up-traders. Note that the bulk of down-traders do not need to borrow. This goes some way to explaining why house prices are moving faster than loan growth, and why investment loans are making up a large proportion of lending, especially in Sydney.

BorrowMoreSept2014We found that first time buyers are still saving hard, though chasing ever higher prices, want-to-buys are saving less now, seeing the aspiration of owning a property evaporating fast.

SeekingtoBuySept2014We found that across the board, there was a little less certainty on house prices growth, though generally investors remain more bullish.

HousePriceRisesSept2014The want-to-buys find the biggest barrier relates to the high price of housing. No change here.

WantToBuysSept2014This barrier is also echoed in the first time buyer segment, with 50% seeing price as the main issue, the highest result in recent times.

FTBuyersSept2014Many refinancers will have now locked in at low rates, as the main reason is to reduce monthly outgoings. The proportion locking in at fixed rates is down a little.

RefinanceSept2014We found that up-traders are still active, and there was an increase in those in this segment who are motivated by the prospect of capital appreciation, which is now running ahead, just, of buying to get more space. As shown above, the proportion of up-traders ready to transact is down a little.

UptradersSept2014Down-traders continue to seek to sell and buy smaller, driven by a quest to release capital for retirement, and for increased convenience. They were slightly more likely to incorporate an investment property in their strategy. We think the impact of down-traders on the market is understated by many observers, but the continuing release of capital from larger property, and buying smaller, plus investment, aligns with the growth in investment property demand, and yet lower rates of financing elsewhere.

DownTradersSept2014Looking at investors, we see continued interest, driven by the tax-efficient nature of investment lending (a.k.a negative gearing, and SMSF investing). They remain confident about capital appreciation into the future, though less strongly than previously.

InvestorsSept2014Finally, we looked at the potential barriers to investors, and we see a significant change. We ask about a range of barriers. One related to RBA warning, which this month have reach a new, high pitch. Investors are responding, and a proportion are concerned about potential regulatory changes. We also saw a tick up in the concerns about interest rates rising in coming months.

InvestorBarriersSept2014Overall then we still see demand strong, and focused in particular segments, especially investors and down-traders. However, the RBA warning are having an impact, even before they actually do anything to intervene further in the market. We do not believe that words alone will address the underlying systemic issues, but they can have a short term impact on sentiment, and may make some prospective purchasers think again – we therefore expect to see some small slowdown in coming weeks. That said, the market remains hot, and stoked by investors, and we believe there is a case for more direct intervention by the regulators. We also expect the RBA to keep up the verbal barrage.

More Units Help Drive Building Approvals Higher – ABS

The ABS released their building approvals data to August 2014. The number of dwellings approved rose 1.2 per cent in August 2014, in trend terms, and has risen for three months.

Dwelling approvals increased in August in the Australian Capital Territory (13.0 per cent), Northern Territory (8.8 per cent), Queensland (2.7 per cent), South Australia (0.9 per cent), Victoria (0.6 per cent), Western Australia (0.5 per cent) and New South Wales (0.4 per cent) but decreased in Tasmania (4.3 per cent) in trend terms.

In trend terms, approvals for private sector houses were flat in August. Private sector house approvals rose in New South Wales (1.8 per cent) and Queensland (0.8 per cent), but fell in South Australia (2.9 per cent), Western Australia (0.8 per cent) and Victoria (0.5 per cent).

PrivateSectorDwellingsAugust2014The trend estimate for private sector dwellings excluding houses rose 3.1% in August and has risen for three months. The seasonally adjusted estimate for private sector dwellings excluding houses rose 9.6% in August and has risen for two months. Units account for more than 50% of approvals in NSW, whereas in WA, it is about 23%.

PCUnitsAugust2014The value of total building approved rose 0.8 per cent in August, in trend terms, and has risen for two months. The value of residential building rose 1.4 per cent while non-residential building fell 0.5 per cent in trend terms. The seasonally adjusted estimate of the value of total building approved rose 0.5% in August following a fall of 10.9% in the previous month. The value of residential building rose 3.0% and has risen for two months. The value of non-residential building fell 4.5% and has fallen for two months.

ValueBuildingWorkAugust2014

Household Income Trends Show Strongest Growth At The Top

The ABS today released their Distribution of Household Income, Consumption and Wealth data for the years from 2003 to 2012.   According to the ABS, the average gross disposable income of Australian households grew 58 per cent in the period 2003-04 to 2011-12. However, the highest income quintile grew at a rate above average, at 62 per cent. All other income quintiles grew above 50 per cent , but below the average rate of 58 per cent. We see that older Australian’s income has been growing faster than younger ones.

GrossIncomesBy-AgeBandsThe relative share of gross income is gravitating towards older households. This is a function of the growing number of older households, thanks to the demographic shifts, and the fact they hold the lions share of investments yielding income.

RelativeShareGrossIncomesBy-AgeBandsWe can also look across the income quintiles (20% bands). We see stronger income growth in the higher income groups. This is stated in perecentage terms, but in doller terms the relative amounts are significant.

GrossIncomesPCQuintilesWe can see that growth in incomes for the richest quintile is stronger than the lower ones.

GrossIncomesQuintilesThe ABS says growth in wages and salaries was by far the largest contributor to this increase, except for the lowest income quintile, where social assistance benefits were the largest contributor to their income growth.

This is an important data-set and is the first time data for household groups has been released under the framework of the national accounts. We can look at which household groups are driving the growth in income, consumption, savings and wealth in the national accounts.

For example, households with two adults and dependent children were responsible for about one-third of the growth in household gross disposable income.

Households where the reference person was aged 35 to 44 years had an increase in income tax of $9,000 – with their payments going from $17, 000 in 2003-04 to $26,000 in 2011-12 – which was above the average increase of $4,500.

Of course this data stops in 2012, so we cannot yet see the impact of falling incomes in real terms, which we have discussed previously.

RBA Highlights Housing Supply Issues And Lending Regulation

The RBA made a statement today to the Inquiry into Affordable Housing. Several points to note:

1. They recognise the high price to income ratio we currently have, but also state that low rates make larger mortgages affordable.

  • the ratio of housing prices to incomes is at the top of its historical range; but
  • over time, this has been more than offset by falls in financing costs, so that the typical repayment burden as a share of income is not particularly high. This of course does not rule out affordability problems in particular market segments or for particular types of households.

The recent data from the Economist shows the relative data of prices against average income in different countries.EconomistAug2014-IncomeTrend2000s

2. Supply of mortgages is not a constraint

there is no shortage of housing finance in Australia. Housing loan interest rates are currently as low as they have been in a generation, and households are not artificially constrained from borrowing as much as they can reasonably be expected to repay. I have already made the point that perceptions of affordability will differ across different types of households; but, if there is a perceived affordability problem in Australia, it is not due to a lack of finance.

3. There are property supply problems

It is the supply response that determines the extent to which additional demand results in higher prices over time. Our submission highlights that Australia faces a number of longstanding challenges in this area, including regulatory and zoning constraints, inherent geographical barriers and the cost structure of the building industry. There are also obstacles to affordable housing created by Australia’s unusually low-density urban structure, though this is gradually changing.

4. Lending practice reinforcement and other measures are on the cards

the Bank said in its Financial Stability Review last week that the composition of housing and mortgage market activity is becoming unbalanced. The review also indicated that we are discussing with APRA steps that might be taken to reinforce sound lending practices, particularly for investor finance, though not necessarily limited to that.

I want to emphasise that the banks in Australia are resilient, and mortgage lending in this country has historically been relatively safe. APRA has, however, noted a trend to riskier lending practices, and over the past couple of years has been seeking to temper these through its supervisory activities. There are also broader concerns with the macroeconomic risks associated with excessive speculative activity, since this activity can amplify the property price cycle and increase risks to households.

Our discussions with APRA and other agencies on these matters are ongoing, and there will be more to say about them in due course

FOFA Survives

Last night in the Senate, the plans to disallow significant portions of the Government’s Future of Financial Advice (FOFA) reforms were blocked by a majority of two votes. The amendments were saved with support from the Palmer United Party, Motoring Enthusiast Party, Family First and Liberal Democratic Party cross-benchers. So the latest iterations of the Future of Finance Reforms stands.

The more recent changes tweaked the wording such that advisors providing general advice (a.k.a) product sales advice cannot directly receive commissions. However, it remains quite feasible for advisors and other customer facing staff to be remunerated against a set of performance targets such as number of products sold against a target. This plays into the hands of the larger banks who control most financial advisors.

As a result, it seems that consumers will need to be watchful that product sales could be dressed up as advice. We discussed the FOFA issue in some detail recently.

The right answer would have been to dispense with general advice altogether, so that consumers could either receive clear financial advice, for which no commissions or other payments should be made; or product sales advice, when commissions and other financial incentives should be openly declared.

FOFA is still a pig’s ear. The majority of consumers seeking investment advice will be older (see the chart below), and there is a risk of undue influence from advisors and others who offer sales advice in the guise of general advice.

HSR4