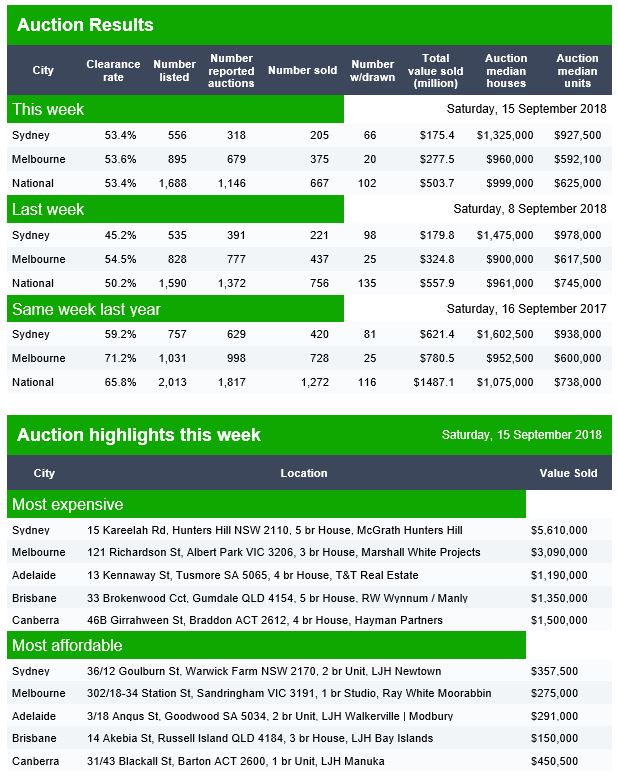
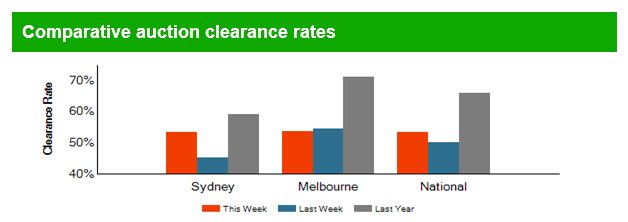
The national clearance rate once again settled last week at around 50%, with Melbourne a little stronger than Sydney, but with a high proportion of properties withdrawn, so little meaning in the lower numbers, when compared with a year ago.
Today’s results also look weak, little sign of a spring bounce as yet.
Brisbane listed 105, reported 56 and sold 26, with 3 withdrawn. Domain estimates a 43% clearance rate.
Adelaide listed 59, reported 33 and sold 20, with 9 withdrawn. Domain estimates a 48% clearance rate.
Canberra listed 73, reported 60 and sold 41, with 2 withdrawn. Domain reported a clearance rate of 66% – the highest in any of the reported centres. Another example of the Canberra bubble?
These will of course all settle lower as more data comes in.
Welcome to the Property Imperative weekly to 15th September 2018, our digest of the latest finance and property news with a distinctively Australian flavour.
Watch the video, listen to the podcast or read the transcript.
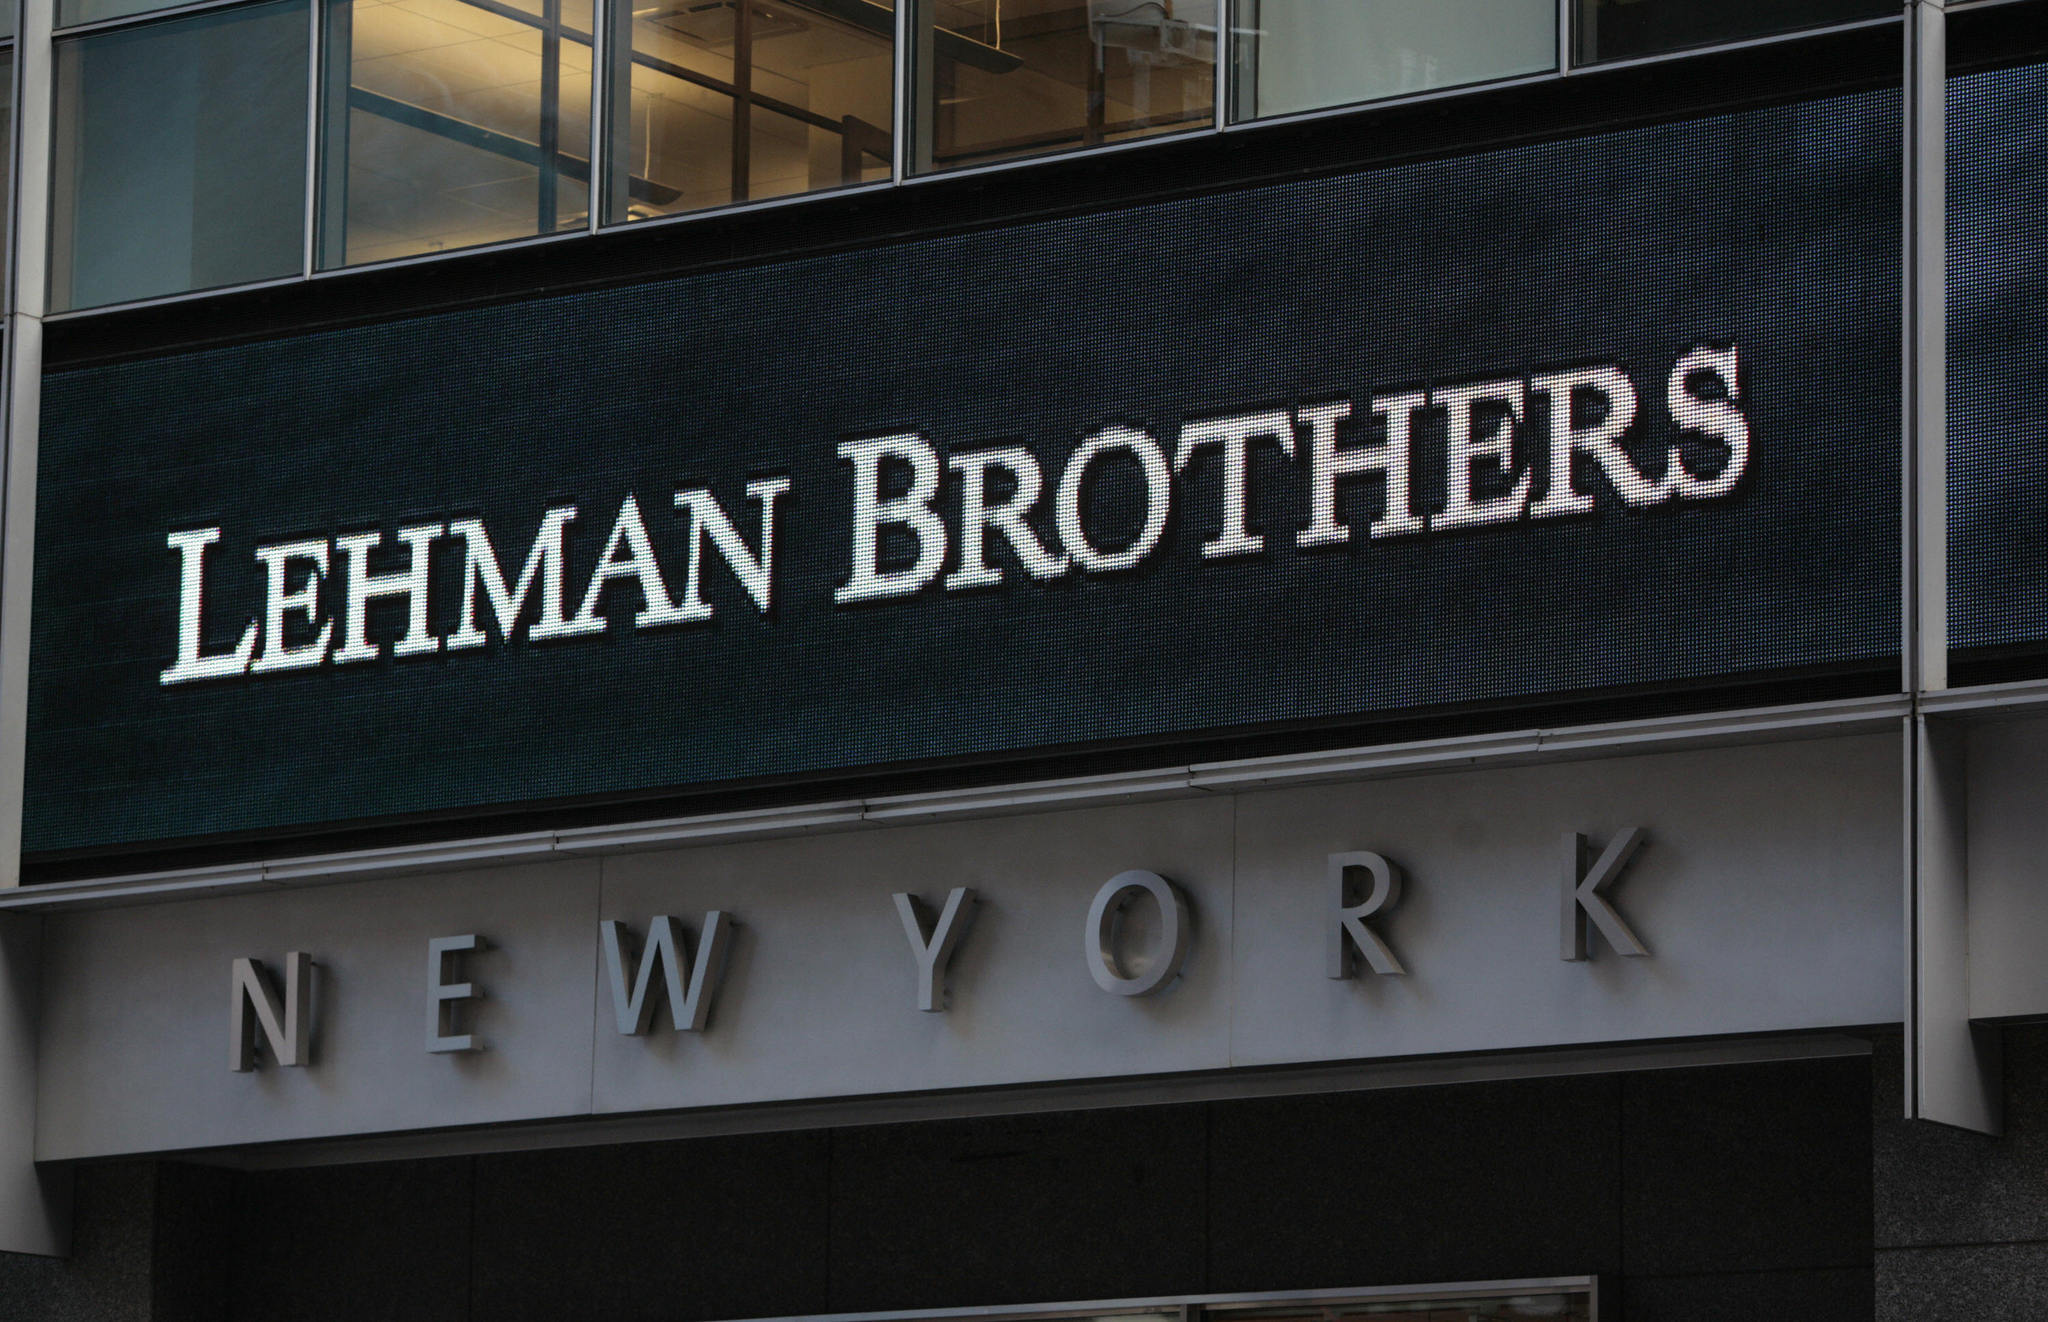
On the 10th Anniversary of the failure of Lehman Brothers, the consensus seems to be that the financial system is still stressed, under the impact of sky high global debt, artificially low interest rates and asset bubbles. The shadow is long, and the risks high. I discussed this on ABC Radio Sydney, and also in a Video Post with Robbie Barwick from the CEC. Perhaps of most concern is the lack of acceptance that we have a problem, with the RBA this week recognising that household debt is high, but declaring it manageable and the Housing Industry Association calling for a relaxation of lending standards to support housing construction. That is in my view the last thing we need. The truth is, pressures on households, and tighter lending standards mean more price falls will follow. Those who follow my analysis will know I run four scenarios, including the one, the worst case, where prices could drop 40-45% from their highs over the next few years. This is the angle which the upcoming 60 Minutes programme, to be aired tomorrow, Sunday is driving at.
Just remember this is one of four scenarios! But its rated a 20% probability now.
There was more evidence this week as to the issues under the hood. For example, Domain says that whilst housing affordability has improved in all capitals where property prices have started to decline, the median multiple is still well above affordable housing thresholds in several capital city markets. They said that drawing on Domain price data and adjusted census income data, the change in price and the median multiple across capital city markets, since the respective peaks, was analysed.
While the house price to income ratio is a simple, standard indicator for understanding affordability — particularly across countries — it is far from comprehensive. Other affordability metrics still spell out tough times ahead for homeowners. Rental affordability, mortgage serviceability and the deposit hurdle are also vital considerations. But Domain says that as of June 2018, data shows the median income household in Sydney would require 59.8 per cent of weekly income to service an owner-occupied mortgage (assuming a 5.2 per cent variable rate on a loan-to-value ratio of 80 per cent). This is down from 64.4 per cent at the peak of the latest cycle
Another angle is credit scoring, as Banking Day called out, as the remaining three Big Four banks are reportedly getting ready to join NAB as participants in the new Comprehensive Credit Reporting regime. This means a massive database will share their customers’ full credit history with each other for the first time from the end of this month, at which point comprehensive credit reporting will be a foregone conclusion with the remaining major banks. The new data-sharing regime will allow lenders to better verify loan applications and assess credit risk by accessing the full repayment history of a potential customer, including their total debts. The major lenders have pushed ahead with the changes following pressure from the prudential regulator, The Australian reported, noting that ANZ said it had been testing positive data reporting since the end of June, although the data was not shared with the public at this stage. The big banks’ embrace of the new regime would put pressure on others to sign up, since only lenders who supplied comprehensive reporting to the credit bureaus would have access to the data, Australian Retail Credit Association chairman Mike Laing told The Australian. “If they don’t join then the people who intend to borrow money but not pay it back will quickly find out which ones are not in the system and they’ll go to the lenders who don’t have access to verifiable data. So it’s risky for a lender not to take part once most of the data is in there”.
And yet another angle. Between 2008 and 2012, the number of self-managed super funds grew by 27 per cent to nearly half a million. That was more than 40 per cent of the growth of the whole superannuation system. The global financial crisis coincided with the Howard government lifting the ban on superannuation funds borrowing money. As a result, self-managed super funds have rushed to take advantage and racked up $32 billion in debt in little more than a decade. The Financial System Inquiry in 2014 recommended that borrowing by superannuation funds be banned. It’s a view shared by Saul Eslake, the former ANZ Bank chief economist, who describes the decision to allow super funds to borrow as “the dumbest tax policy of the last two decades.” “The last thing Australians really needed in the last 20 years is yet another vehicle or incentive for Australians to borrow more money in order to speculate on property prices continuing to rise,” Mr Eslake said.
Overlaying that is the perennial problem of property spruikers trying to persuade people to borrow big to buy, and tip their newly acquired, heavily leveraged, property into a self-managed super fund. Super fund borrowing is known as “limited recourse” — which means if the fund can’t pay off the loan, the bank can’t go after any other assets — just the property in question. Remember this was at the heart of the sub-prime mortgage fiasco 10 years ago, which morphed into the global financial crisis. Whilst not wanting to be alarmist, Saul Eslake is concerned with what he’s seeing now in self-managed super funds with their limited recourse borrowing. “You might have thought that someone would have heard the term ‘limited-recourse borrowing’ and recognised that there were some significant risks associated with it that we could have done without in the Australian context.”
And CoreLogic Reported that the combined capital cities returned a final auction clearance rate of 55.3 per cent last week, a slight improvement on the 55 per cent over the week prior when volumes were lower. There were 1,916 homes taken to auction last week, up on the 1,748 held the previous week. While one year ago, a higher 2,258 auctions were held with a 66.9 per cent success rate.
Melbourne returned a final auction clearance rate of 60 per cent this week; an improvement not only over the week but the highest seen since May, with clearance rates for the city remaining within the mid-high 50 per cent range up until this week. The improved clearance rate was across a higher volume of auctions week-on-week, with 891 auctions held, increasing on the 805 held the week prior when 57 per cent sold.
Sydney’s final auction clearance rate came in at 50.6 per cent last week across 656 auctions, falling on the week prior when a 53.8 per cent clearance rate was returned and auction volumes were a similar 664.
As usual the performance across the smaller auction markets was mixed last week, with clearance rates improving in Adelaide, Brisbane and Canberra, while Perth’s final clearance rate fell.
The Gold Coast region was the busiest non-capital city region last week with 56 homes taken to auction, although only 26.4 per cent sold. Geelong was the best performing in terms of clearance rate with 88 per cent of the 34 auctions successful.
And this week, CoreLogic is tracking 1,882 capital city auctions this week. If we compare activity to the same week last year volumes are down 25 per cent on the 2,510 auctions held one year ago.
And finally, APRA released their quarterly property exposure data to June this past week. APRA release their quarterly property exposure lending stats for ADI’s today. There are some interesting data points, and some concerning trends and loosening of standards recently. I will focus on the new loan flows here. First the rise in loans outside serviceability continues to rise, now 6% of major banks are in this category a record, reflecting first tightening of lending standards, but second also their willingness to break their own rules! This should be ringing alarms bells. APRA?
Foreign Banks are writing the greater share (relative percentage) of 80-90% LVR loans. Other lenders tracking lower.
Foreign Banks are lending more 90+ LVR loans in relative percentage terms.
New investor loans are moving a little higher for Credit Unions and Major Banks, suggesting a growth in volumes.
The share of interest only loans dropped below 20% but is now rising a little, as lenders seek to grow their books.
All warning signs, especially when as APRA reports ADIs’ residential term loans to households were $1.62 trillion as at 30 June 2018. This is an increase of $86.6 billion (5.6 per cent) on 30 June 2017. Of these: owner-occupied loans were $1,076.4 billion (66.4 per cent), an increase of $76.7 billion (7.7 per cent) from 30 June 2017; and investor loans were $544.0 billion (33.6 per cent), an increase of $9.9 billion (1.9 per cent) from 30 June 2017. Debt is sky high, the grow rate must be slowed substantially – there are rumours of more tightening to come, we will see.
Looking at the local markets, the ASX 100 was down at the end of the week, ended up at 5,065.90, up 29.8 on the day, and it continues to underperform compared with the US markets. In the banking sector, NAB ended the week at 27.35, after they announced they would not follow the lead of Westpac, CBA and ANZ for now by not lifting their variable mortgage rates, for now. NAB closed up 0.18% on the day. ANZ, who it was announced with be subject to civil proceedings from ASIC for an alleged continuous disclosure breach in relation to a $2.5 billion institutional share placement undertaken by the ANZ in 2015. Their shares rose 0.32% on Friday to 28.15. CBA who took some further knocks this week thanks to further evidence of poor practice in CommInsure in the Banking Royal Commission, among others in the industry. They ended the week at 71.50, and up 0.45% today. And Westpac ended the week at 27.76 up 0.69% on Friday. Despite the relatively benign employment figures out this week, still at 5.3%, the Aussie ended the week at 71.54 and down 0.57% on Friday. The downward trajectory is clearly in play. This risks importing inflation into the local economy.
Looking across to the USA, many investors may be inclined to dismiss yet another headline on global trade and focus on the more granular aspect of the markets. But make no mistake, the markets were gyrating with the twists in the saga between the U.S. and its trading partners. The latest salvo came Friday, when Bloomberg reported that Trump instructed aides the day before to proceed with tariffs on about $200 billion more in Chinese products, but that the announcement has been delayed as the administration considers revisions based on concerns raised in public comments.
Earlier in the week, China had welcomed an invitation by the United States to hold a new round of trade talks. The Trump administration had invited Chinese officials to restart trade talks, the White House’s top economic adviser said on Wednesday. In addition to those tariffs, Trump has said he’s ready to add an additional $267 billion in tariffs “on short notice if I want.”
Earlier in the week, Beijing indicated it will ask the World Trade Organization for permission to impose sanctions on the U.S. as part of a dispute over U.S. dumping duties that China started in 2013.
And there’s still the revamp of NAFTA to consider. The U.S. and Canada have been in talks to bring Canada into a new agreement between the U.S. and Mexico, but there have been on announcements to far. Talks are expected to continue through Monday.
Beyond the US manufacturing sector – for example Boeing is still pretty strong, at 359.80, while Caterpillar ended down 0.44% to 144.90; the potential spill over into the consumer sector impacted a range of stocks, with Whirlpool down 1.68% to 123.21, Walmart down 0.56% to 94.59 and Mattel was up 1.49% to 16.35. Among the financials, Morgan Stanley was at 48.19, a little higher on the day, but still well down on March highs. The S&P 500 ended up 0.03% to 2904.98, as did the Dow Jones Industrial Average to 26,154, while the NASDAQ was down just a little to 8,010.
Apple got the type of promotional attention some companies can only dream of when the eyes of tech lovers and investors alike were glued to its keynote event for details on its new products, especially phones. Apple announced Wednesday its new iPhone product line. Shares of Apple rose the day before the event in anticipation of the kind of surprise announcement for which former CEO Steve Jobs was famous. The stock sold off as details about the new iPhones arrived and shares ended the day lower. But shares bounced back on Thursday, leading the overall tech sector higher, despite negative analyst commentary about the price of the iPhone XR. Apple ended the week down 1.14% to 223.84.
Bucking the recent trend that’s made investors nervous about price pressure, the latest data showed inflation cooling. First, figures showed wholesale prices fell unexpectedly. Producer price index decreased 0.1% last month. In the 12 months through August, the PPI rose 2.8%. Economists had forecast the PPI rising 0.2% last month and increasing 3.2% from a year ago. The core PPI decreased by 0.1% from a month earlier and rose 2.3% in the 12 months through August. Analysts had predicted core PPI to increase 0.2% month on month and 2.7% on an annualized basis.
Next, retail inflation rose less than anticipated. The consumer price index advanced 0.2%, missing expectations for a gain of 0.3%. In the 12 months through July, the CPI increased 2.7%, below forecasts for a reading of 2.8% and down from 2.9% in July. The core CPI increased by 0.1% from a month earlier, below forecasts for a gain of 0.2%. The annual increase in the so-called core CPI was 2.2%. Economists were looking for it to hold steady at July’s 2.4% advance. But despite these softer inflation numbers, traders ended the week still predicting a more-than-80% chance of the Federal Reserve hiking rates at its December meeting on top of the expected boost this month.
Bond yields rose sharply this week, owing to confidence that the Federal Reserve will lift rates for a total four times this year. The rise was particularly strong Friday, when the United States 10-Year yield topped 3% briefly. A big reason for that was Friday’s retail sales numbers.
The August retail sales numbers were disappointing at first blush, rising 0.1%, compared with expectations for 0.4%. But July’s gain was revised up to 0.7% from 0.5%. That revision gave market watchers some more confidence that the U.S. could see GDP growth of 4% in the third quarter, which would all but guarantee another rise in rates in December.
Gold ended the week lower at 1,198, down 0.82%, with preference for the US Dollar as a safe haven. And Copper fell 2.61%, well down on the start of the year, with demand slowing. Oil prices were higher to 69.00, up 0.60% on Friday, reflecting concerns about supply thanks to Hurricane Florence, and trade concerns. Of course, with the lower Aussie, this means fuel prices will rise further ahead.
Finally, Bitcoin is still making lower highs, even though the cryptocurrency has seen slightly higher lows. The key is going to be when bitcoin trades back above $7,000. There is a trend line connecting all the recent highs going back to early 2018. If BTC can bust above that level, it will likely take out the high at $7,350 and make a higher high. Once that happens, institutions may start buying heavily and upside could be back above $10,000 within months. That said, it ended the week down 1.15% to 6,488.
According to Bloomberg, Morgan Stanley plans to offer trading in complex derivatives tied to the largest cryptocurrency, according to a person familiar with the matter, joining other Wall Street firms in creating ways for clients to play the digital currency market. The U.S. bank will deal in contracts that give investors synthetic exposure to the performance of Bitcoin, said the person, who asked not to be identified because the information is private. Investors will be able to go long or short using the so-called price return swaps, and Morgan Stanley will charge a spread for each transaction, the person said. Citigroup is developing a new mechanism for trading cryptocurrencies known as digital asset receipts, a person with knowledge of the plans said earlier this month. Goldman Sachs is exploring derivatives on Bitcoin called non-deliverable forwards, and is considering a plan to offer custody for crypto funds.
Finally, today a couple of quick reminders, first the 60 Minutes programme tomorrow evening and our live stream event on Tuesday at 20:00 Sydney, where you can discuss with me the latest on the outlook for home prices, as well as all our other analysis. You can bookmark the event by using this link. I look forward to your questions in the live chat.
If you value the content we produce please do consider joining our Patreon programme, where you can support our ability to continue to make great content.
The approaching deadline for Euribor to become compliant with the EU Benchmark Regulation (BMR) is creating significant uncertainty for the euro-denominated floating rate assets and liabilities of structured finance transactions, covered bonds and banks, Fitch Rating says. If Euribor does not become compliant, the benchmark could no longer be used as a reference rate for new contracts from the start of 2020 and could only be used for legacy contracts with regulatory approval.
The Belgian Financial Services and Markets Authority is not expected to assess whether Euribor, which is in the process of being reformed, will become BMR compliant until late 2019. Euribor’s planned hybrid calculation method is being put in place with the aim of meeting the BMR requirements, but it is not yet clear if the change will result in compliance.
Various sectors could be affected if BMR compliance is not reached. Most eurozone structured finance notes reference Euribor, as do a substantial amount of covered bonds issued for repo transactions and euro-denominated bank debt. In contrast, corporate and public sector entities in the eurozone issue floating rate bonds to a lesser extent.
Euribor is also a common reference rate for leveraged and SME loans and commercial mortgages throughout Europe. Most residential mortgages in Finland, Greece, Ireland, Italy, Portugal and Spain are Euribor-based along with smaller proportions in other markets. Shifting to an alternative rate for contracts without long-term fall-back provisions could be particularly difficult given consumer protection laws.
If it does not become BMR compliant, the Belgian FSMA could allow Euribor to continue to be used in legacy contracts. It could also force bank panel participation for up to two years. This would allow some time for an alternative benchmark to be established and adopted by market participants. Work has begun on developing a term rate from a soon-to-be selected alternative euro risk-free rate to become a fall-back or possible replacement rate. But if the ECB’s new euro short-term rate (ESTER) is chosen as the favoured alternative, this two-year period could still be tight as much of the work is unlikely to progress before ESTER’s daily publication starts from 2H19.
If Euribor is deemed BMR compliant, a risk to investors and issuers is that a revised Euribor could have an absolute level or volatility that is different to the current rate. This could see disputes of contracts signed based on the pre-reform Euribor. Increased volatility or different absolute levels could also increase basis risk or prepayment rates, which could affect excess spread for structured finance and covered bonds.
Any potential future rating action for structured finance and covered bonds would depend on how seamlessly Euribor-based bonds, loans and hedges make the transition to either a revised and BMR-compliant Euribor or a fall-back reference rate. The following factors would have an impact on the rating analysis: contractual fall-back provisions, how technical and administrative challenges are addressed, other credit protection and the remaining weighted average lives after 2019 of assets and liabilities exposed to Euribor risks.
Bank and non-bank financial institutions may see non-traded interest rate risks increase if they are unable to re-price their variable-rate loans in line with changes to their funding. But we expect mainstream and specialist lenders should have some scope to pass on any short-term unexpected price adjustments. If replacement term structures do not come on-stream sufficiently quickly or lack liquidity, this could also increase traded market risks. While this could in theory affect capital adequacy requirements or stress-test results, it is likely to be immaterial.
Swaps and swap replacement provisions in structured finance and covered bonds could also be at risk from the tight timeframe for Eonia replacement. Eonia is used for valuations of Euribor-based swaps and will not become BMR-compliant.
A quick one, covering the upcoming 60 Minutes programme on Channel Nine Sunday, our live stream event next Tuesday, 18th September 2018, and the launch of our Capital Markets series today.
I was in London in 2008 when Lehman Brothers collapsed, 10 years ago. The sense at the time was that the financial system was teetering on the brink as stocks crashed, and liquidity dried up. Banks and other Financial Instructions just stopped trusting each other. We perhaps escaped the worse possible outcomes, but looking back, in fact the financial system is even today still under pressure, and some would say we have not really learnt the hard lessons of the great recession as it’s called.
Dave Lafferty, who is Natixis Investment Managers chief market strategist penned an really interesting piece which discusses the lessons investors might have learned 10 years after the collapse of Lehman Brothers, via InvestorDaily. I want to take you through his commentary and add my own points as we go though.
He starts by saying that It’s often said that you should never let a good crisis go to waste. As we approach the 10 year anniversary of the seminal event of the global financial crisis – the collapse of Lehman Brothers – investors may wonder if we’ve learned anything from past mistakes. Through the varying lenses of policymakers, investors and markets, the answer is decidedly mixed.
Without question, policymakers around the globe have made some headway, particularly in the area of bank vulnerability. While concentration risk among the major global banks has actually grown since the crisis, broadly speaking, leverage and trading risk are down while equity and capital ratios are up. Large bank failures remain a risk, particularly in the European periphery and emerging markets, but the gradual de-risking of banks should make the system less vulnerable to contagion in the next Lehman-like crisis.
Where policymakers have made less progress is on the monetary front. Other than the US Fed, the other major central banks remain in crisis mode today, unable to lift rates or unwind their massive quantitative easing programs. Balance sheets are bloated to the tune of $15 trillion with still close to $8 trillion in negative-yielding sovereign bonds, reducing the stimulative firepower of the major central banks to counteract the next recession or crisis. In the end, it may be fortunate that banks have ramped up their ability to absorb losses because central banks certainly have less power to prevent them.
Coming on the heels of the tech and telecom bust of 2000-2001, the plunge in risk assets during the GFC represented the second bear market in eight years for many investors. In addition to rethinking their equity expectations, Lehman’s collapse highlighted a new risk: that systemically important institutions might be too big, too interconnected, or too complex to save. Millennial investors coming of age in the 2000s may never look at equities the way the Baby Boomers did growing up in the bull market of the 1980s and ’90s. The common refrain in the wake of Lehman was that investors cared more about the “return of their capital, not the return on their capital”. While some scar tissue has built up, investors have been forever altered.
Ten years of Zero Interest Rate Policy and Negative Interest Rate Policy have pushed them grudgingly out the risk spectrum and back into equities, but there is little doubt investor risk tolerance has been fundamentally altered. Investors are more skittish and therefore more likely to bail when volatility rears its head again. “Buy and hold” has gone from a trusted maxim to a sad platitude that many investors can no longer embrace.
Finally, as investors have changed, so have the markets. Because the failure of Lehman was equal parts credit crisis and liquidity crisis, investors have come to demand both better protection and more liquidity in their investments. Wall Street, asset managers and global banks have been more than willing to develop new products and strategies promising to reduce volatility, manage downside exposure, or reduce correlation to falling markets. Assets in these products number in the trillions and include all manner of strategies that either use volatility as an input to reduce exposure or short volatility outright.
The common theme of these strategies, to one degree or another, is to reduce risk into falling markets, which may exacerbate the sell-off – as seen in February’s volatility tantrum. While we believe these strategies play an important role in tailoring appropriate client portfolios, it represents a modern-day tragedy of the commons whereby investors’ demands for better downside protection actually creates selling pressure and downside volatility when the crisis finally comes.
Historical analysis of any crisis is likely to be inconclusive and provide few solutions. There can only be so much learned from looking back when every new crisis is sewn from different seeds. All participants and policymakers can do is hope that the system is more flexible and therefore less fragile when the next crisis hits.
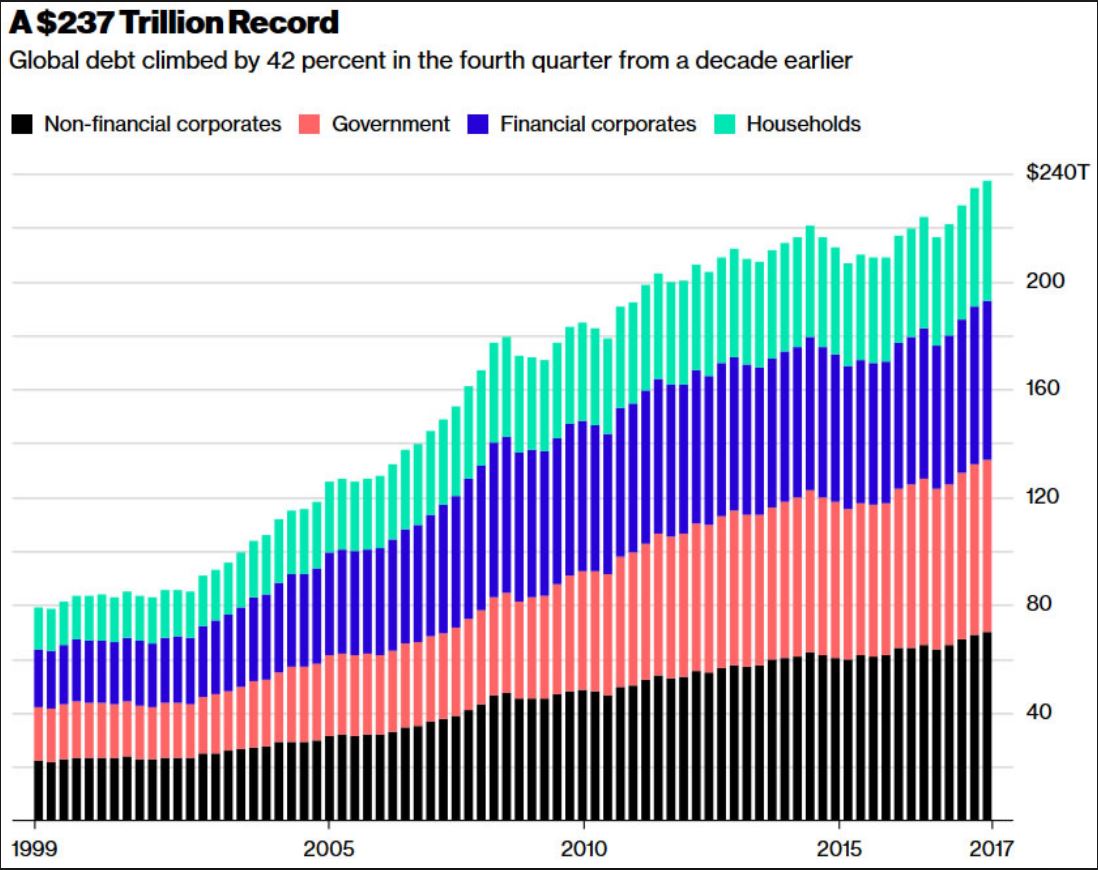
On this score, we can only conclude that things have changed very little from the days of Lehman. While consumers are in no worse shape, corporate and sovereign debt levels have only risen since the crisis, sustained solely by artificially low interest rates. Banks have found some religion with respect to building equity capital, but much of the leverage has simply moved to the bond markets. Meanwhile, old fashioned value investors who were willing to catch the falling knife are few and far between, replaced by quants and algos who will sell (or go short) at the first sign of trouble. The Lehman collapse brought about many positive changes, but in the end, the global financial system appears no less brittle today than a decade ago.
My view is the it will be US corporate bonds which will be the point of failure as the FED lifts rates in the months ahead. So history may not repeat, but it may well rhyme!
Welcome to the first in a new series of videos and posts in which we discuss the capital markets. It’s important to understand how these markets work because they are such a large element in the financial system, with bonds and other funding instruments, and the mix of derivatives together dominating the markets – and by the way, the risks in the system too. As you will know from our earlier posts, the total value of derivatives in the system globally dwarfs the value of the real economy.
You might like to know that I spent a number of years working in a major bank where I taught capital markets to their senior executives, because they had been subject to a major financial crash during which it became clear that the senior executives in the company had NO idea about how the markets really worked, and the inherent risks which they were taking. Some would say little has changed.
In this introduction I will discuss what we are going to explore in the series, over the weeks ahead. I am not assuming any prior knowledge of the topic in these shows, so we will start out quite simply, but by the end of the series we will be touching on some really complex, yet interesting concepts. So do come along for the ride. And I should explain that I called the series “Capital Markets 201” because this is going to be more, much more than a simple 101 overview.
So today, to start, I am going to outline the structure of the series and offer a definition of “Capital Markets”.
The capital markets are simply a market place where buyers and sellers engage in the trade of financial securities like bonds, stocks, and other instruments. This buying/selling may be undertaken by participants as diverse as banks, other financial institutions, companies, government entities and even individuals. The market may exist within a country, and internationally, with the bulk of the transactions relating to Australia for example, being off-shore.
These markets help to channel surplus funds from savers to institutions which then invest them, and many of these trades are in longer-term securities, though as we will see later sort-term funding and also a complex set of derivatives are also important in the sector.
Finally, capital market consists of primary markets and secondary markets. Primary markets deal with trade of new issues of stocks and bonds, and other securities, whereas secondary markets deals with the exchange of existing or previously-issued securities. Another important division in the capital market is made on the basis of the nature of security traded, i.e. stock market and bond market.
Finally, as well as trading in the underlying securities there are many flavours of derivative. A derivative is a contract between two parties which derives its value/price from an underlying asset. The most common types of derivatives are futures, options, forwards and swaps. Generally stocks, bonds, currency, commodities and interest rates form the underlying asset.
So to the structure of our series of programmes.
We are going to start in the next video with the concept of the time value of money. It’s essential to understand that capital markets are essentially all about manipulating cash flows. So we need to know about how to assess cash flows, and develop some basic language to describe them. We will also touch on concepts such as compound interest, current and future value, and internal rates of return.
Next we will look at the treasury operations in banks and other large corporations, and discuss the concept of disintermediation, where companies behave like banks in their own right. We will also meet archetypical “Belgium Dentists” and where they put their money.
After that, we will start looking at the individual instruments which make up the Capital Markets armoury. So we will look at bonds and other funding instruments, and how they work, and the different flavours which are out there. These instruments are the bedrock of the capital markets, so we will look at who might buy and sell such instruments.
Once we understand how bonds work, we can then start to explore the more complex derivatives areas of the capital markets.
We will look at futures and options contracts and how they work. This is a big area and we will look at both contracts relating to physical commodities like corn and pork bellies as well as financial contracts.
We will take a deep dive into interest rate and currency swaps and options, an area which I find really interesting. And there are a number of other variants which we will also touch on.
Then towards the end of the series we will start looking at financial engineering, where these various products are put to work. I will look for example at securitisation (I was involved in some of the early transactions in the 1990’s).
And as we bring the series to a close we will look at the risks in the system, the way the markets are regulated, or not, and some of the gaps in reporting and disclosure.
So buckle up, and enjoy the ride. And by the way, I will run a couple of live Q&A events as we progress through the series, and I will also try and answer questions as we go though, so do post any you may have.
Watch out for the next episode – The Time Value of Money – coming soon.
And by the way, if you value the content we produce please do consider joining our Patreon programme, where you can support our ability to continue to make great content. Here is the link, and it’s in the comments below.
ASIC has commenced civil penalty proceedings in the Federal Court of Australia against Australia and New Zealand Banking Group Limited (ANZ) for an alleged continuous disclosure breach in relation to a $2.5 billion institutional share placement undertaken by the ANZ in 2015.
On 6 August 2015, ANZ issued a release to the Australian Securities Exchange (the ASX) entitled “ANZ announces Institutional Placement (fully underwritten) and share Purchase Plan to raise a total of $3 billion”.
On 7 August 2015, ANZ issued a release to the ASX in respect of the placement stating among other things, “ANZ today announced that it had raised $2.5 billion in new equity capital through the placement of approximately 80.8 million ANZ ordinary shares at the price of $30.95 per share”.
ASIC alleges that that ANZ contravened s.674(2) of the Corporations Act by failing to notify the Australian Securities Exchange (ASX) that approximately $791 million of the $2.5 billion of ANZ shares offered in the Placement was to be acquired by its underwriters rather than placed with investors.
ASIC is seeking a declaration that ANZ breached its continuous disclosure obligations and a pecuniary penalty order.
The proceedings are to be listed for a case management hearing in the Federal Court in Melbourne on a date to be fixed.
ASIC will be making no further comment at this time.
APRA today published a letter relating to the Committed Liquidity Facility which is available to just 15 of the banks in Australia (The LCR banks). These have the back-stop option of calling on funds from the RBA to buttress their liquidity in case of need – so they can meet their obligations under the Basel III regime.
For a fee, if used, these banks essentially have a safety net in times of distress. Now APRA has outlined the arrangements for next year. Of course the other lenders have to operate without these supports.
More evidence of a lack of a level playing field in the system, and how the regulators are supporting the big end of town. No surprise then that big players are regarded by the markets as too big to fail.
But as Australian Government debt is hurtling beyond $500 billion, I have to say their so called justification – lack of liquidity in the local securities (mainly Australian Government Securities and securities issued by the borrowing authorities of the states and territories) is wearing a bit thin.
Why is this facility needed at all?
This is what APRA said today:
The Australian Prudential Regulation Authority (APRA) is today releasing aggregate results on the Committed Liquidity Facility (CLF) established between the Reserve Bank of Australia (RBA) and certain locally incorporated ADIs that are subject to the Liquidity Coverage Ratio (LCR).
APRA implemented the LCR on 1 January 2015. The LCR is a minimum requirement that aims to ensure that ADIs maintain sufficient unencumbered high-quality liquid assets (HQLA) to survive a severe liquidity stress scenario lasting for 30 calendar days. The LCR is part of the Basel III package of measures to strengthen the global banking system.
In December 2010, APRA and the RBA announced that ADIs subject to the LCR will be able to establish a CLF with the RBA. The CLF is intended to be sufficient in size to compensate for the lack of sufficient HQLA (mainly Australian Government Securities and securities issued by the borrowing authorities of the states and territories) in Australia for ADIs to meet their LCR requirements. ADIs are required to make every reasonable effort to manage their liquidity risk through their own balance sheet management before applying for a CLF for LCR purposes.
Committed Liquidity Facility for 2019
All locally incorporated LCR ADIs were invited to apply for a CLF amount to take effect on 1 January 2019. All fifteen ADIs chose to apply. Following APRA’s assessment of applications, the aggregate Australian dollar net cash outflow (NCO) of the fifteen ADIs was estimated at approximately $381 billion. The total CLF amount allocated for 2019 (including an allowance for buffers over the minimum 100 per cent requirement) is approximately $243 billion.
The CLF will enable participating ADIs to access a pre-specified amount of liquidity by entering into repurchase agreements of eligible securities outside the Reserve Bank’s normal market operations. To secure the Reserve Bank’s commitment, ADIs will be required to pay ongoing fees. The Reserve Bank’s commitment is contingent on the ADI having positive net worth in the opinion of the Bank, having consulted with APRA.
The facility will be at the discretion of the Reserve Bank. To be eligible for the facility, an ADI must first have received approval from APRA to meet part of its liquidity requirements through this facility. The facility can only be used to meet that part of the liquidity requirement agreed with APRA. APRA may also ask ADIs to confirm as much as 12 months in advance the extent to which they will be relying on a commitment from the Bank to meet their LCR requirement.
The Fee
In return for providing commitments under the CLF, the Bank will charge a fee of 15 basis points per annum, based on the size of the commitment. The fee will apply to both drawn and undrawn commitments and must be paid monthly in advance. The fee may be varied by the Bank at its sole discretion, provided it gives three months notice of any change.
Eligible Securities
Securities that ADIs can use under the CLF will include all securities eligible for the Reserve Bank’s normal market operations. In addition, for the purposes of the CLF, the Reserve Bank will allow ADIs to present certain related-party assets issued by bankruptcy remote vehicles, such as self-securitised residential mortgage-backed securities (RMBS). This reflects a desire from a systemic risk perspective to avoid promoting excessive cross-holdings of bank-issued instruments. Should the ADI lack a sufficient quantity of residential mortgages, other ‘self-securitised’ assets may be considered, with eligibility assessed on a case-by-case basis.
The Reserve Bank has discretion to broaden the eligibility criteria and conditions for the various asset classes at any time. The Bank will provide one years notice of any decision to narrow the criteria for the facility.
Interest Rate
For the CLF, the Bank will purchase securities under repo at an interest rate set 25 basis points above the Board’s target for the cash rate, in line with the current arrangements for the overnight repo facility.
Margining
The initial margins that the Reserve Bank will apply to eligible collateral will be the same as those used in the Bank’s normal market operations. Consistent with current practice, each day the Bank will re-value all securities held under repurchase agreements at prevailing market prices.
Termination
Subject to the ADI having positive net worth, the Reserve Bank will give at least 12 months notice of any intention to terminate the CLF. The Bank’s commitment to any individual ADI will lapse if the fee is not paid.
The Hayne royal commission has learned that the corporate watchdog allowed CBA to pay a substantially reduced fine despite misleading customers in its advertising, via InvestorDaily.
The royal commission has heard that ASIC not only gave CBA a severe discount for the misleading conduct but also let Australia’s biggest bank draft the media release regarding the action.
Senior counsel assisting Rowena Orr, QC opened Thursday’s hearing by questioning Helen Troup, the executive general manager of CBA’s insurance business CommInsure.
Ms Troup was taken through four pieces of advertising for CommInsure’s life and trauma insurance policy to determine how they discussed coverage for a heart attack.
Ms Troup accepted that in every case someone reading the adverts would believe the trauma policy covered all heart attacks.
The royal commission heard that CommInsure made a $300,000 voluntary community benefit payment as part of its agreement with ASIC to resolve the issue of misleading advertising.
Ms Orr pointed out to the commission that the maximum penalty for misleading conduct was 10,000 penalty units or almost $2 million per contravention.
In this instance, as Ms Troup had agreed to four adverts being misleading, it could have led to a fine of $8 million. But CommInsure only had to pay $300,000 as part of its agreement with ASIC to resolve the issue.
ASIC in fact seemed to have asked CBA if they thought the $300,000 was appropriate as Ms Orr read out to the commission a letter from the senior executive of ASIC, Tim Mullaly, addressed to CBA:
Could you please consider and let us know whether this is sufficient for CommInsure to resolve the matter, including by way of payment of the community benefit payment, in absence of infringement notices.
This provoked commissioner Hayne to ask if it was a case of the bank stipulating the terms of the punishment.
“The regulator asking the regulated whether the proposal was sufficient in the eyes of the party alleged to have broken the law, is that right?” he asked.
“We could have taken the approach of continuing to defend our position, so this was the alternative,” Ms Troup said.
Commissioner Hayne continued and asked Ms Troup if CommInsure viewed the community payment as a form of punishment.
“The $300,000 community benefit payment was a form of punishment,” she said.
Up until today’s hearing, CBA had not acknowledged the misleading adverts and had even advised ASIC on what language to use in their press release, said Ms Orr.
Ms Orr concluded by summarising that ASIC had given CommInsure notice of its findings, took no enforceable action and gave CommInsure the opportunity to make changes to the media release.

 Brisbane listed 105, reported 56 and sold 26, with 3 withdrawn. Domain estimates a 43% clearance rate.