ING DIRECT Introduces ‘One Swipe’ Banking And Apple Watch App

ING DIRECT has introduced true ‘one swipe’ banking, allowing customers using Apple devices to easily check their transaction account, savings, mortgage and superannuation balances with just one swipe.

The ‘Widget’ feature makes use of the Apple iOS 8 Notification Centre, meaning if customers choose, they no longer have to unlock their mobile device or even open their ING DIRECT app to check their balances, they can simply swipe down on their home screen and their ING DIRECT account balances will be available.

ING was one of the first Australian banks to provide the pre-login balance feature, which is used by more than 98 per cent of their mobile banking customers and which displays account balances by simply tapping the ING DIRECT app icon.

ING DIRECT on Apple Watch

ING DIRECT has also launched an app for the Apple Watch which can be configured to display a range of account balances, while the mobile banking app has recently been updated with a security feature allowing customers to place a ‘hold’ on their Visa debit card, preventing it’s use until the customer choose to release the ‘hold’.

ING DIRECT Introduces ‘One Swipe’ Banking And Apple Watch App

More than 70 per cent of ING DIRECT’s mobile interactions are by customers using Apple devices.  The ‘one swipe’ banking feature is not activated by default and is only made available to customers who chose to configure it through their iOS 8 Notification Centre.

Westpac. St George and CBA, as well as Optus also have plans for banking/payments on the watch.

Loan Types By Lender

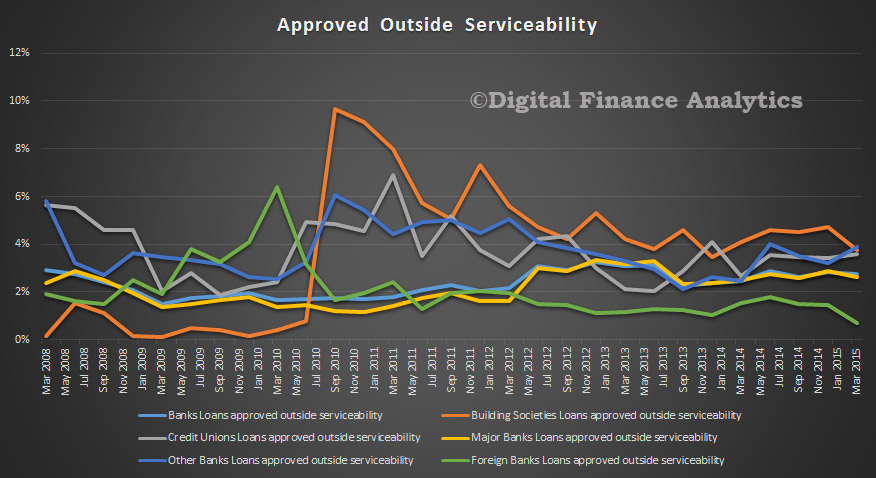
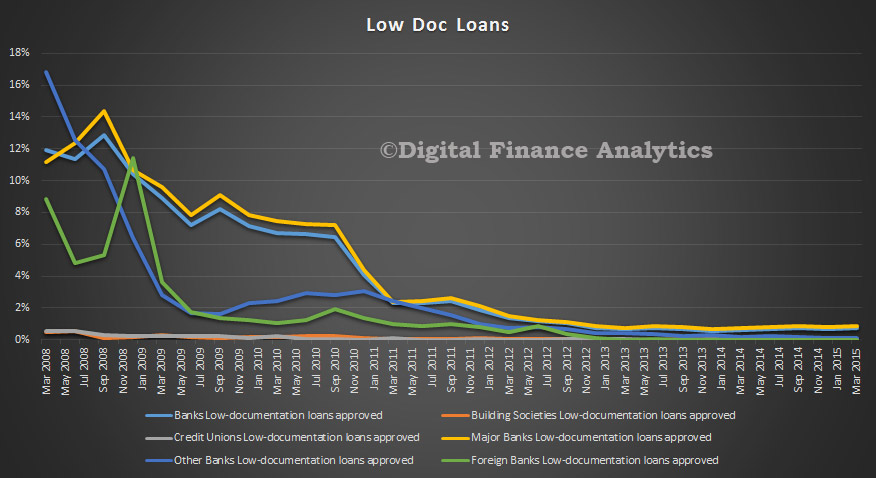
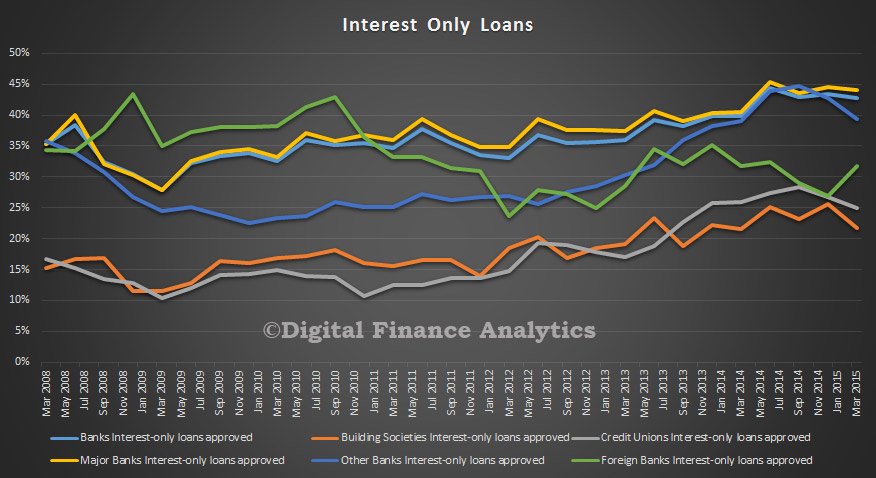
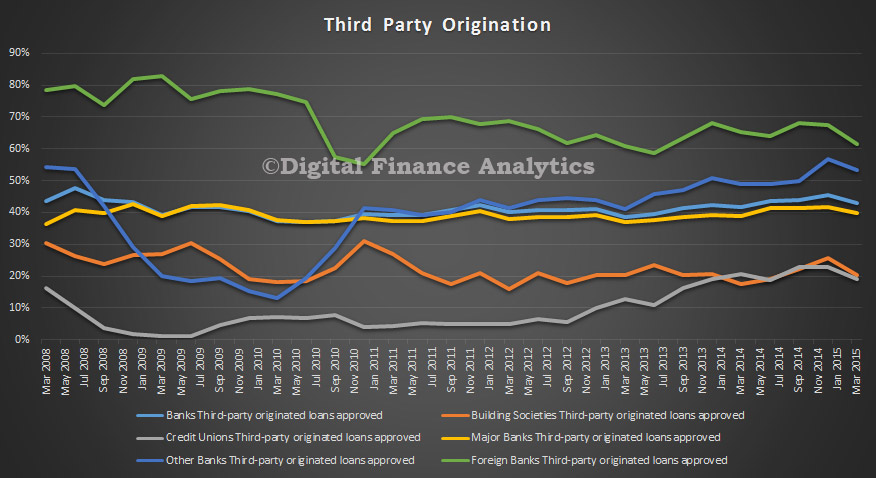
Completing the analysis of the residential  APRA Property Exposure data, we look at selected loan type data across the different ADI lender categories.  This analysis is based on relative numbers of transactions, not value.

First we see that the proportion of loans approved outside normal serviceability criteria has drifted lower, though Building Societies, Credit Unions and the Smaller Banks are still most likely to bend the rules to get a loan written. Perhaps they have tighter rules in place to begin with?

APRAOutsideServiceTypeMar2015The proportion of low doc loans written is miniscule and now consistently low. Most low doc borrowers would now be knocking on the door of the non-ADI’s as they do not have the same heavy supervisory oversight and are tending to be more flexible – but there is little public data on this.

APRALowDocTypeMAr2015Turning to interest only loans, the Majors, and Other Banks are most likely to write this type of loan. However, we note the rising proportion of Credit Unions, Building Societies and Foreign Banks who will consider the proposition.

APRAIntOnlyTypeMar2015Finally, looking at the use of the broker channel, Foregin Banks originate the highest proportion this way, with the smaller Banks also in on the third party origination game. Credit Unions and Building Societies are less inclined to use Brokers, though there have been some increase in recent years.

APRAThirdPartyByTypeMar2015

LVR Data By Lender Type

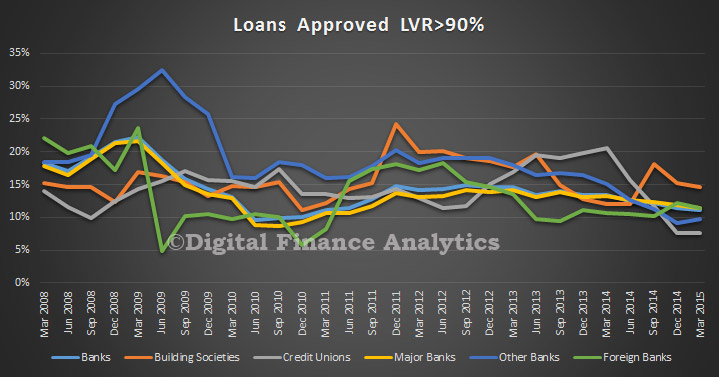
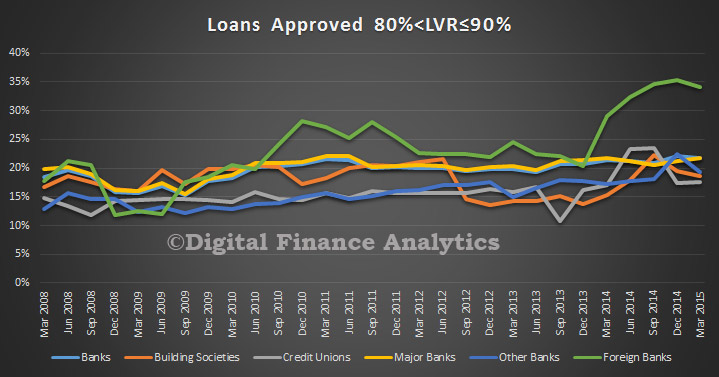
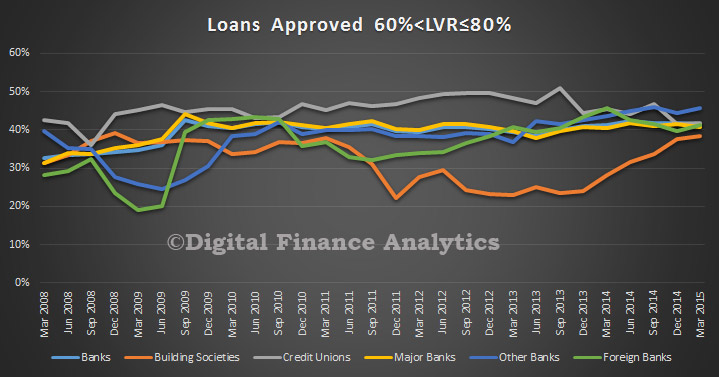
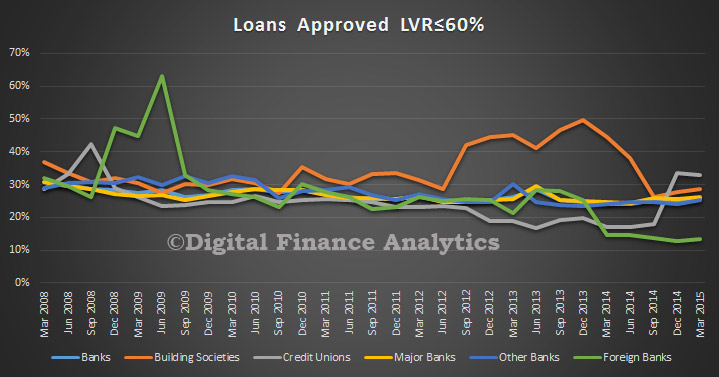
Continuing our analysis of the latest APRA data, we are looking at the LVR mix by type of lender by analysis of the relative ratio of LVR over time, (understanding that some lender categories are relatively small). APRA splits out the ADI data into sub categories, including Major Banks, Other Banks (excludes the Majors), Building Societies, Credit Unions and Foreign Banks. There are some interesting trend variations across these.

In the above 90% LVR category, we see a general drift down, Credit Unions took a dive last year, whilst Building Societies have the highest share of new 90%+ LVR loans, though we see this falling a little now. The Major Banks sit in the middle of the pack. Note that in 2009, Other Banks were writing more than 30% of their loans in this category, today its below 10%.

APRALVRByType90+May2015In the 80-90% LVR range, the Foreign banks, and Other Banks (ie not the big four) showed an uptick, though this may now be reversing. Building Societies and Credit Unions are below the Major Banks.

APRALVRByType90May2015In the 60-80% range, we see the Building Society mix rising in this band, whilst the others have been relatively static.

APRALVRByType80May2015Finally, the loans below 60% LVR. Here the Building Society have drop a few points, as they move into the higher LVR bands, though that may be reversing a little now. Foreign Banks share in this band dropped recently, after a spike in 2009.

APRALVRByType60May2015

Home Loans Up, Mix Changing, APRA

The Australian Prudential Regulation Authority (APRA) today released Quarterly Authorised Deposit-taking Institution Property Exposures for the March 2015 quarter.

Quarterly ADI Property Exposures contains information on ADIs’ commercial property exposures, residential property exposures and new housing loan approvals. Detailed statistics on residential property exposures and new housing loan approvals are included for ADIs with greater than $1 billion in housing loans.

ADIs’ commercial property exposures were $234.2 billion, an increase of $15.1 billion (6.9 per cent) over the year. Commercial property exposures within Australia were $193.3 billion, equivalent to 82.5 per cent of all commercial property exposures.

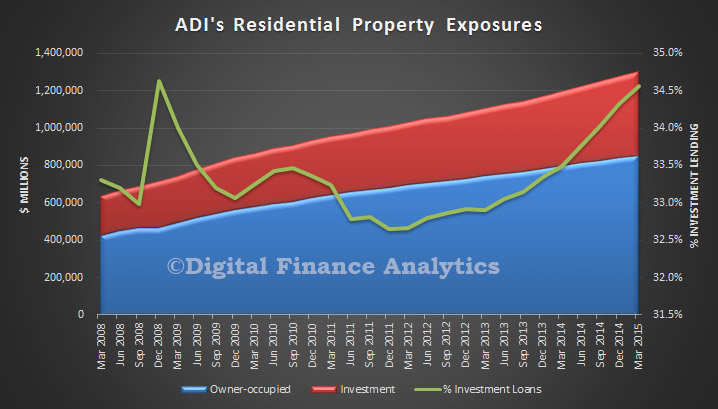
ADIs’ total domestic housing loans were $1.3 trillion, an increase of $107.1 billion (9.0 per cent) over the year. There were 5.3 million housing loans outstanding with an average balance of $243,000.

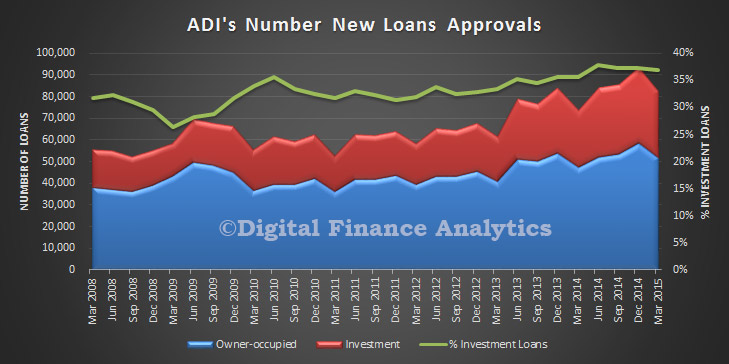
ADIs with greater than $1 billion of residential term loans approved $82.3 billion of new loans, an increase of $8.5 billion (11.5 per cent) over the year. Of these new loan approvals, $51.9 billion (63.0 per cent) were owner-occupied loans and $30.4 billion (37.0 per cent) were investment loans.

Looking in more detail at the data, looking first at the portfolio data, we see the rise on the value of home lending across the ADI’s and the rise in the proportion of investment loans in the mix. High LVR’s fell a little.

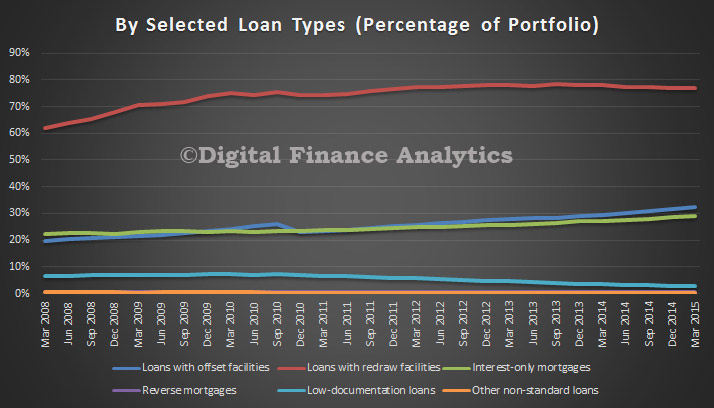
APRAPortfolioBalancesADIMarch2015The mix of loan type shows a continuing slow rise in interest-only loans (28.9% of all loans) and offset loans (32.3%), and a slight fall in loans with redraw (77.1% of loans).

APRALoanMixADIMarch2015

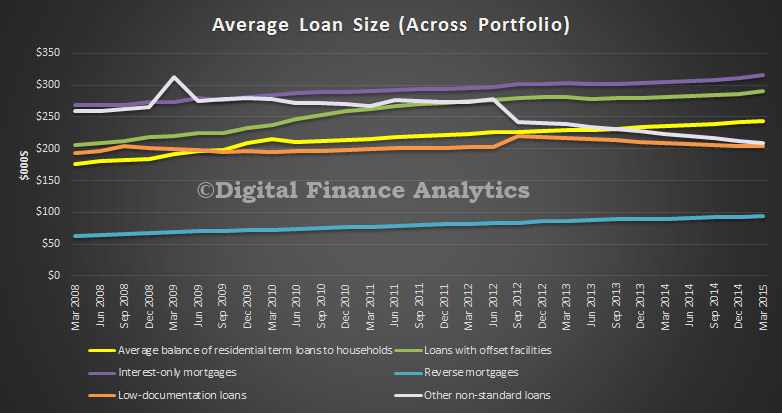
Across the portfolio, the average balance on interest-only loans is the highest, at $315,000, whilst reverse mortgages sat at $94,000.

APRAAverageLoanSizeADIMarch2015  Turning to approvals by quarter, we see a steady rise in approval volumes, with 37% by number investment loans. Remember that earlier APRA showed that more than 50% of loans by value were for investment loans, so we again see evidence that investment loans are larger by value.

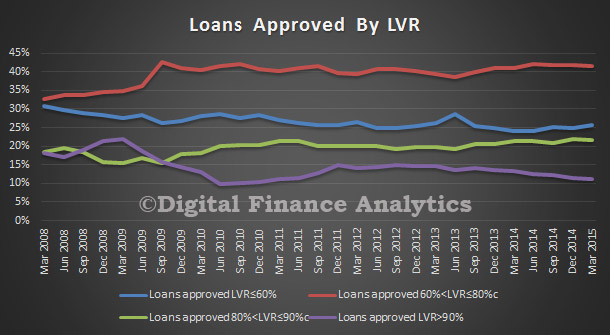
APRANoLoansApprovedMarch2015Looking at LVR bands, we see a slight fall in loans over 90% LVR (from 14% to 11%)  a slight rise in the 80-90% band, (from 16% to 22%). So the regulators influence is showing though to some extent.

APRANoLoansApprovedLVRMarch2015Finally, we see that third party loans by volume (not value) fell from 45% to 42% this quarter. Interest only loans accounted for 42% of approvals. Low doc and loans outside serviceability were low.

APRANumberofLoansApprovedByTypeMar2015 So overall, we see buoyant loan growth, supported by rises in investment lending and interest only loans. We will be watching the data next quarter as the Regulators tighten the screws. We think the property worm is about to turn.


Residential Property Prices Increased Significantly YOY in Real Terms 4Q14 – BIS

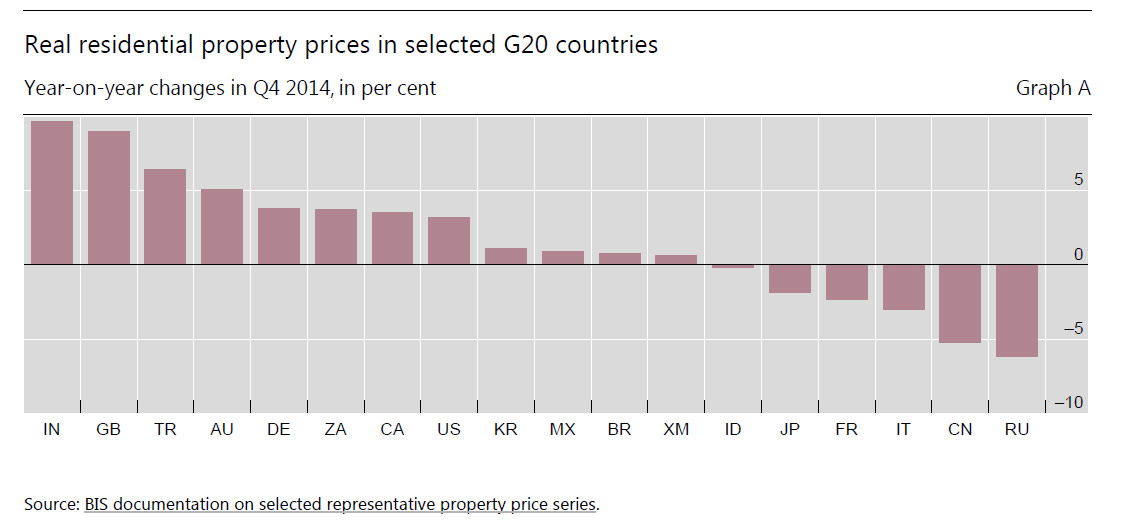
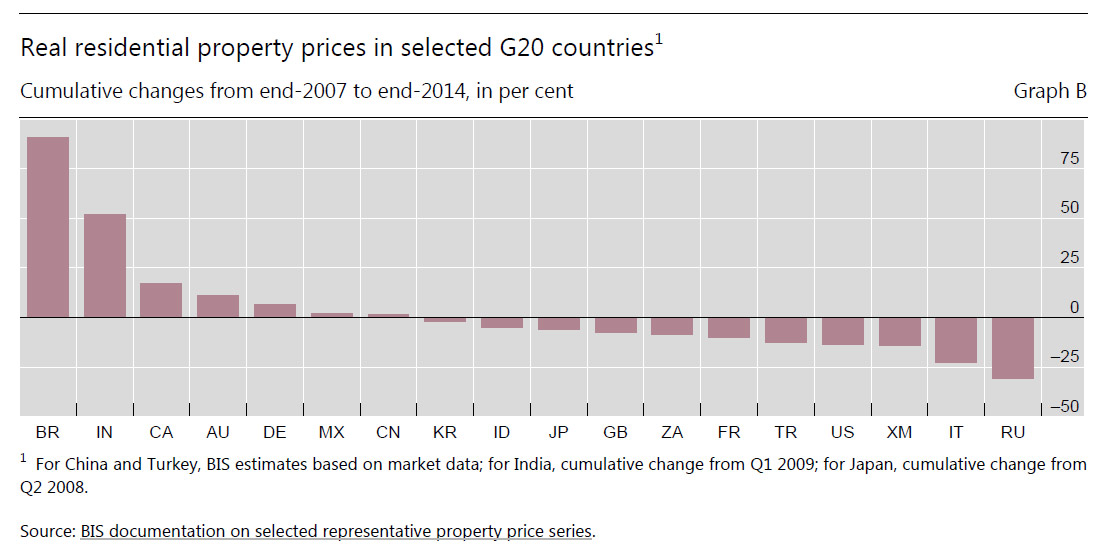
The Bank for International settlements released their latest cross-country house price database. They highlight the volatile nature of property, and longer term, contrasts the rise and rise we have seen in Australia, with very different stories elsewhere. Between 2007 and now, prices in real terms are still lower than they were then in US, UK and Japan. In Australia, and Canada, they are higher. Real residential property prices had almost doubled in Brazil and had risen by 80% in India; but they had declined by almost one third in Russia.

“In the fourth quarter of 2014, residential property prices increased significantly year on year in real terms (ie deflated by the CPI) in several advanced economies. They grew by 3–5% in Australia, Canada and the United States, and by around 10% in Sweden and the United Kingdom. Real prices increased by 1% in the euro area, although there were important disparities among member states: they rose by 16% in Ireland and more moderately in Germany and Spain, but continued to decline in France, Greece and Italy. Prices also fell in Japan. The picture was also mixed among major emerging market economies. Property price inflation remained strong in India, and to a lesser extent in South Africa and Turkey, but prices continued to fall in China and Russia.

BIS-PPty-May-2015-1From a longer-term perspective, residential property prices generally peaked in real terms in 2006–07 in most advanced economies. Since the end of 2007, they had decreased by 14% in the euro area, reflecting a fall of around 40% in Greece, Ireland and Spain, and by 23% in Italy, partly offset by a price increase in Germany. As of the fourth quarter of 2014, real prices were also still well below their 2007 levels in the United States (by 13%) and, to a lesser extent, Japan and the United Kingdom. Most other advanced economies, such as Australia, Canada, Norway, Sweden and Switzerland, had registered a significant rise in property prices over the previous seven years. Among major emerging market economies, real residential property prices had almost doubled in Brazil and had risen by 80% in India; but they had declined by almost one third in Russia.”

BIS-PPty-May-2015-2


Cold Hand Of The Regulator On Bank’s Investment Lending

Following the disclosures in the recent bank results that many were above the APRA target of 10% portfolio growth, and their statements they would work to fall within the guideline, we have seen a litany of changes from the banks, which marks an important change in tempo for investment home lending. Regulatory pressure is beginning to strangle investment lending growth.  Better late then never.

In the past few days, ANZ has stated it would no longer offer interest rate discounts to new property investor borrowers who did not also have an owner-occupied home loan with the bank; Westpac is cutting discounts to new investment property borrowers according to the AFR; and Bankwest has imposed a loan-to-valuation ratio cap of 80 per cent on investor Mortgages. Changes that took effect on Friday will mean Macquarie customers taking out fixed-rate investor or interest-only loans will pay higher rates than owner occupied borrowers. Recently the Commonwealth Bank, scrapped its $1,000 investment home-loan rebate offer and reduced pricing discounts for investment home loans. In addition more broadly, Bank Of Queensland has changed its underwriting practices. NAB has also changed its instructions brokers, and as of May 13, NAB would only consider pricing below advertised rates for owner-occupiers or personal loans. “Investment loans will not be eligible for any pricing discretions. Advertised rates will apply to investment loans,” the note said. Suncorp plans to pare down discounts for investor property loans while boosting incentives for homeowner lending, in reaction to the regulatory crackdown on housing markets.

Last week we showed that currently discounts are at their peak, so will we see overall discounts cut, or reinvigorated discounts on selected owner-occupied lending? Banks need home loan lending growth to make their business work. We think the focus will be on a drive to accelerate refinancing of existing loans, so expect to see some amazing offers in coming weeks to try and fill the gap.

We know from our surveys there is still significant demand for housing finance out there. We also know that some of the non-ADI players are playing an increasing role in the investment lending sector, and these players are of course not regulated by APRA. Securitisation of Australian home loans was up last quarter, and most were purchased by Australian investors.

Mortgage brokers, who have been enjoying the recent growth ride may suddenly be finding their world just changed.

Whilst its a change in tempo, its not necessarily the end of the mortgage lending boom. It may however be the tipping point on house prices in Sydney and Melbourne, where investment loans have been responsible for much of the rise.


ASIC Concerns Prompt Bank of Queensland to Improve Lending Practices

Bank of Queensland Limited (Bank of Queensland) has improved its lending practices following ASIC’s concerns about the way it assessed applications for home loans.

ASIC was concerned that Bank of Queensland was using a benchmark figure, the Henderson Poverty Index (HPI), to estimate the living expenses of consumers applying for home loans, rather than asking borrowers about their actual expenses.

In ASIC’s view, the lack of enquiry about actual expenses, and reliance solely on HPI (which is used as a measure for estimating the minimum amount of money families of different sizes need to cover basic essential needs) was not consistent with responsible lending obligations imposed by the National Credit Act.

Bank of Queensland has updated its home loan application forms to obtain more information about a customer’s living expenses. The bank will carry out an assessment of the suitability of a loan using the higher of either the living expense figure supplied by the customer or an appropriate benchmark figure.

ASIC notes that the bank will continue to review the circumstances of borrowers who go into hardship or default to ensure that they have not been disadvantaged by a loan provided prior to the change in policy.

ASIC Deputy Chairman Peter Kell said, ‘This outcome is part of ASIC’s ongoing focus on the lending industry’s compliance with responsible lending laws.  Lenders must carry out inquiries to determine whether a credit contract will be unsuitable for a consumer. Using benchmark figures such as the Henderson Poverty Index alone to estimate a consumer’s financial position is not sufficient to meet this requirement.’

In November 2014, ASIC updated Regulatory Guide 209 Credit licensing: Responsible lending conduct (RG 209) to clarify that credit licensees cannot rely solely on benchmark living expense figures, and must also make inquiries about the borrowers’ actual living expenses.

ASIC acknowledges the co-operation of Bank of Queensland in resolving this issue.

Release of the Spectrum Review Report

The Minister for Communications and the Parliamentary Secretary announced the release of the Spectrum Review Report, prepared by the Department of Communications.

In May 2014, the Minister for Communications announced a review of the spectrum policy and management framework. Established in 1992, the current framework led the world in how it dealt with the complexities of spectrum management. But today, more than 20 years later, the fast changing nature of technology has dated the framework. It needs to be modernised to reflect changes in technology, markets and consumer preferences that have occurred over the last decade and to better deal with increasing demand for spectrum from all sectors.

The purpose of the review was to examine what policy and regulatory changes are needed to meet current challenges, and ensure the framework will serve Australia well into the future.

Under the Terms of Reference, the review was to consider ways to:

  1. simplify the framework to reduce its complexity and impact on spectrum users and administrators, and eliminate unnecessary and excessive regulatory provisions
  2. improve the flexibility of the framework and its ability to facilitate new and emerging services including advancements that offer greater potential for efficient spectrum use, while continuing to manage interference and providing certainty for incumbents
  3. ensure efficient allocation, ongoing use and management of spectrum, and incentivise its efficient use by all commercial, public and community spectrum users
  4. consider institutional arrangements and ensure an appropriate level of Ministerial oversight of spectrum policy and management, by identifying appropriate roles for the Minister, the Australian Communications and Media Authority, the Department of Communications and others involved in spectrum management
  5. promote consistency across legislation and sectors, including in relation to compliance mechanisms, technical regulation and the planning and licensing of spectrum
  6. develop an appropriate framework to consider public interest spectrum issues
  7.  develop a whole‐of‐government approach to spectrum policy
  8. develop a whole‐of‐economy approach to valuation of spectrum that includes consideration of the broader economic and social benefits.

The Spectrum Review Report highlights the need to simplify the current framework to remove prescriptive regulatory arrangements and to support the use of new and innovative technologies and services across the economy.

The report recommends simplifying processes for new and existing spectrum users and increasing opportunities for market-based arrangements, including spectrum sharing and trading.

The three main recommendations are:

  1. Replace the current legislative arrangements with streamlined legislation that focusses on outcomes rather than process, for a simpler and more flexible framework.
  2. Better integrate the management of public sector and broadcasting spectrum to improve the consistency and integrity of the framework.
  3. Review spectrum pricing to ensure consistent and transparent arrangements to support the efficient use of spectrum and secondary markets.

The report is the outcome of a review conducted by the Department of Communications in conjunction with the Australian Communications and Media Authority, and included extensive stakeholder consultation.

The legislative reforms would:

  1. establish a single licensing system based on the parameters of the licence, including duration and renewal rights
  2. clarify the roles and responsibilities of the Minister and the ACMA > provide for transparent and timely spectrum allocation and reallocation processes and methods, and allow for allocation and reallocation of encumbered spectrum
  3. provide more opportunities for spectrum users to participate in spectrum management, through delegation of functions and user driven dispute resolution
  4. manage broadcasting spectrum in the same way as other spectrum while recognising that the holders of broadcasting licences and the national broadcasters would be provided with certainty of access to spectrum to deliver broadcasting services
  5. streamline device supply schemes
  6. improve compliance and enforcement by introducing proportionate and graduated enforcement mechanisms for breaches of either the law or licence conditions
  7. ensure that the rights of existing licence holders are not diminished in the transition
    to the new framework.

Implementation stages would commence following the passage of legislation. This would again include ongoing consultation with stakeholders and progress over a period of some years.

The Government is currently considering the report and will prepare a response in due course. Stakeholder feedback on the report is welcomed.

The report is available at: www.communications.gov.au/spectrumreview

ASIC Launches a ‘Women’s Money Toolkit’

ASIC has launched a ‘Women’s Money Toolkit’, a free online resource designed to help Australian women manage their finances, make money decisions at key life stages and enhance their financial wellbeing.

The toolkit was developed in response to the particular needs of women who face financial issues and challenges as a result of factors such as their greater likelihood of variable workforce participation, longer life expectancy and on average lower superannuation balances. Research suggests there are differences in the way that women and men generally interact with finances, indicating the need for a tailored approach to financial education.

The Women’s Money Toolkit is available on ASIC’s MoneySmart website at moneysmart.gov.au.

Image of the Womens Money Toolkit

Relevant facts and figures that informed the development of ASIC’s Women’s money toolkit:

  • 46.1% of women in employment work part time hours, compared to 16.8% of men.
  • In 2013, the life expectancy of Australian women was 84.3 and the life expectancy of men was 80.1
  • At age 60-64, women have on average $104,734 in their super balance while men have $197,054).

The ANZ’s Survey of Adult Financial Literacy in Australia revealed differences in the financial attitudes and behaviours of Australian women and men including:

  • Women aged 28 to 59 had higher scores than men on keeping track of finances
  • Women of all ages were more likely than men of all ages to agree that ‘money dealing is stressful’
  • Women of all ages had lower scores than men on impulsivity.

How Tesco’s Loyalty Card Transformed Customer Data Tracking

From CMO. Insights from Tesco about how to harness the power of customer data. Knowing is not enough, you have to apply the insights and transform.

There were no Big Data systems in 1995. In fact the term wasn’t even be discussed until more than a decade later. But that didn’t stop the UK-based retailer Tesco going ahead and building a Big Data capability.

Speaking at the Retail TECH X conference in Melbourne this week, former Tesco CEO, Sir Terry Leahy, discussed the company’s early foray into data-driven decision making. He credited it as a key reason why a retailer, who in the mid-1990s was ranked a distant third in its market, was able to surpass the performance of its two biggest rivals several times over two decades later.

Loyalty card revolutionises Tesco’s performance

Sir Terry joined the retailer as a marketing executive in 1979, and led the company from 1997 to 2011. He said the key for Tesco was Clubcard, a loyalty card introduced in 1995 that allowed the company to connect and respond to customers through data, rather than through more traditional methods.

“Data is absolutely priceless in transforming the relative position of a business,” Sir Terry said. “It was the first example of what is known today as Big Data.”

Before 1995, Sir Terry said computers were simply not powerful enough to hold information both on product movements and individual purchasing behaviour.

“It was absolutely transformational for the business,” he claimed. “We could treat customers as individuals. And we could learn what they were interested in, what their behaviours were, and we could tailor and target all of their marketing so that it was relevant to that individual consumer.”

Sir Terry said in the year before Tesco launched its ClubCard, Sainsbury’s was worth twice the value of Tesco. Within a year Tesco had overtaken Sainsbury’s. By the time he left the CEO role in 2011 Sir Terry said Tesco had outperformed its rivals tenfold.

“And it improved the productivity of our marketing, between 300 and 1000 per cent depending on the application,” he added. “We were able as a percentage of sales to spend less on our marketing going forward, it made it so effective.”

Understand the true nature of your business

Sir Terry’s formula from boosting the performance of Tesco started with building a true understanding of the true nature of the business.

“We all want the business to be doing well, but that may not be the truth of it,” Sir Terry said. “Today data plays an incredibly important role in bringing into the organisation from outside an accurate picture of how the business is perceived. And it is absolutely crucial that the organisation finds a way of bringing the voice of the customer into the business, because that’s the most reliable voice – that’s the one you should navigate the business by.

“It may be painful to hear, but if you are prepared to listen to what the customer is saying, and if you are prepared to change your business on the basis of that, then you’ll always be in business and stay connected to the customer.”

Performance monitoring through data

The company used data extensively to monitor changing customer preferences, leading to a series of industry innovations that served to transform its performance. Data also led Tesco to introduce the convenience format, going against industry wisdom that suggested that bigger was better.

“Customers were saying they were getting busier and busier, and needed a store that was handier and closer,” Sir Terry said. “So we miniaturised the supermarket into Tesco Express. In 1996 the first one opened, and today there are thousands all over the world, and most retailers no feel it is essential they have a convenience store format as part of the line-up.”

Tesco was also the first food retailer to sell online, and maintains the largest share of any food retailer in the world, holding close to 50 per cent in the UK.

Sir Terry said for an organisation to successfully implement a data strategy, it also required those who were working with data to take a leadership role within the organisation, as data can often lead to conclusions which run counter to conventional thinking.

“Knowing is not enough – you actually have to do something about what you know about customers,” he said. “You have to change the organisation. And it does need different decision-making structures actually to respond to data. It’s got to be actionable or it’s of no value at all, and that takes leadership.”

But despite the heavy investment in technology, Sir Terry said it would have all come to nought had the company lost its connection to its customers – something many consider has happened since he departed in 2011.

“Technology is just a tool,” Sir Terry said. “What matters in the end is the relationship between you and the consumer, and your ability to understand how their lives are changing.”