China Policy Shift Prioritises Growth Over Debt Problem – Fitch

Fitch Ratings says the Chinese government directives last week concerning local government debt signal a potentially significant policy shift to prioritise growth over managing the country’s debt problem. Uncertainty over the scale and strategy to resolve high local government debt remains a key issue for China’s sovereign credit profile, and the latest directives could reflect a continuation of an “extend and pretend” approach to the issue. The directives should be credit positive for local governments, while broadly neutral for banks.

A joint directive from the Chinese finance ministry, central bank and financial regulator on 15 May, instructed the banks to continue extending loans to local government financing vehicles (LGFV)s for existing projects that had commenced prior to end-2014, and to renegotiate debt where necessary to ensure project completion. This is an explicit form of regulatory forbearance, and serves to delay plans to wind down the role of LGFVs. More broadly, it also suggests that propping up growth in the short term has temporarily taken priority over efforts to resolve solvency problems at the local government level.

Fitch estimates local government debt to have reached 32% of GDP at end-2014, up from 18% at end-2008. The CNY14.9trn increase accounts for 18% of the rise in total debt.

The authorities’ efforts to rein in indebtedness have led to a squeeze on monetary conditions and credit that has dampened growth. GDP expanded 1.3% qoq in 1Q15, and April activity data indicated the slowdown has persisted into the second quarter with weak demand across the board. Fixed-asset investment growth slowed to 12% yoy for the first four months of 2015, a 14-year low. Property investment growth fell to 6% from 8.5% in March as China’s 2009-2014 real estate boom continues to unwind.. This poses downside risk to Fitch’s projection of 6.8% growth for 2015.

Earlier, on 13 May, the central government also announced a USD160bn debt swap plan by which local governments would be allowed to convert LGFV debt for municipal bonds and where the bond yields would be capped.

For local governments, the swap will ease the interest burden at a time when a slowing economy and a significant reduction in land sales are weighing on revenue growth. Local government debt often carries interest rates in excess of 7%, whereas the local bonds that will be converted from debt under this programme will be restricted to yields not in excess of 30% above central government bonds with similar tenors.

Fitch views the development of a local bond market as credit positive in itself for local governments. They will benefit from an extended maturity profile on the bonds compared with LGFV instruments. This will significantly reduce liquidity risks, and ensure a better asset/liability match. It also widens local governments’ funding channels and builds a more transparent fiscal reporting system.

More broadly, Fitch expects the resolution of China’s debt problem will ultimately involve sovereign resources, and that debt will migrate on to the sovereign balance sheet. The agency views the debt-swap plan as part of this process, even though the new local government debt is not expected to carry an explicit sovereign guarantee – as the debt is likely to be perceived as having a strong implicit guarantee. Nonetheless, the expectation of substantial contingent liabilities is factored into China’s ‘A+’/Stable sovereign IDR, affirmed in April 2015.

For Chinese banks, the shift from debt to bonds will affect profitability, especially as the rates on the swapped bonds are being capped. Banks will receive lower yields on the same exposure at a time when net interest margins are coming under pressure owing to the macroeconomic slowdown. Furthermore, the government directive to continue extending loans to LGFVs on certain projects will have a negative effect on banks’ liquidity and leverage. More broadly, the directive highlights that banks remain subject to direct influence from the authorities, which could have an impact on management governance and standards.

However, it also reinforces the role that state banks play in economic stability, and therefore the high likelihood that they will benefit from state support. Furthermore, the impact on liquidity will be offset somewhat by the fact that banks will be able to use municipal and provincial bonds as collateral to access key lending facilities. This will enable them to boost lending to higher-margin business. Notably, too, the conversions should have some positive impact on banks’ reported capital ratios as municipal bonds have lower risk weights than local government loans.

ASEAN Financial Integration – SME Funding Needs

Interesting speech from Mr Muhammad bin Ibrahim, Deputy Governor of the Central Bank of Malaysia (Bank Negara Malaysia), at the ASEAN Risk Conference. The 10 countries which together are defined as ASEAN, make up a large and fast developing economic area with 600m people, and it could be the fourth largest trading bloc by 2050. But the credit gap for SMEs in East Asia is estimated to be more than USD250 billion, due to under-developed financial systems. Cross regional financial services players could have a critical role to play in future growth and development.

The vision for an economically and financially integrated ASEAN represents the aspiration of many policy makers, old and new. A recent take on this can be found in a document titled “The Road to ASEAN Financial Integration”, a study on the financial landscape and formulating milestones on ASEAN monetary and financial integration. This document endorsed by the ASEAN Central Bank Governors and approved by the Finance Ministers presents a clear, ambitious and committed statement by the region to collectively embark on this journey. In this respect, ASEAN has made meaningful progress in the identification, articulation and implementation of principles to advance financial and economic integration among its members.

ASEAN is home to more than 600 million people and if considered as a single entity, would represent the sixth largest economy in the world with a combined GDP of USD2.5 trillion. According to the OECD, the region is projected to sustain an average annual growth of 5.6% over the next four years and is expected to be the fourth largest trading bloc by 2050. Concurrently, the standards of living among the general populace will continue to improve. Household purchasing power has risen significantly over the last decade, transforming the region into a thriving hub of consumer demand. The size of ASEAN’s consuming class is expected to double from 81 million to 163 million by 2030. By 2020, Asia is estimated to account for more than half of the total global middle class population, with ASEAN representing more than USD2 trillion of additional consumption within the region.

Also, as the sources of economic growth become increasingly domestic-based, this enables many economies to diversify their sources of growth. An important development is the significant increase in intra-regional trade. These developments augur well for the region and would expand domestic demand and further fuel greater intra-regional trade among ASEAN member countries.

The promise of higher living standards and employment is also drawing large numbers of people from the countryside to cities. Today, just over a third of ASEAN’s population are living in urban areas. This is expected to rise to 45% by 2030.

Integrating national financial systems within the region is key to unlocking ASEAN’s enormous economic growth potential. As a critical component of the AEC, financial integration will significantly enhance the efficiency and effectiveness of intermediation and allocation of resources. This is crucial as the region pursues greater economic prosperity that is both inclusive and sustainable. By allowing the region’s financial resources to move more freely across borders, financial integration will open up new opportunities for businesses and trade, enhancing further financial linkages within the region.

A more integrated regional financial system would also allow a larger share of the region’s surplus savings to be deployed within the region towards productive ends, such as in physical infrastructure projects. According to the Asian Development Bank, ASEAN will require approximately USD1 trillion 1  over the next 10 years in infrastructure investments across the region. This includes for the provision of sufficient housing, efficient public transportation and access to clean water and electricity. While the numbers seem staggering, the ability to recycle the huge savings within ASEAN will substantially enhance the region’s prospects to fund and sustain such investments.

With one of the highest savings rate in the world, at approximately 30% of GDP which currently amounts to USD750 billion, a well-integrated regional financial system would provide a more comprehensive eco-system for an efficient and competitive intermediation and investment.

An important component of ASEAN growth is the critical role of SMEs in all economies. The AEC recognise this and calls for SMEs to play a greater role in contributing to the overall economic growth and development of ASEAN as a region. Access to financing, however, remains a key challenge for many businesses. Despite various national level efforts, more needs to be done for SMEs to obtain access to financing, including the funding required to grow their business beyond national borders. The credit gap for SMEs in East Asia is estimated to be more than USD250 billion.  The difficulties in access to financing are compounded by underdeveloped financial systems, the need to manage multiple banking relationships across different markets, and a lack of coordinated financial advisory support to help businesses navigate the regulatory and business environment in different jurisdictions. A larger presence of regional financial institutions can significantly reduce these challenges. Banks with wide regional networks would possess the intimate knowledge of each economy and understands the unique requirements of SMEs. Such banks are well placed to serve and harness SMEs’ capability to participate more meaningfully in the region’s production networks.

For ASEAN financial institutions, the prospect of regional financial integration will also serve to raise industry standards across the region. This includes enhancing the breadth and quality of financial products and services as a result of more efficient markets and the transfer of knowledge and technology. Financial institutions will also need to meet higher standards in how they manage risk and govern their operations. To some extent, this will be driven by regulatory efforts to elevate prudential and business conduct standards. But aside from regulation, greater economies of scale and scope will also make it more feasible for financial institutions to invest in talent and more advanced technology and systems, to support business development and risk management.

Chair Yellen Says US Rates Will Rise, Slowly

 In a speech by Fed Chair Janet L. Yellen at the Providence Chamber of Commerce, Providence, Rhode Island, she outlined the state of play of the US economy. Whilst there are mixed signals, she affirmed that rates will begin to rise later this year.

Implications for Monetary Policy
Given this economic outlook and the attendant uncertainty, how is monetary policy likely to evolve over the next few years? Because of the substantial lags in the effects of monetary policy on the economy, we must make policy in a forward-looking manner. Delaying action to tighten monetary policy until employment and inflation are already back to our objectives would risk overheating the economy.

For this reason, if the economy continues to improve as I expect, I think it will be appropriate at some point this year to take the initial step to raise the federal funds rate target and begin the process of normalizing monetary policy. To support taking this step, however, I will need to see continued improvement in labor market conditions, and I will need to be reasonably confident that inflation will move back to 2 percent over the medium term.

After we begin raising the federal funds rate, I anticipate that the pace of normalization is likely to be gradual. The various headwinds that are still restraining the economy, as I said, will likely take some time to fully abate, and the pace of that improvement is highly uncertain. If conditions develop as my colleagues and I expect, then the FOMC’s objectives of maximum employment and price stability would best be achieved by proceeding cautiously, which I expect would mean that it will be several years before the federal funds rate would be back to its normal, longer-run level.

Having said that, I should stress that the actual course of policy will be determined by incoming data and what that reveals about the economy. We have no intention of embarking on a preset course of increases in the federal funds rate after the initial increase. Rather, we will adjust monetary policy in response to developments in economic activity and inflation as they occur. If conditions improve more rapidly than expected, it may be appropriate to raise interest rates more quickly; conversely, the pace of normalization may be slower if conditions turn out to be less favorable.

Securitisation Of Mortgages On The Rise

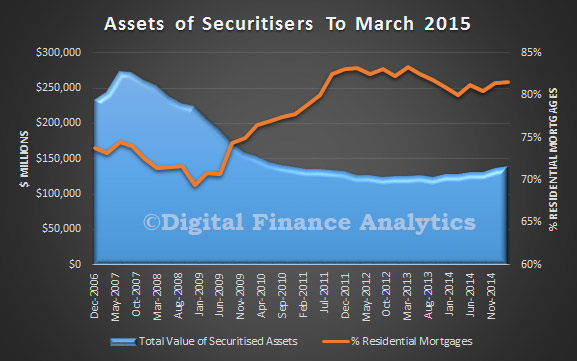
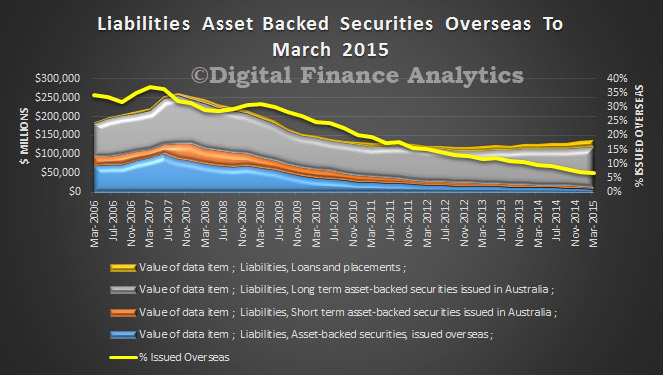
The ABS released their latest statistics on the asset and liabilities of Australian securitiers to March 2015. We saw a rise in mortgage back securitisation, and a rise in issuance to Australian investors. At 31 March 2015, total assets of Australian securitisers were $140.0b, up $3.5b (2.6%) on 31 December 2014. During the March quarter 2015, the rise in total assets was due to an increase in residential mortgage assets (up $3.1b, 2.8%) and other loans (up $0.9b, 5.9%). This was partially offset by decreases in cash and deposits (down $0.4b, 9.8%). Residential and non-residential mortgage assets, which accounted for 83.1% of total assets, were $116.4b at 31 March 2015, an increase of $3.1b (2.7%) during the quarter. SecuritiserAssetsMar2015At 31 March 2015, total liabilities of Australian securitisers were $140.0b, up $3.5b (2.6%) on 31 December 2014. The rise in total liabilities was due to the increase in long term asset backed securities issued in Australia (up $4.1b, 3.9%) and loans and placements (up $0.7b, 3.5%). This was partially offset by a decrease in short term asset backed securities issued in Australia (down $0.6b, 18.8%) and asset backed securities issued overseas (down $0.3b, 3.2%). At 31 March 2015, asset backed securities issued overseas as a proportion of total liabilities decreased to 6.6%, down 0.4% on the December quarter 2014 proportion of 7.0%. Asset backed securities issued in Australia as a proportion of total liabilities increased to 78.2%, up 0.5% on the December quarter 2014 proportion of 77.7%.

SecuritisersLiabilitiesMarch2015This data relates to all Special Purpose Vehicles (SPVs) which securitise any type of asset (including mortgages, credit card receivables, lease receivables, short and long term debt securities) and which are not regulated or registered with APRA and therefore are not required to report to APRA under the Financial Statistics (Collection of Data) Act. Coverage is limited to those SPVs which are independently rated by a recognised rating agency. Internal securitisation is excluded from this survey. Internal securitisation, also referred to as self-securitisation, is a process in which an originator sells a pool of assets to a related special purpose vehicle (SPV), and the SPV in turn issues debt securities, which are held entirely by the originator. These securities are eligible for use as collateral in repurchase agreements (repos) with the Reserve Bank of Australia (RBA).

Note that revisions have been made to the original series as a result of the receipt of revised survey data. These revisions have impacted the assets and liabilities reported back to and including the September 2013 quarter.


Shoppers Switch to Smart Phones to Pay for Groceries, Takeaway – CUA

Customers using their Android phone for ‘tap and pay’ purchases are most likely to be buying their groceries or a takeaway meal, spending an average of $27 per transaction, according to new data to be released by CUA at a national conference in Melbourne. By way of background, CUA originally was formed as a credit union in Queensland in the 1940s with just 180 members. Since then, through the amalgamation of more than 160 credit unions, they have become Australia’s “largest customer-owned financial institution”, with more than 400,000 customers, over 900 employees and $9 billion in assets under management.

In July last year, customer-owned financial institution CUA became the first banking provider in the Asia-Pacific to roll out a free mobile app using HCE technology, which allowed customers to ‘tap and pay’ with any compatible Android phone. The mobile app – CUA redi2PAY – was developed by CUA’s payments provider Cuscal and works on any NFC-enabled Android phone running on KitKat 4.4 or later.

CUA Head of Customer Insights Chris Malcolm and Cuscal Head of EFT, Acquiring and Digital Colin Sultana will share insights into how customers are using their ‘mobile wallets’ as part of a case study on the redi2PAY implementation at the Australian Cards and Payments Summit taking place at the Melbourne Convention & Exhibition Centre today.

Mr Malcolm said groceries were the top retail category for redi2PAY transactions, followed by fast food, petrol stations, restaurants/ dining and alcohol purchases.

“Interestingly, the top five retail categories for redi2PAY mobile payments are the exact same retail categories where CUA customers make the highest number of Visa PayWave purchases using their debit card,” he said.

“It appears that CUA’s early adopters of mobile payments technology are literally swapping their debit card for their mobile phone, using it for the same kind of purchases as they would have made with a traditional plastic card.”

Customers using redi2PAY are also using it more frequently – the number of customers using redi2PAY more than 35 times per month was around three times higher in March than it was six months earlier in October. The number of customers using mobile payments semi-regularly (5 to 14 times per month) is up 63 per cent for the same period.

The data also shows:

  • Customers spend an average of $27 per transaction when using CUA redi2PAY – the same as the average amount for Visa PayWave purchases.
  • The number of redi2PAY transactions spikes towards the end of the week (Thursday to Saturday). Saturday has the highest number of redi2PAY transactions, while Sunday has the least. Visa PayWave transactions also peak on Saturday, while Monday has the lowest number of payments.
  • Most mobile payments occur between 12pm and 8pm, with a spike from 1-2pm. The trend is similar for Visa PayWave payments.
  • The number of redi2PAY transactions each month has increased by more than 16 per cent since September 2014.
  • December 2014 recorded the highest value of redi2PAY transactions for a single month, coinciding with the lead up to Christmas.

CUA and Cuscal have already been recognised in Australia and Asia as pioneers in mobile payments. A leading financial research company in Asia, IDC, recently named CUA redi2PAY as one of the top 25 mobile innovations in financial services for 2014-15.

“There is huge potential for this technology to fundamentally change how people pay for purchases,” Mr Malcolm said.

“People tend to take their smart phones everywhere they go and now, the need to also carry cash and cards in your wallets is becoming a thing of the past.”

He said approximately eight times more CUA customers now have a compatible Android phone which could be used for redi2PAY, compared to a relatively small group of customers who had the required technology when redi2PAY was launched 10 months ago.

“We’re seeing increased take-up of this HCE technology across the banking sector, as others follow our lead. The use of ‘mobile wallets’ will only continue to grow as customers become more familiar with the technology and its security features, and upgrade their Android devices to the latest models.”

TOP 10 RETAIL CATEGORIES – redi2PAY vs Visa PayWave

(1 September 2014 to 31 March 2015)

CUA redi2PAY CUA Visa PayWave
Category of retailer Transactions Category of retailer Transactions
1. Grocery stores 26% 1. Grocery stores 27%
2. Fast food outlets 17% 2. Fast food outlets 17%
3. Service stations 14% 3. Service stations 11%
4. Restaurants 10% 4. Restaurants 11%
5. Liquor outlets 4% 5. Liquor outlets 4%
6. Convenience food stores 4% 6. Convenience food stores 3%
7. Discount stores 3% 7. Discount stores 3%
8. Pharmacies 3% 8. Pharmacies 3%
9. Variety stores 3% 9. Hardware stores 3%
10. Hardware stores 2% 10. Bars/ pubs 2%

Inequality Is Getting Worse

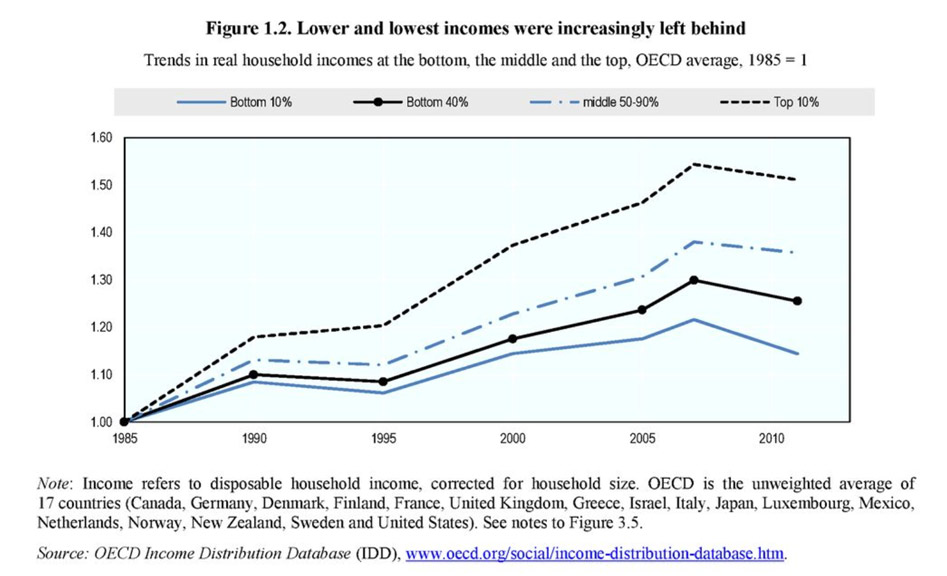
The latest OECD report on inequality was released today. The richest 10% of the population now earn 9.6 times the income of the poorest 10%; this ratio is up from 7:1 in the 1980s, 8:1 in the 1990s and 9:1 in the 2000s.  Tight fiscal conditions have resulted in social spending cuts, including in areas targeted to the most disadvantaged. In 2012, the bottom 40% owned only 3% of total household wealth in the 18 OECD countries which have comparable data. By contrast, the top 10% controlled half of all total household wealth and the wealthiest 1% held 18%! Wealth is considerably more concentrated than income, exacerbating the overall disadvantage of low-income households.

OECDInequalityMay2015At the launch, Angel Gurría, Secretary-General, OECD said:

For years now we have been underlining the toll that inequality takes on people’s lives. And I am proud of the contribution that the OECD has made in recent decades, putting inequality at the heart of the political and economic debate. Our 2008 report, Growing Unequal? sounded the alarm on the long-term rise in income inequality; and in 2011 Divided We Stand sought to diagnose the root causes that lay behind it.

But now we need to move the conversation forward. This is why today we are launching our new report In It Together: Why Less Inequality Benefits All in which we underline the toll that ever-rising inequality takes on people’s lives and the wider economy. But more than that, this report proposes concrete policy solutions to promote opportunities for more inclusive growth.

Where we stand: Trends in inequalities

Let me first remind you of the scale of the challenge. The latest data from In It Together make for stark reading. The richest 10% of the population now earn 9.6 times the income of the poorest 10%; this ratio is up from 7:1 in the 1980s, 8:1 in the 1990s and 9:1 in the 2000s.

During the early years of the crisis, redistribution via tax and transfer systems was reinforced in many countries. But now it is weakening again; tight fiscal conditions have resulted in social spending cuts, including in areas targeted to the most disadvantaged.

Even in those emerging economies where inequality has fallen, like Chile or Brazil, inequality remains at staggeringly high levels (26.5:1 in Chile and 50:1 in Brazil).

The story behind wealth is even worse. In 2012, the bottom 40% owned only 3% of total household wealth in the 18 OECD countries which have comparable data. By contrast, the top 10% controlled half of all total household wealth and the wealthiest 1% held 18%! Wealth is considerably more concentrated than income, exacerbating the overall disadvantage of low-income households.

The situation is economically unsustainable

In It Together finds compelling evidence that high inequality harms economic growth. The rise in inequality observed between 1985 and 2005 in 19 OECD countries knocked 4.7 percentage points off cumulative growth between 1990 and 2010. And what matters for growth is not just the poorest falling behind. In fact, it is inequality affecting lower-middle and working class families. We need to focus much more on the bottom 40%; it is their losing ground that blocks social mobility and brings down economic growth.

We have reached a tipping point. Inequality can no longer be treated as an afterthought. We need to focus the debate on how the benefits of growth are distributed. Our work on inclusive growth has clearly shown that there doesn’t have to be a trade-off between growth and equality. On the contrary, the opening up of opportunity can spur stronger economic performance and improve living standards across the board!

Policies to promote inclusive growth

In It Together identifies four key policy areas to promote opportunities for more inclusive growth.

First, to increase equality of opportunity and boost our economies it will be absolutely essential to enhance women’s participation in economic life. Overcoming gender inequalities is vital to improving long-term growth prospects and has a profound impact on inequality. If the share of households with a working woman had remained at the levels of the early 1990s, the rise in income inequality would have been almost 1 Gini point higher, on average. And the fact that more women have worked full-time and earned higher wages since 1990 has limited the rise of inequality by an additional Gini point. But we cannot be happy with the slow pace of change.

Governments should be asking themselves whether they can afford to waste the potential of the many women who are excluded from the labour market. To help women make the best use of their talents, we need to make good quality and affordable childcare available and also encourage more fathers to take parental leave. 

Second, labour market policies need to address working conditions as well as wages and their distribution. Before the crisis, employment was at record highs in many OECD countries but inequality was rising. The increase in non-standard work was one of the culprits. In 2013, about a third of total OECD employment was in non-standard work, with about equal shares of temporary jobs, permanent part-time jobs and self-employment. Youth are the most affected group: 40% are in non-standard work and about half of all temporary workers are under 30.

Non-standard jobs are not always bad jobs, but work conditions are often precarious and poor. Low-skilled temporary workers, in particular, have much lower and unstable earnings than permanent workers. This would be less troubling if non-standard jobs were simply stepping stones to better and well-paying careers. But for the young, the part-time or self-employed worker this is often not the case. And among those on temporary contracts in a given year, less than half had full-time permanent contracts three years later.

The challenge is therefore not only the quantity, but also the quality of jobs. Better social dialogue and improved work conditions across the income range are crucial elements of an inclusive employment strategy.

Third, we cannot afford to neglect the education and skills of any part of our societies.  A focus on education in early years is essential to give all children the best start in life. This investment needs to be continued throughout the life cycle to prevent disadvantage, promote better opportunities and educational attainment.

In it Together  provides new evidence that high inequality makes it harder for lower-middle and working class families to invest in education and skills. An increase in inequality of around 6 Gini points reduces the time children from poorer families spend in education by about half a year. And it also lowers the probability of poorer people graduating from university by around four percentage points. This leads to an ever widening gap in education and life-time earnings.

Last but not least, governments should not hesitate to use taxes and transfers to moderate differences in income and wealth. There has been a fear that redistribution damages growth and this has led to a long-term decline in redistribution in many countries.  Our work suggests that well-designed, prudent redistribution need not harm growth. As top earners now have a greater capacity to pay taxes than before, governments should ensure that they pay their fair share of the tax burden.

We do not need new instruments, we simply need to use the ones we have: scaling back tax deductions, eliminating tax exemptions, increasing marginal tax rates, using property taxes and above all, ensuring greater tax compliance. And let’s not forget government transfers. They play an important role in guaranteeing that low-income households do not fall too far behind.

Ladies and gentlemen, ever rising inequality can be avoided. It is for us to re-imagine and create our economies anew, so that each and every citizen regardless of income, wealth, gender, race or origin is empowered to succeed.

Governments around the world need to take decisive action to promote inclusive growth. In that spirit, I urge each and every country to recognise that when it comes to economic prosperity we are not in it alone, we are “In It Together”.

Mortgage Discounts Still Running Hot

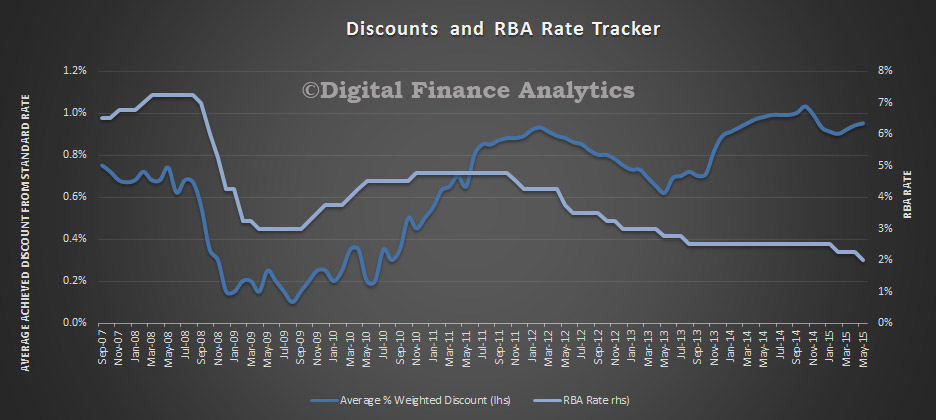
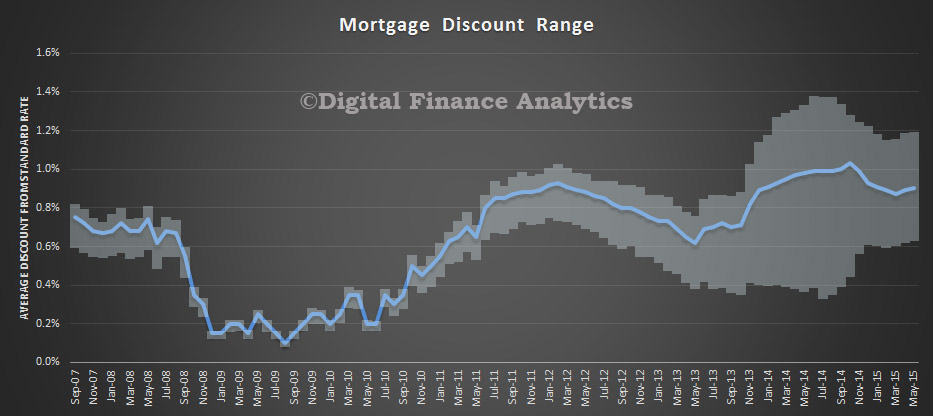
Latest data from the DFA household surveys highlights that many prospective borrowers are still able to grab significant discounts on new or refinanced home loans. The chart below shows the weighted average achieved across loans written, compared with the RBA cash rate. Despite the recent falls, discounting is still rampant.

MortgageDiscountRateMay2015However, we also see significant differences between players and across different customer segments and loan types. Not all households are getting the larger cuts. Discounts also varies by LVR and channel of origination, with those using a broker, on average, doing a little better.

MortgageDiscountsMay2015The deep discounting flowed through to some margin compression in the recent results from the banks, and falls in deposit margins, as they continue to attempt to grab a larger share of new business. Households with a mortgage of more than a couple of years duration would do well to check their rate against those currently on offer in the highly competitive market. Even after switching costs, they may do better.

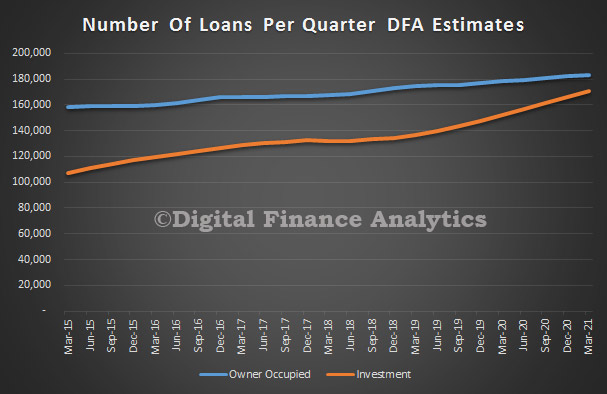
We also updated our strategic demand model, and our trend estimates for mortgage numbers out to 2020. We expect to see investment loan growth containing to run faster than owner occupation loans. Over the medium term we expect the number of owner occupied loans to grow at an average of 2.8%, and investment loans at 7.8% per annum over this period.

DFAScenariosMay2015Behind the model we have made a number of assumptions about population growth, capital demands, house prices and economic variables, as well as the demand data from our surveys. Significantly, much of the demand is coming from those intending to trade down, buying a smaller place, AND a geared investment property. We will update the segment specific demand data in a later post.

Oil Prices And Their Economic Impact

How will lower oil prices flow through into inflation, growth and economic activity? Will monetary policy need to adjust to take account of oil price movements, or should these short term movements be isolated from inflation targetting? All important questions.

In a speech given today to the AIECE Conference in London, Martin Weale, External member of the Monetary Policy Committee, discusses two key issues for the inflation outlook in the UK: the impact of oil price moves on the UK inflation forecast, and the degree to which international prices feed through into the outlook in this country.

Weale’s arguments derive from models he believes offer a more realistic sense of the probability of relatively extreme movements in prices occurring than implied by more popular methods in economics – a lesson economists should have learned from the financial crisis. He states: “It might seem like a technical point, [but] it is in fact fundamental: if you seriously underplay the chance of relatively extreme events happening, then not only will you be more surprised when they do happen, but you may be tempted to read too much into them.”

Weale’s model for the impact of oil prices on the macroeconomy – drawing on long run data beginning in 1970 – indicates there is a risk that the impact of the oil price fall we have witnessed will be somewhat stronger in the near term than the MPC has predicted. The result, he concludes, would be that growth for 2015 would prove a little stronger, and inflation a little weaker, than expected.

However, Weale states that the risk of a slightly weaker profile for inflation has little impact on his outlook for policy, as the effect will have dissipated within two years – the relevant point for policymaking.

Turning to the international context, Weale investigates how far inflation in the UK is determined independently of what happens in other advanced economies.

Weale notes that the correlation between inflation in the UK and other OECD countries has been relatively high since 2008 – and more so over the past eighteen months.

However, he finds that there is relatively limited statistical evidence that the correlation is strong over the longer-run. Using data from 1993 to the present, he notes that the variability of core inflation in other rich countries can account for only about a seventh of the variability of UK core inflation.

Summing up, Weale states that the MPC must weigh the need to respond to these international factors, against the desire to provide some stability in the level of interest rates and output.

He adds: “I think the Committee is quite right to let the short-term effects of external shocks feed into inflation, even if this pushes it far from target, whether on the downside as now, or on the upside as in the crisis. To do otherwise, and tighten or loosen aggressively, would do little to help inflation in the short term, but would risk a lot with unwanted gyrations in output.”


Super Tops $2 Trillion

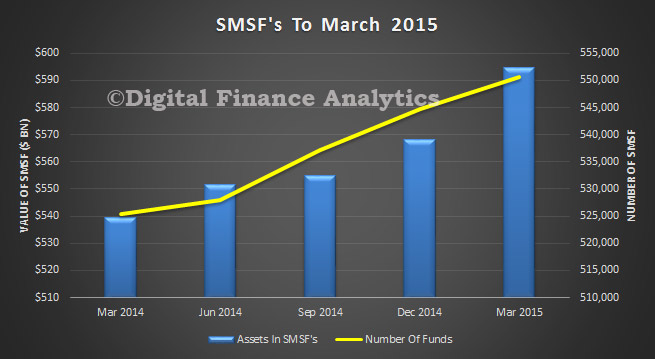
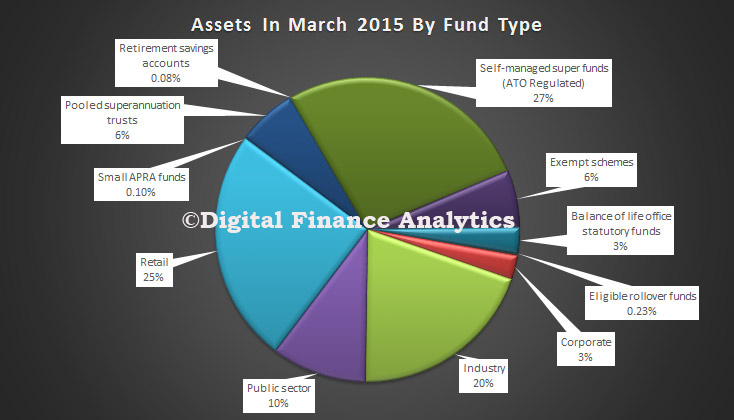
APRA released their quarterly superannuation stats today. Superannuation assets totalled $2.0 trillion at the end of the March 2015 quarter, up by $115 billion from December. Self Managed Super Funds continued to power ahead, both in number of funds (up by 5,911 funds) and value (up $26.6 billion), though relative share fell slightly.

Over the 12 months from March 2014 there was a 14.3 per cent increase in total superannuation assets. The total value lifted $115 billion in the last 3 months.

Total assets in MySuper products totalled $420.2 billion at the end of the March 2015 quarter. Over the 12 months from March 2014 there was a 23.1 per cent increase in total assets in MySuper products.

There were $23.7 billion of contributions in the March 2015 quarter, up 4.4 per cent from the March 2014 quarter ($22.7 billion). Total contributions for the year ending March 2015 were $101.6 billion.

Outward benefit transfers exceeded inward benefit transfers by $641 million in the March 2015 quarter.

There were $14.4 billion in total benefit payments in the March 2015 quarter, an increase of 9.2 per cent from the March 2014 quarter ($13.2 billion). Total benefit payments for the year ending March 2015 were $57.5 billion.

Net contribution flows (contributions plus net benefit transfers less benefit payments) totalled $8.7 billion in the March 2015 quarter, a decrease of 1.4 per cent from the March 2014 quarter ($8.8 billion). Net contribution flows for the year ending March 2015 were $39.3 billion.

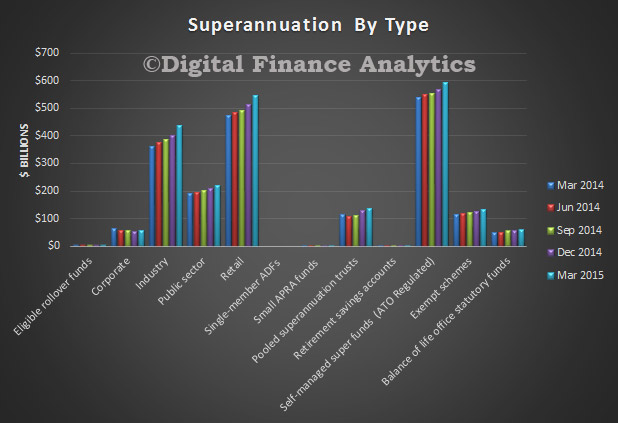
Looking at the splits, the trend growth was strong in industry, retail and SMSF.

SuperByTrendTypeMar2015Looking at SMSF, both asset values and number of funds show a steady rise.

SMSFa-Mar-2015However whilst 27% of all superannuation funds are now held in SMSF, this decreased by 1% from a year ago.

SuperSplitsMar2015The annual industry-wide rate of return (ROR) for entities with more than four members for the year ending March 2015 was 13.0 per cent. The five year average annualised ROR to March 2015 was 8.0 per cent.

As at the end of the March 2015 quarter, 52 per cent of the $1.35 trillion investments for entities with at least four members were invested in equities; with 24 per cent in Australian listed equities, 22 per cent in international listed equities and 5 per cent in unlisted equities. Fixed income and cash investments accounted for 32 per cent of investments; 19 per cent in fixed income and 13 per cent in cash. Property and infrastructure accounted for 12 per cent of investments and 4 per cent were invested in other assets, including hedge funds and commodities.

Card Payments Regulation

A speech was delivered today by Malcolm Edey, at the Cards & Payments Conference in Melbourne following on from the Murray Inquiry and the Reserve Bank Payments System Board (the PSB) own review following on from the Murray recommendations. As the PSB’s review process is still underway, Edey did not pre-empt any conclusions that might come from that. Instead he over viewed the PSB’s general approach to retail payments since it first entered the field. His comments on more recent developments does give some clues to issues ahead however, with specific reference to NPP, interchange arrangements and surcharging.

The PSB more recently undertook its Strategic Review of Innovation in the Payments System, the results of which were published in 2012. That review was conducted over a two year period and involved extensive consultations with both the payments industry and with users of payments services. It found a number of areas where there was scope for system improvements that could be achieved through coordinated action.

The key areas were:

  • same-day settlement of direct entry transactions;
  • faster payments and out-of-hours payments to be made generally available;
  • capacity for richer information with payments; and
  • an easy addressing solution for electronic payments.

The first one of these was delivered at the end of 2013 and essentially involved an acceleration of existing direct entry processes. The remaining three form a more ambitious agenda and are together being taken up as part of the industry’s New Payments Platform (the NPP project).

The NPP is a successful example of what can be done through collaboration between the industry and its regulator. It is also a good example of the catalyst role for the PSB in promoting system innovation that was envisaged by Wallis. While it is an industry-led project, it is strongly supported by the PSB, and the Board continues to encourage commitment to the project and to its timely completion.

The project was launched in early 2013 and is now well advanced. On current scheduling the NPP will deliver a fast payments service with rich information and addressing capabilities in the second half of 2017. It will be linked to a fast settlement service provided by the Reserve Bank, which will allow transactions to be cleared and settled 24/7 in close to real time. All of this will amount to a world-class payments infrastructure.

It will also be a platform for further innovation. One of the key decisions made at an early stage of the project was to separate the basic clearing and settlement infrastructure from the commercially based overlay services that would use it. The industry is committed to an initial overlay that is intended to provide an attractive service and drive early volume growth. But it is important to note that access to the overlay space has always been intended to be open and competitive. Over time, this structure will allow new and specialist providers to make use of the rich capabilities provided by the core infrastructure.

Before moving on to some more detailed regulatory matters, I will mention one more initiative to have come out the 2012 Strategic Review, and that is the establishment of new industry coordination and consultation arrangements. In line with a recommendation from the 2012 Review, a new industry coordination body, the Australian Payments Council, was launched last year. The Council is a high-level body representing a diverse range of industry participants including banks, payment schemes and other service providers. It will have the capacity to give strategic direction to the industry as well as engaging in dialogue with the PSB. At the same time, it is important that the policy process engages with users and not just suppliers of payment services. To facilitate that, the Reserve Bank has also set up a Payments User Consultation Group which began meeting late last year.

In summary then, the policy work of the PSB has been very much consistent with the philosophy and objectives of the original Wallis reforms. A good deal of that work has been what might be termed ‘co-regulatory’ in nature, in the sense that it involved promoting industry-led solutions rather than using formal regulatory powers.

But of course the PSB does have a regulatory mandate, and it has used its powers to regulate a number of aspects of card payments where it judged that there was a public interest case to do so. Probably the aspects of this regulation that have attracted the most attention have been those related to interchange and surcharging, and I would like to make some general comments about each of these.

First, interchange. The commercial function of interchange fees is a very interesting one. They serve as a device for shifting the benefit-cost balance between issuers and acquirers in a four-party scheme and therefore, indirectly, between cardholders and merchants. Payment schemes argue that this can be an important competitive device that can promote innovation, for example by being structured to encourage network growth or the take-up of new products. Typically, interchange flows from the acquirer to the issuer, and hence the fee structure tends to encourage issuance and use of a card, but may discourage acceptance by merchants if the fee is too high. For mature schemes, however, the capacity of merchants to refuse acceptance may be quite limited. As a result, it has been frequently observed that competition between schemes can have the effect of pushing fees up rather than down, in order to maximise incentives to issuers and cardholders.

The reason that this kind of outcome is possible is that there is a misalignment between the incidence of these fees and the structure of decision-making power in a typical transaction. In a nutshell, the cardholder chooses the payment instrument but the merchant pays the fee.

In designing its card payment reforms, both for credit and debit, the PSB concluded that competition of this nature was distorting price signals in a way that inefficiently encouraged the use of high cost cards and added to merchant costs. Hence, it judged that there was a case for interchange fees to be capped by regulation. A number of other jurisdictions have since taken a similar view.

The second aspect that I want to talk about is surcharging. The PSB has consistently taken the view that merchants should not be prevented from surcharging for higher-cost payment methods. Scheme rules that prohibited surcharging had the effect of reinforcing the distortive effects of interchange fees by preventing costs from being passed on to cardholders. They also reduced the flexibility of merchants in deciding how to respond to high-cost payment instruments. The ability to surcharge improves merchants’ bargaining position by allowing them a greater range of responses, rather than just being faced with a binary decision to accept or reject a particular card.

Efficient surcharging should of course reflect the underlying payment cost. The PSB’s initial reforms to credit and debit gave merchants the right to surcharge, while effectively relying on competition to ensure that surcharging would not be excessive. This regulation was revised in 2013 in response to concerns about practices that had developed since the initial reforms, particularly about surcharging that appeared excessive or unrelated to costs. The amended regulation still prevents schemes from imposing no-surcharge rules, but it allows them to limit surcharging to the reasonable cost of acceptance. In doing so it strikes a balance, at least in principle, between the rights of merchants and schemes. Merchants cannot be prevented from recovering reasonable acceptance costs, but they can be prevented by scheme rules from going beyond that. More on that in a moment.

The PSB’s reforms to surcharging and interchange have formed part of a broader package that also included rules relating to access and transparency. I don’t have time to cover all of that today. But taken together, the effects have been beneficial. The system has continued to innovate, and merchants’ card payment costs have fallen.[3] It is also notable that these costs are significantly lower in Australia than in a jurisdiction like the United States, where reforms to card systems have been much more limited.

The Murray Report last year broadly endorsed the PSB’s reform approach while flagging a number of areas for further consideration, particularly in relation to surcharging and interchange. These have now been taken up as part of the PSB’s card payments review.

The issue of surcharging remains contentious. Instances of apparently excessive surcharging have persisted. While they acknowledge arguments for what might be called a ‘no excessive surcharge’ regime, the schemes have argued that the current formulation is too complicated and difficult for them to enforce.

The card payments review is looking at several possible mechanisms for addressing this. One option proposed by Murray is a tiered approach that would allow tougher surcharging constraints to be placed on low-cost cards. A number of other options are available to strengthen enforcement and disclosure practices, for example allowing schemes to cap surcharges that are not percentage based at some low fixed amount.

On interchange fee regulation there are a number of issues to consider. These include the overall level of the interchange cap, the complexity and proliferation of interchange categories, the phenomenon of interchange ‘drift’ with the three-year compliance cycle, and the wide disparity between interchange rates for preferred merchants and those applying to others.

While it broadly endorsed the PSB’s regulatory approach to date, the Murray Report recommended that consideration be given to tightening existing interchange regulations in some significant respects. These included lowering the overall interchange cap, and broadening its coverage to include other incentive payments that serve a similar function. It argued that this would help to prevent circumvention and, in the case of companion card arrangements, would improve competitive neutrality.