The conventional wisdom amongst financial market observers, academics, and journalists is that a steeper yield curve should be good news for bank profitability. The argument goes that because banks borrow short and lend long, a steeper yield curve would raise the wedge between rates paid on liabilities and received on assets – the so-called “net interest margin” (or NIM). In this post, we present cross-country evidence that challenges this view. Our results suggest that it is the level of long-term interest rates, rather than the slope of the yield curve, that drives banks’ NIMs.
Net interest margins are calculated as the interest banks earn on their assets—e.g. on the loans they make — minus the interest they pay out on their liabilities – e.g. the interest they pay to savers. Meanwhile, the slope of the yield curve is defined as the difference between the long-term interest rate (10 year government bond) and a short-term rate.
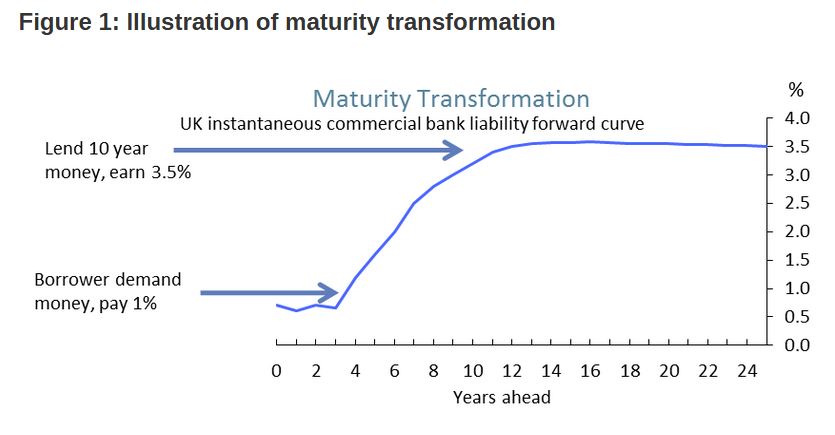
The conventional wisdom follows from banks’ fundamental business model— to act as maturity transformers by borrowing short term (e.g. from deposit accounts) and lending long term (e.g. through mortgages or loans to companies). This activity is typically profitable as short-term interest rates are usually lower than long- term interest rates. This reflects the fact that depositors are generally willing to sacrifice returns because they value the liquidity of holding their money in cash rather than in an illiquid investment. Figure 1 illustrates this with the aid of a stylised yield curve. In the example, a bank issues a loan at 3.5%, matched with bank deposits of shorter maturities offering an interest rate of 1%. If the long rate rose to 5%, it would steepen the yield curve, increase the interest rate spread between lending and borrowing, and increase the NIMs.
It is worth noting that we wouldn’t expect this theoretical relationship, between the slope of the yield curve and NIMs, to hold perfectly in the real world. For example, NIMs capture much more than just the gains of maturity transformation. For example, NIMs also reflect the rewards banks collect for bearing different types of risk (e.g. credit risk).
Stemming from this understanding of maturity and liquidity transformation Bill English observes that this intuitive positive relationship has been the conventionalwisdom for some time.
We find no systematic positive relationship between the slope of the yield curve and NIMs
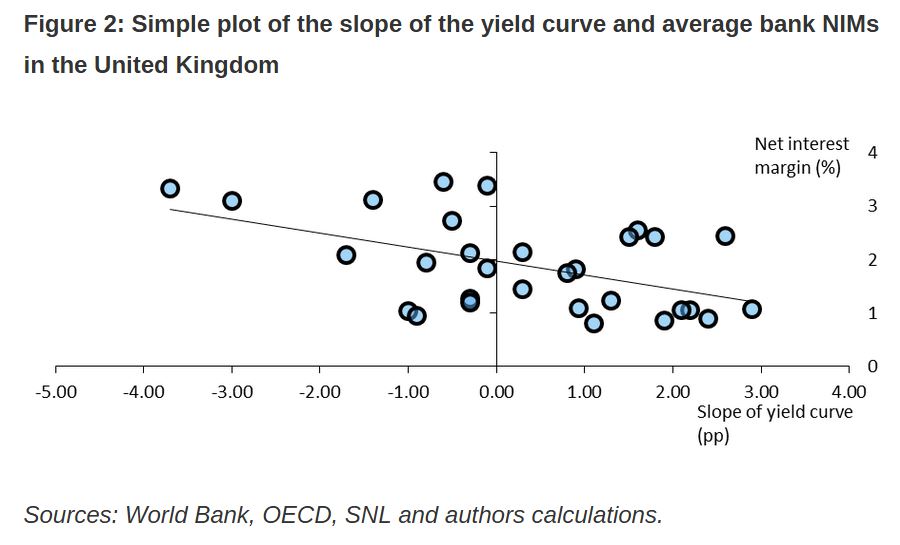
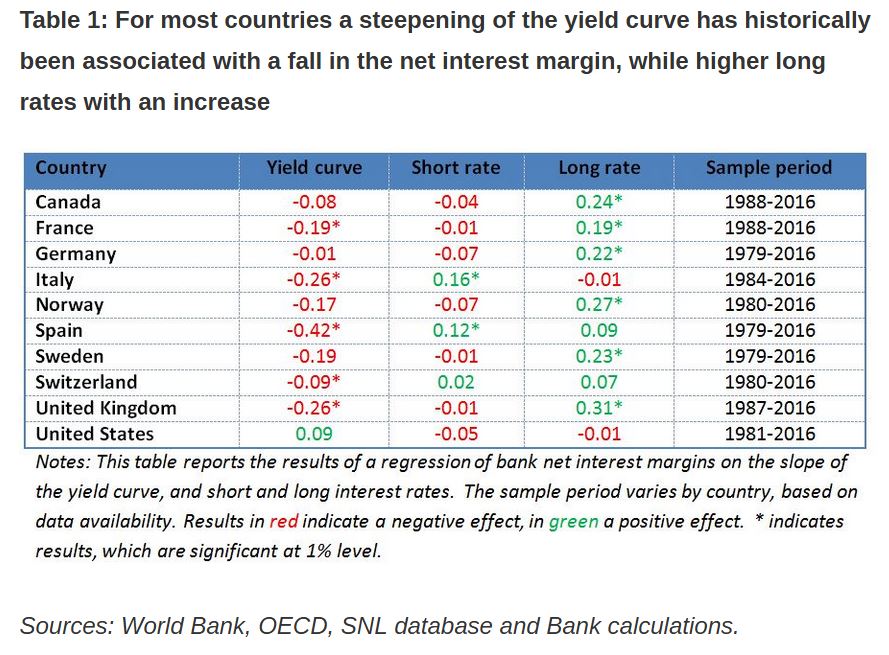
However, a very simple plot of the slope of the yield curve and the NIM does not deliver a positive relationship (Figure 2). Instead, the slope goes the wrong way – it is negative for the UK confirmed by a simple regression – suggesting that an increase in the slope of the yield curve lowers the NIM. Indeed Table 1 (below) shows that this negative relationship arises in all countries in our sample bar the US, a point observed by a Liberty Street Economics blog post.
It is worth noting that in recent decades the countries in our sample have been through large economic, structural and policy changes, such as the introduction of inflation targeting, and changes in competition, financial liberalisation and regulation. These changes no doubt will have some impact on the slope of the yield curve and its relationship with NIMs, but those are beyond the scope of this article.
2) So how do interest rates affect NIMs?
Motivated by this discovery, we sought to inspect how the individual components of the slope of the yield curve (the short and long rate) affect NIMs. We find that the long rate is more important than the short rate in determining NIMs in a very simple regression model. The long rate has a higher coefficient and is statistically significant for most countries. The short rate is closer to zero and is insignificant for most countries, apart from Italy and Spain. Overall though, we find that a steepening of the yield curve is generally associated with a fall in the NIM (Table 1).
From this we conclude that, when it comes to interest rates, the long-term interest rate (unlike the short-term interest rate and the slope of yield curve) has a substantial positive impact on bank NIMs. This finding helps to explain why an upwards parallel shift in the yield curve is good for net interest margins (because while the slope does not change the long rate goes up). It is worth remembering that the results are driven by the average maturity and composition of assets and liabilities of bank balance sheets. If the structure of their balance sheets changes, so too might these results.
What do these findings tell us about the past and the future?
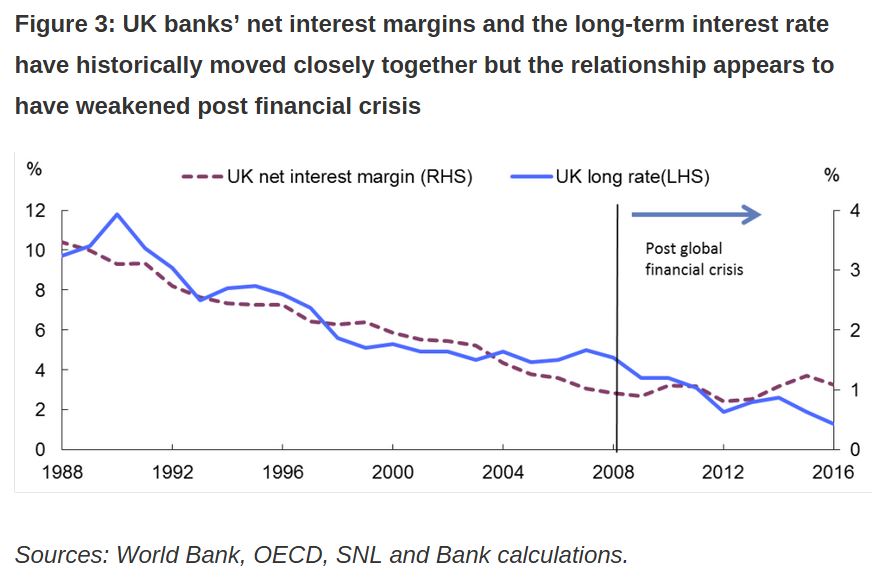
The long rate in many economies has fallen gradually over time since the late 1980s. Our simple empirical results suggest that there would be a corresponding fall in bank NIMs. Figure 3 shows that while that relationship held in the UK prior to the financial crisis, it appears to have broken down since – as the NIM has flattened out in recent years, despite the continued fall in the long rate. This isn’t just a UK phenomenon — NIMs in other countries have remained relatively stable since the global financial crisis too, despite falling long-term interest rates in these economies (Figure 4). This may be because of the large macroeconomic and financial shocks that affected banks, or because banks have changed their business models and the structure of their balance sheets. This is beyond the remit of this article. In light of this caveat it is hard to say with certainty whether this observed relationship between long rates and NIMs will reinstate itself or not; it is too early to tell.
Conclusions
Some central banks, such as the Fed and the Bank of England, have started the tightening phase of monetary policy, which has been associated with a steepening of the yield curve. The commonly held view is that such a steepening of the yield curve should be unequivocally good news for bank profitability because it raises banks’ net interest margins. This article challenges that conventional wisdom. Using data for a panel of 10 countries over four decades, we find no systematic positive relationship between the slope of the yield curve and bank net interest margins. Instead, we find that long-term interest rate tend to drive bank margins. But even this latter relationship has weakened since the global financial crisis. This suggests there is much uncertainty about the future relationship between interest rates and bank profitability.
Note: Bank Underground is a blog for Bank of England staff to share views that challenge – or support – prevailing policy orthodoxies. The views expressed here are those of the authors, and are not necessarily those of the Bank of England, or its policy committees.


