APRA has released the quarterly ADI performance statistics. On a consolidated group basis, there were 156 ADIs operating in Australia as at 30 June 2016, the same as a year before, despite some changes.
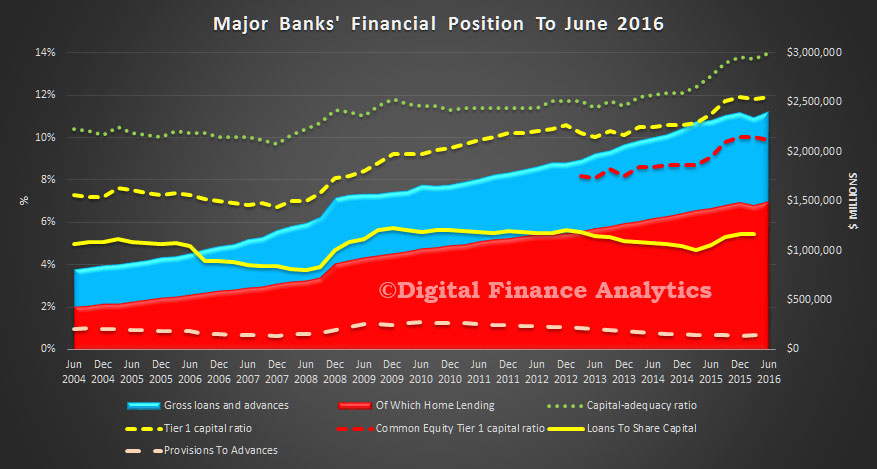
Here is a summary chart for the combined four majors to June 2016.
 We see a rise in gross advances, and higher tier 1 capital, though CET1 fell a little. Shareholder capital relative to the lending book rose slightly, but at 5.45% in June, the big banks remain highly leveraged businesses.
Looking more broadly across all ADI’s, the net profit after tax was $27.7 billion to 30 June 2016. This is a decrease of $10.4 billion (27.3 per cent) on the year ending 30 June 2015.
The cost-to-income ratio for all ADIs was 50.7 per cent for the year ending 30 June 2016, compared to 47.4 per cent for the year ending 30 June 2015 while the return on equity for all ADIs was 10.3 per cent for the year ending 30 June 2016, compared to 15.2 per cent for the year ending 30 June 2015.
The total assets for all ADIs was $4.64 trillion at 30 June 2016. This is an increase of $225.3 billion (5.1 per cent) on 30 June 2015. The total gross loans and advances for all ADIs was $2.98 trillion as at 30 June 2016. This is an increase of $139.0 billion (4.9 per cent) on 30 June 2015.
The total capital ratio for all ADIs was 14.1 per cent at 30 June 2016, an increase from 13.1 per cent on 30 June 2015. The common equity tier 1 ratio for all ADIs was 10.2 per cent at 30 June 2016, an increase from 9.5 per cent on 30 June 2015.
The risk-weighted assets (RWA) for all ADIs was $1.84 trillion at 30 June 2016, an increase of $31.1 billion (1.7 per cent) on 30 June 2015. Impaired facilities were $15.0 billion as at 30 June 2016. This is an increase of $0.6 billion (4.2 per cent) on 30 June 2015.
Past due items were $13.0 billion as at 30 June 2016. This is an increase of $0.7 billion (6.0 per cent) on 30 June 2015; Impaired facilities and past due items as a proportion of gross loans and advances was 0.94 per cent at 30 June 2016, unchanged from 0.94 per cent at 30 June 2015; Specific provisions were $7.1 billion at 30 June 2016. This is an increase of $0.6 billion (8.6 per cent) on 30 June 2015; and Specific provisions as a proportion of gross loans and advances was 0.24 per cent at 30 June 2016, an increase from 0.23 per cent at 30 June 2015.
