APRA released the quarterly banking performance statistics today, to December 2015. On a consolidated group basis, there were 157 ADIs operating in Australia as at 31 December 2015, compared to 159 at 30 September 2015 and 166 at 31 December 2014.
The net profit after tax for all ADIs was $36.8 billion for the year ending 31 December 2015. This is an increase of $2.4 billion (6.9 per cent) on the year ending 31 December 2014.The cost-to-income ratio for all ADIs was 49.4 per cent for the year ending 31 December 2015, compared to 49.2 per cent for the year ending 31 December 2014. The return on equity for all ADIs was 13.8 per cent for the year ending 31 December 2015, compared to 14.3 per cent for the year ending 31 December 2014.
The total assets for all ADIs was $4.58 trillion at 31 December 2015. This is an increase of $241.3 billion (5.6 per cent) on 31 December 2014.The total gross loans and advances for all ADIs was $2.95 trillion as at 31 December 2015. This is an increase of $206.4 billion (7.5 per cent) on 31 December 2014.
The total capital ratio for all ADIs was 13.9 per cent at 31 December 2015, an increase from 12.5 per cent on 31 December 2014.The common equity tier 1 ratio for all ADIs was 10.2 per cent at 31 December 2015, an increase from 9.1 per cent on 31 December 2014.The risk-weighted assets (RWA) for all ADIs was $1.87 trillion at 31 December 2015, an increase of $120.6 billion (6.9 per cent) on 31 December 2014.
For all ADIs, impaired facilities were $13.6 billion as at 31 December 2015 (chart 7). This is a decrease of $2.3 billion (14.6 per cent) on 31 December 2014. Past due items were $11.7 billion as at 31 December 2015. This is an increase of $317 million (2.8 per cent) on 31 December 2014. Impaired facilities and past due items as a proportion of gross loans and advances was 0.86 per cent at 31 December 2015, a decrease from 1.00 per cent at 31 December 2014. Specific provisions were $6.4 billion at 31 December 2015. This is a decrease of $543 million (7.9 per cent) on 31 December 2014; and specific provisions as a proportion of gross loans and advances was 0.22 per cent at 31 December 2015, a decrease from 0.25 per cent at 31 December 2014.
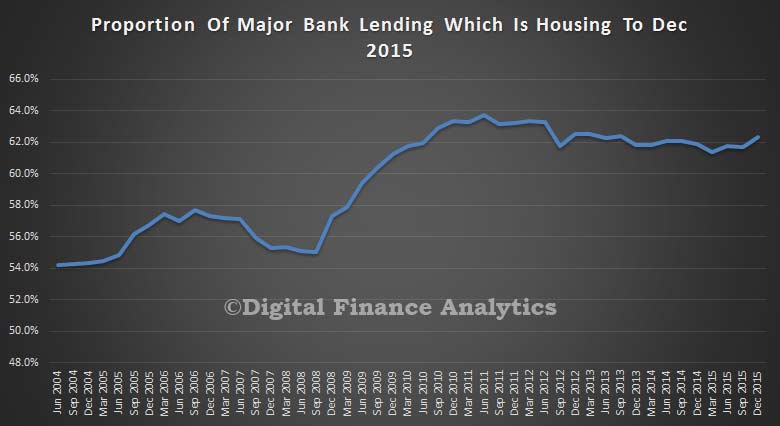
Turning to the big four major banks, we see that 62% of all of their lending is for housing (either owner occupied or investment), so they are highly concentrated in this sector of the market. Note the rise from mid-fifties in 2004, the peak in 2011, and the new upward trend in recent quarters. Banks have their eggs firmly in the residential property basket.
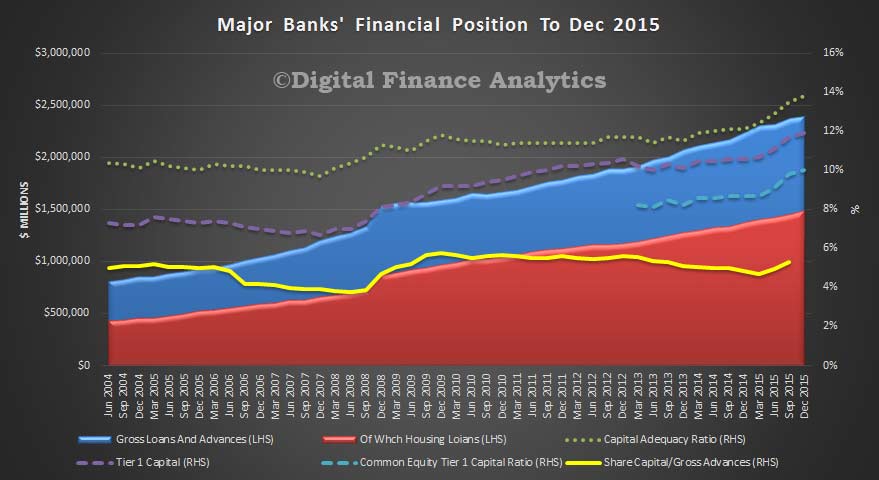
If we look at their ratios, we see capital rising, under the direction of the regulators, with the ratio of share capital to gross advances rising from 4.9% to 5.3%, but you can still see the highly leveraged state of the banks, and their absolute reliance on profits from home lending. For every $100 lent on housing, shareholders are risking $5. Not a bad proposition (for them).


