The latest data form APRA on the banks (ADI’s) portfolios for October 2015 tells us a little, but much is lost in the fog of adjustments which continue to afflict the dataset. In fact, APRA now points to the “corrected” numbers which the RBA publish.
” Some banks have reclassified housing loans that originated as investment loans to owner-occupied based on a review of customers’ circumstances or as advised by customers. See the Monthly Banking Statistics Important Notice for more information. These reclassifications will affect growth rates for investment and owner-occupied housing loans for October 2015. Questions about specific data should be directed to the relevant bank.
The Reserve Bank of Australia publishes industry-level housing loan growth rates in Growth in Selected Financial Aggregates. Table D1 in particular contains investment and owner-occupied loan growth rates, which have been adjusted for these reclassifications. Table D1 is available on the RBA website athttp://www.rba.gov.au/statistics/tables/index.html”
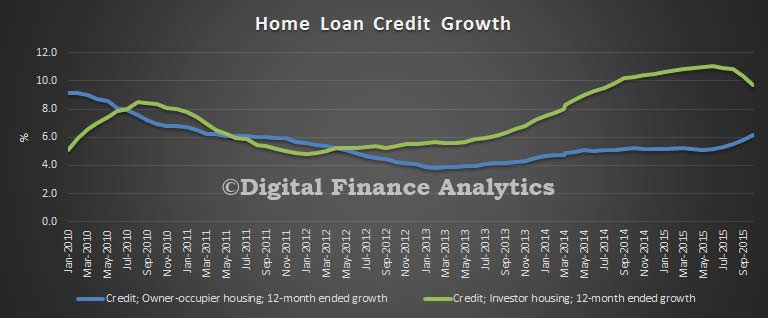
The RBA data shows that investment loans are probably growing a little below 10%, and owner occupied loans at about 6%.
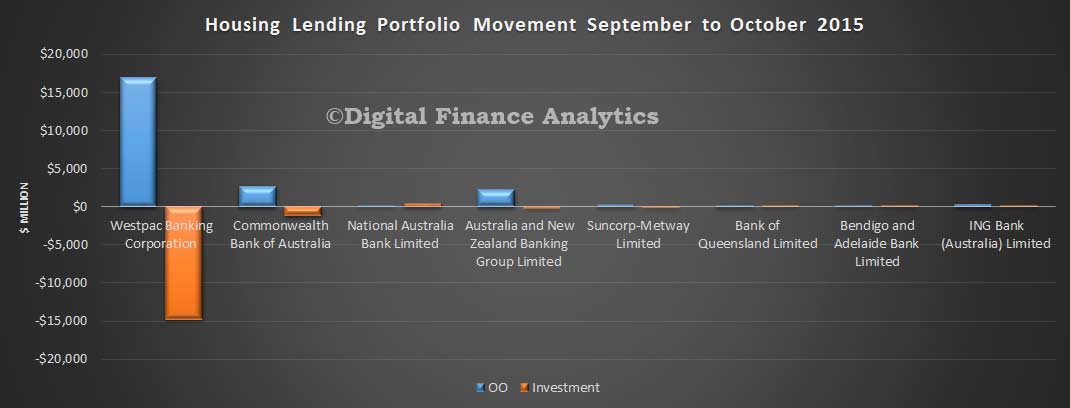
 The monthly banking stats do not contain these adjustments, so cannot be directly reconciled. However, some interesting points are worth noting nevertheless. First is that total lending for housing rose by 7.5 bn to 1.4 trillion in the month. The RBA lending figure for the whole market (including the non-banks) was 1.5 trillion. This is another record. Investment lending sits at 37% on these numbers. Net movements for OO loans was up 2.73%, whilst investment loans fell 2.95%.
Beyond that, if we take the APRA data at face value, then Westpac continues to reclassify loans. In the monthly movements we see more than $15bn swung into the owner occupied category, with an adjustment to the investment side of the ledger. There were smaller movements in the other banks, but some of this looks like further adjustments.
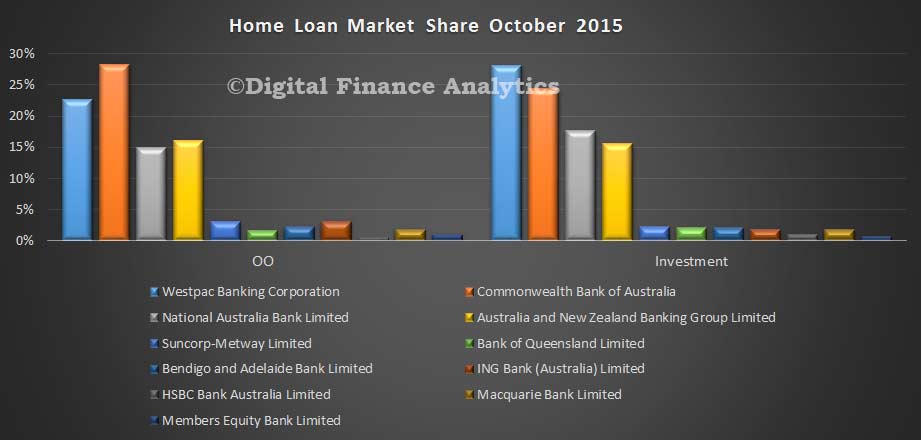
 So the current market shares are revised to:
 In our modelling of the monthly movements, based on the APRA data, where we sum the monthly movements for the past year (and include adjustments where we can), it appears Westpac is now in negative territory for investment loans, and that the growth rates for the other majors is slowing. The imputed annual market movement is 4.4% against the RBA data above of just under 10%.
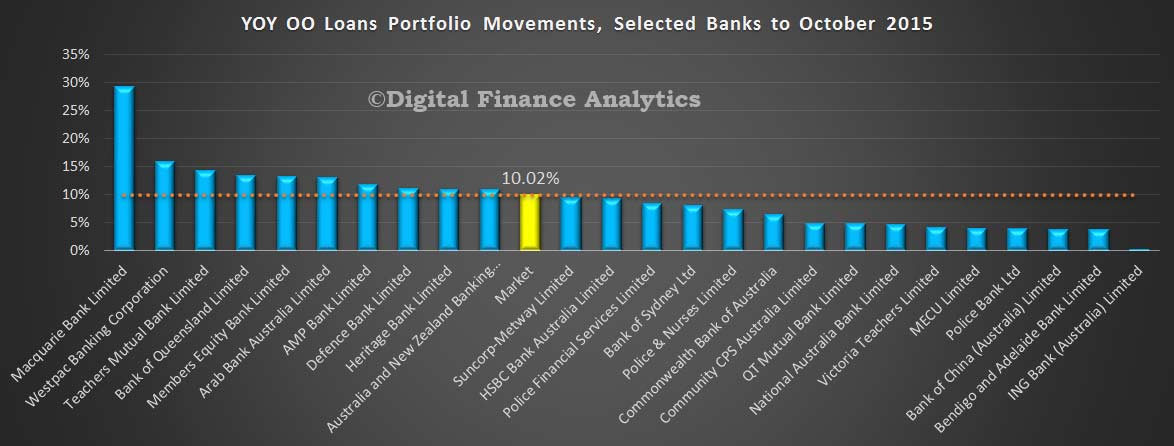
 For completeness we also show the owner occupied movements. These too are impacted by reclassifications, and the imputed growth rate is 10%, compared with 6% from the RBA.
 The net effect of all this is that there is no true information about what individual banks are doing in their loan portfolios. Having tried to talk to a couple of them to clarify the story, I discover they are not willing to share additional data and refer back to the [flawed] APRA data.
The convenient “fog of war” will continue for some time to come. There is also no way to cross-check the RBA adjusted data, and no underlying detailed explanations. We are just supposed to trust them!

2 thoughts on “Banks Continue the Mortgage Lending Party In A Fog”