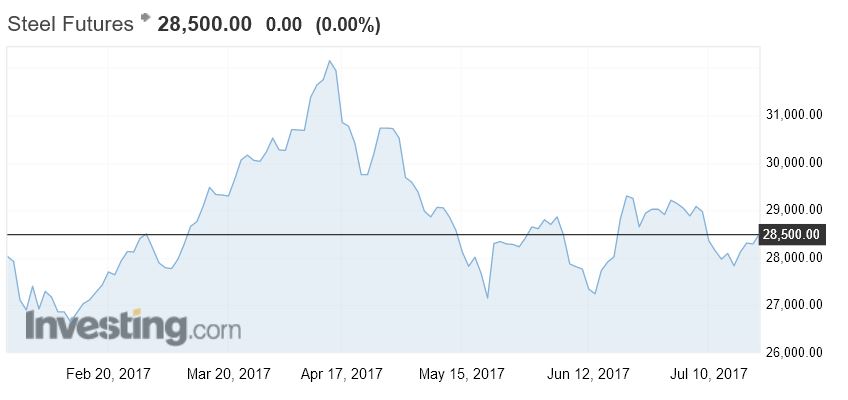
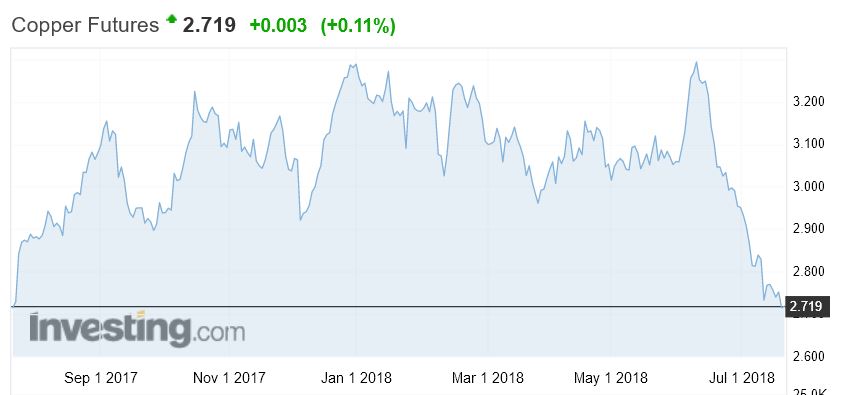
The trade wars are, according to Moody’s, already impacting base metals pricing, and may signal lower growth ahead.
 We can see falls from the charts.
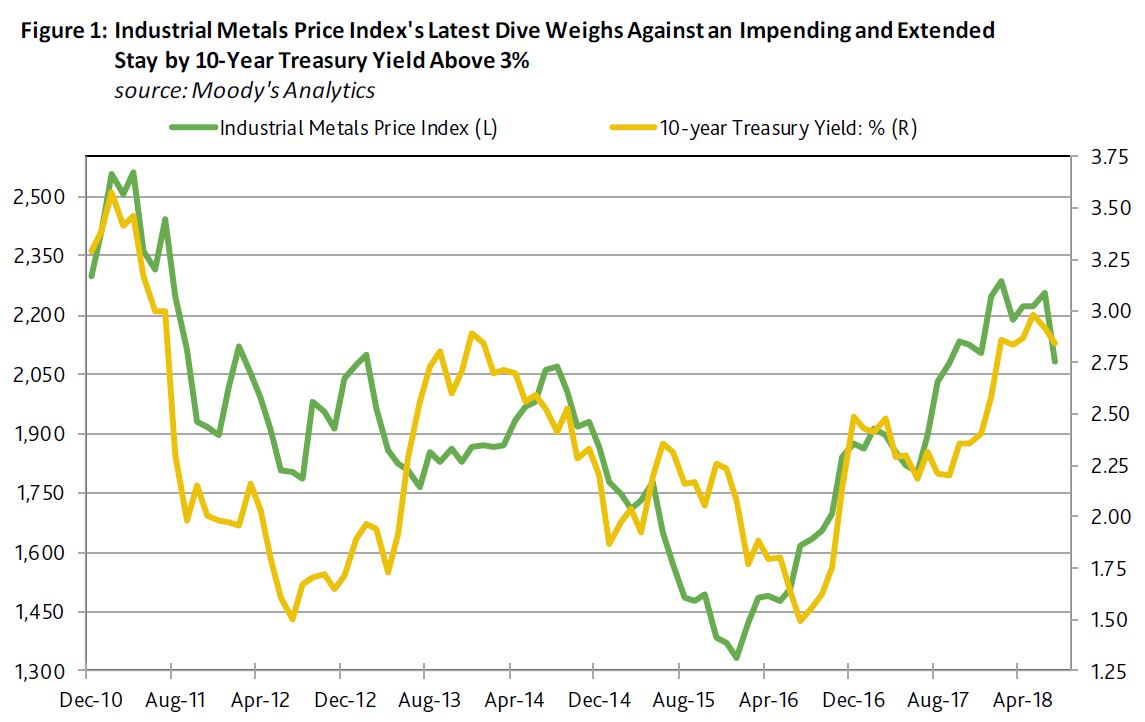
Though it goes practically unmentioned, one of the more unexpected developments of late has been the stunning collapse of Moody’s industrial metals price index. In part, the industrial metals price index’s average of July-to-date is a deep 8.2% under its June 2018 average because of uncertainties stemming from trade-related issues. Since worries surrounding a trade war came to the fore following June 14’s close, the base metals price index has sunk by 13.0%.
Nevertheless, the base metals price index’s month-long average had peaked some time ago in February 2018, where the subsequent slide by the index through mid-June reflected a loss of momentum for global
industrial activity.Moreover, the base metals price index’s improved performance since 2016 falls considerably short of its strong showing of 2010 and 2011. Though the industrial metals price index’s latest 52-week moving average tops its contiguous 52-week moving average of the span-ended July 17, 2017 by 19.9%, it remains 8.8% under its current recovery high for the span ended September 20, 2011. The latter 52-week observation overlapped very brisk annual growth rates for the world economy of 5.4% for 2010 and 4.3%
for 2011.The roughly 10% average annual increase by China’s real GDP of 2010-2011 goes far at explaining both 2010-2011’s average annualized advances of 4.9% for world economic activity and 27% for the industrial metals price index. By contrast, current consensus expectations call for a slowing of China’s economic growth from 2017’s actual 6.9% to 6.6% in 2018 and 6.4% in 2019. In turn, the IMF expects the world economy to grow no faster than 3.9% in both 2018 and 2019 following 2017’s 3.7% increase.
However, a consensus forecast compiled by Bloomberg News in mid-July projected slower rates of growth for world real GDP of 3.7% in 2018, 3.6% in 2019, and 3.3% in 2020. These projections for world growth seem to be inconsistent with the accompanying consensus forecast of a steady and uninterrupted climb by the 10-year U.S. Treasury yield from July 19’s 2.85% to 3.55% by the end of 2020.
Lower Industrial Metals Price Index May Block Higher Treasury Yields
Throughout the current business cycle upturn, advances by the 10-year Treasury yield have been difficult to sustain without an accompanying upswing by the industrial metals price index. For example, when the
10-year Treasury yield’s month-long average peaked for the current recovery at the 3.58% of February 2011, the base metals price index was merely 0.1% under its April 2011 high of the current upturn. In response to a 25% plunge by the base metals price index’s moving three-month average from April 2011 to December 2011, the 10-year Treasury yield’s accompanying three-month average sank from 3.48% to 2.05%, respectively.
Until the base metals price index approaches its latest high of February 2018, the 10-year Treasury yield is unlikely to remain at or above 3% for long. In fact, there is a very real possibility that by later this summer, the industrial metals price index may begin to record year-to-year declines, which in the past were often accompanied by year-to-year declines for the 10-year Treasury yield. A year-to-year decline by the base metals price index could arrive fairly soon. For example, July 18’s industrial metals price index was less than each of its previous month-long averages starting with August 2017. Over the course of just one month, the industrial metals price index’s yearly increase sagged from the 26.2% of June 18, 2018 to the 6.0% of July 18.
2015’s Bout of Industrial Commodity Price Deflation Swelled Spreads and Sank Equities
The last severe bout of base metals price deflation was linked to problems in China and an earlier run-up by U.S. Treasury bond yields, or the taper tantrum of 2013-2014. After setting a localized peak in August 2014, the industrial metals price index’s month-long average would ultimately plunge by a cumulative 35.5% before bottoming in January 2016. In addition, an even deeper 71.0% plummet by crude oil’s month-long average price from a June 2014 peak to a February 2016 bottom overlapped the slide by base metals prices.
The 2014-2015 episode of industrial commodity price deflation helped to shrink the moving yearlong sum of the pretax operating profits of U.S. nonfinancial corporations by 10.3% from a second-quarter 2015 top to a first-quarter 2017 trough. Even after excluding the especially hard hit petroleum and coal industries, the remaining operating profits of nonfinancial corporations sank by a cumulative 7.8% from 2015’s second quarter to 2017’s first quarter.
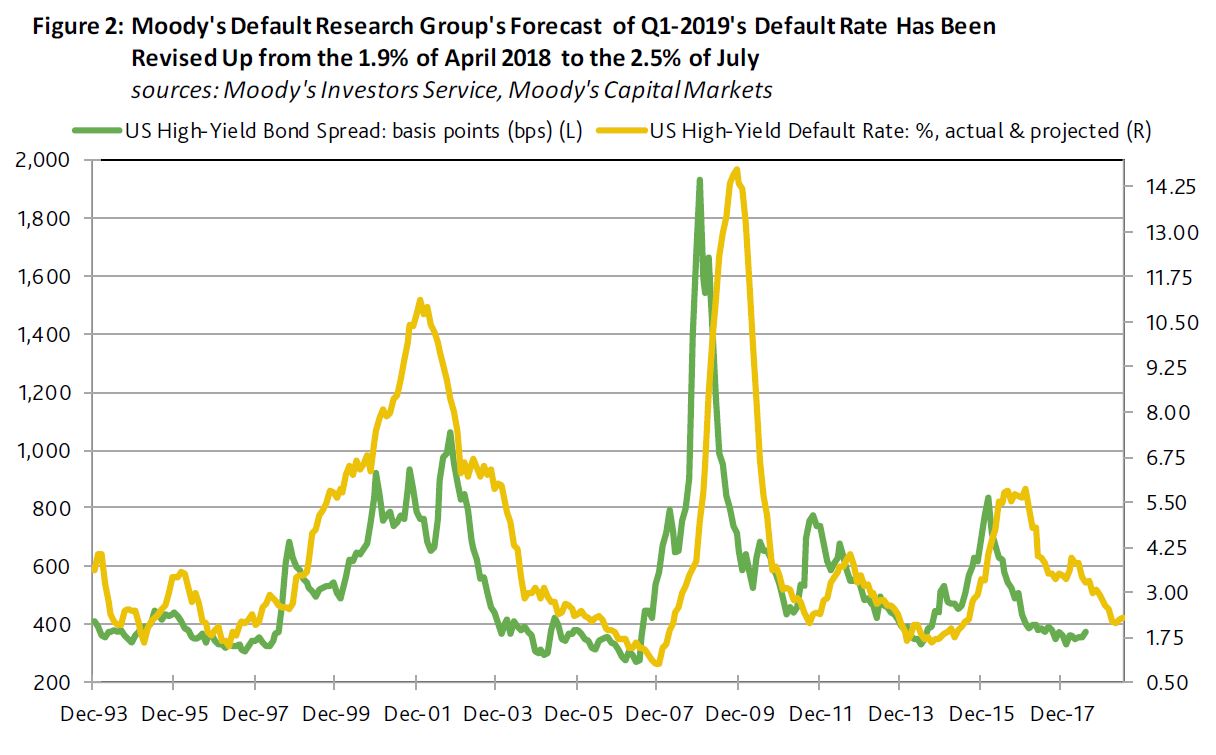
The combination of industrial commodity price deflation and the shrinkage of profits helped to drive the U.S.’ high-yield default rate up from September 2014’s now 10.5-year low of 1.6% to January 2017’s eight-year high of 5.9%. Moreover, the month-long averages of the high-yield bond spread and the longterm Baa industrial company bond yield spread ballooned from the 331 basis points and the 145 bp, respectively, of June 2014 to the 839 bp and 277 bp of February 2016. In addition, the month-long average for the market value of U.S. common stock sank by a cumulative 12.9% from a May 2015 high to a February 2016 bottom.
A subsequent recovery by operating profits helped to lower the default rate to June 2018’s 3.4%. And expectations of a further expansion of profits from current production now lend critical support to a likely continued slide by the default rate to 2.3% by June 2019.
Nevertheless, Moody’s Default Research Group has upwardly revised its default forecast. The predicted U.S. high-yield default rate for 2019’s first quarter has been ratcheted up from 1.9% as of April 2018 to 2.5% as of July. Still the latter would be significantly under the 3.8% average of 2018’s first quarter. Not only do expectations of yearly declines by the default rate constructive for corporate credit quality, they also lend support to equity market performance and systemic liquidity.


Maersk, the biggest container shipping company in the world, has already lost almost a third of its market value this year as the industry struggles with a variety of factors, including falling demand.
https://www.porttechnology.org/news/maersk_facing_tough_2nd_half_of_2018