Dwelling Approvals Fell In October

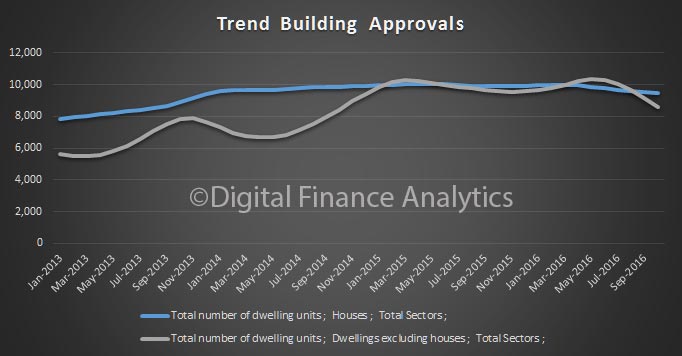
The ABS released their building approvals data for October today. The number of dwellings approved fell 3.3 per cent in October 2016, in trend terms, and has fallen for five months.

building-approvals-oct16

In trend terms, dwelling approvals decreased in October in South Australia (4.6 per cent), New South Wales (3.8 per cent), Queensland (3.6 per cent), Victoria (3.3 per cent), Western Australia (3.0 per cent), Tasmania (2.6 per cent) and Northern Territory (0.2 per cent), but increased in the Australian Capital Territory (4.5 per cent).

Approvals for private sector houses fell 0.6 per cent in October, in trend terms. Private sector house approvals fell in South Australia (2.5 per cent), Western Australia (2.3 per cent), New South Wales (0.5 per cent) and Victoria (0.1 per cent), but rose in Queensland (0.4 per cent).

In seasonally adjusted terms, dwelling approvals decreased 12.6 per cent in October, driven by a fall in total other residential dwellings (23.5 per cent). Total house approvals fell 2.5 per cent.

The value of total building approved fell 1.7 per cent in October, in trend terms, and has fallen for three months. The value of residential building fell 3.2 per cent while non-residential building rose 0.8 per cent.

New Home Sales Fall to Two-Year Low

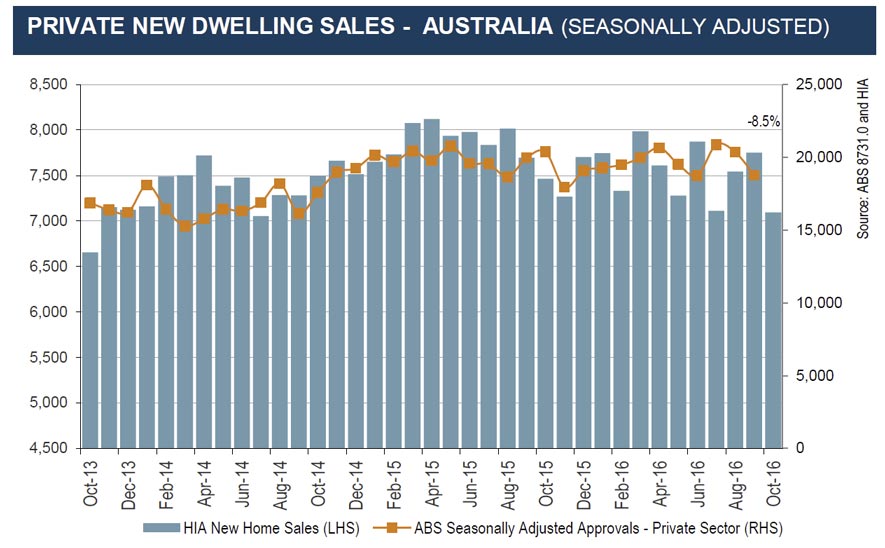
The Housing Industry Association’s monthly survey of Australia’s largest home builders indicates that new home sales dropped to a two-year low during the month of October.

hia-nov-16

“HIA New Home Sales fell by some 8.5 per cent during October 2016, the lowest volume of sales since July 2014,” remarked HIA Senior Economist, Shane Garrett.

“Sales on both sides of the market saw sizeable reductions during October,” explained Shane Garrett. “Detached house sales were down by 8.2 per cent during the month, while multi-unit sales fell by 9.2 per cent.”

“The reduction in the volume of new home sales is not unexpected, given that Australia is coming to the end of its longest and strongest new home building upturn,” Shane Garrett pointed out.

“October’s new home sales results are consistent with HIA’s latest forecasts for new home building starts which foresee a reasonably marked reduction in activity over the next couple of years. Even so, activity is projected to fall to a low point of around 172,000 new dwellings starts during 2018/19, about the same as the average of the past decade,” concluded Shane Garrett.

During October 2016, detached house sales fell in three of the five mainland states covered by the report. The largest reduction in sales volumes during the month was in Victoria (-20.4 per cent), with new detached house sales also falling in Western Australia (-5.6 per cent) and New South Wales (-2.8 per cent). New detached house sales rose by 4.5 per cent in Queensland during October, with a slight increase of 0.8 per cent in South Australia.

A State View Of Residential Construction

The ABS released their preliminary data on construction work done. It shows the seasonally adjusted estimate for total construction work done fell 4.9% to $46,147.8m in the September quarter.

abs-const-sep-16-allThe seasonally adjusted estimate of total building work done fell 5.7% to $25,886.6m in the September quarter.

The seasonally adjusted estimate for engineering work done fell 3.8% to $20,261.3m in the September quarter.

However, looking at the residential construction, we see the fall is not uniform across states. There were significant falls in VIC and WA, whilst in NSW and QLD residential construction activity continued to grow.

abs-const-sep-16-all-resiWithin this, houses played a major part…

abs-const-sep-16-houses… whilst other residential construction (apartments and units) fell.

abs-const-sep-16-otherNon residential construction also fell across the states.

abs-const-sep-16-non-resi

HIA Says Unit Construction Will Slow

HIA says from their peak of 117,000 in this calendar year multi-unit commencements are expected to fall by over 40 per cent by 2018/19.

“New residential building will slow for the next two years to bottom out at what will still be a historically healthy level of activity” said the Housing Industry Association.

The latest ”HIA National Outlook” released today takes a comprehensive look at conditions in the residential building and renovation markets around the country.

hia-construciton-nov-16

HIA Acting Chief Economist Warwick Temby said “notwithstanding the current uncertainties around the broader economic outlook, especially with the future US policy settings up in the air, HIA is forecasting a measured return to more normal levels of home building activity over the next couple of years.

“The recent peak in new home building was unprecedented: an all-time record 229,823 new residential dwellings started building in 2015/16. This record level of building has made a major contribution to Australia’s economic growth over the last few years and eased the under-supply of housing for both owner occupiers and renters that had built up over the previous ten years.

“Multi-unit building, especially apartments in the Eastern States, has driven much of the growth in this cycle and is also forecast to lead the slowdown in new activity over the next couple of years. From their peak of 117,000 in this calendar year multi-unit commencements are expected to fall by over 40 per cent by 2018/19.

“A softer landing is forecast for detached homes with 103,000 starts predicted for 2018/19, down 9 per cent on the peak this year.
“The forecast falls in new activity will not be uniform across the country; Western Australia and South Australia started their down-cycle well in advance of other states.

“Total new commencements are forecast to decline 3.1 per cent, 18.5 per cent and 5.1 per cent over the period 2016/17 – 2018/19, which would take commencements to a trough of 172,242, which is the average for the last ten years.

“Actual building activity on the ground will not decline in the same way as new starts due to the substantial volume of work under construction that will not be completed until 2018 and into 2019.

“Dwelling renovations are forecast to grow over the forecast period counteracting some of the decline in the new home building activity. By 2018/19 renovations are forecasts to have grown by 6.5 per cent to be worth $32.96 billion in that year” Mr Temby concluded.

Big housebuilders won’t dig a way out of the housing crisis on their own

From The Conversation.

The UK has long been in the grip of a housing crisis. Back in 2004, respected economist Kate Barker carried out a major review of housing, concluding that if the low rates of construction continued, it would increase levels of homelessness and continue to make housing less affordable.

Ten years later, it’s clear that these urgent warnings fell on deaf ears. In 2004/05, when Barker’s report was published, 205,000 houses were built in the UK. In 2014/15, only 153,000 homes were constructed. As each year passes, the backlog of demand for housing grows larger, leading to rising house prices and greater numbers of households in rented accommodation.

Currently, almost 80% of all new dwellings are built by private house builders. In 2014/15, just ten companies were responsible for nearly half of the new homes developed. But it has not always been this way. In the 1960s and 70s, there were several years when local authorities and housing associations developed more houses than all private companies put together.

Prioritising profit

The issue of who builds housing matters, because government has so little control over the decisions and actions of private house builders. And since the 2008 recession, what has become clear is that the biggest house builders have been growing their profits much faster than they have been building new houses.

Our recent research shows that from 2012 to 2015, the number of new houses built by the five largest private house builders grew by 31%. Meanwhile, their revenues increased by 76%, and their end-of-year profits (after taxation and various other deductions) increased by over 200%. It seems that maintaining the scarcity of new housing keeps sale prices high, which removes the incentive to significantly increase the number of dwellings being built.


Steep. Images_of_Money/Flickr, CC BY

Of course, profit-making can be helpful, if firms then reinvest in more house building. But in 2015, the five biggest house builders returned 43% of their annual profits to shareholders in dividends. Our research suggests that if this had been reinvested in building more homes, nearly 9,000 extra houses could have been built – equivalent to a 6% increase in annual output.

It could also be argued that shareholder investment makes such house building possible, and that dividends are a fair price to pay. Yet this still leaves us with an uncomfortable conclusion; that an increase in housing supply depends on whether just a few companies decide to reinvest or pay out to shareholders.

Changing direction?

For many years after the 2008 financial crash, senior politicians did little to highlight or address this issue. But recent announcements by the government suggest a shift in political direction. Sajid Javid, the government minister responsible for housing, recently declared that “the big developers must release their stranglehold on supply”.


Sajid Javid. Foreign and Commonwealth Office/Flickr, CC BY

This echoes the more general statements made by the new prime minster: Theresa May has suggested that her government will intervene in dysfunctional markets – and the market for new houses could well be the first in line.

The forthcoming Autumn Statement promises increased government investment in housing. A series of new measures were recently announced, including the £3 billion Home Building Fund. This will be targeted at small and medium-sized developers, and may work to lessen the dominance of the large firms.

What does not seem to be on the government’s agenda, however, is the introduction of measures that would increase building by local authorities, housing associations and other non-profit bodies – in spite of proposals by sector representatives which outline how this could be achieved.

The government could do much more to increase public sector house building. Possible measures include allowing not-for-profit and public bodies to use more of their reserves for housing, and lifting borrowing restrictions. A wide range of economists have advised the government to borrow for investment in physical infrastructure.

Housing is not currently categorised as infrastructure, but treating it as such could generate economic gains, while addressing the growing shortfall in housing. What is for sure is that the house building industry on its own will not supply the homes which the UK so desperately needs.

Author: Tom Archer, PhD Candidate, Sheffield Hallam University

RBA FOI On Australian Metro Apartment Vacancy Rates Highlights Risks

The RBA has release an FOI response relating to documents created since 1 July 2015 containing information on Australian metropolitan apartment vacancy rates.

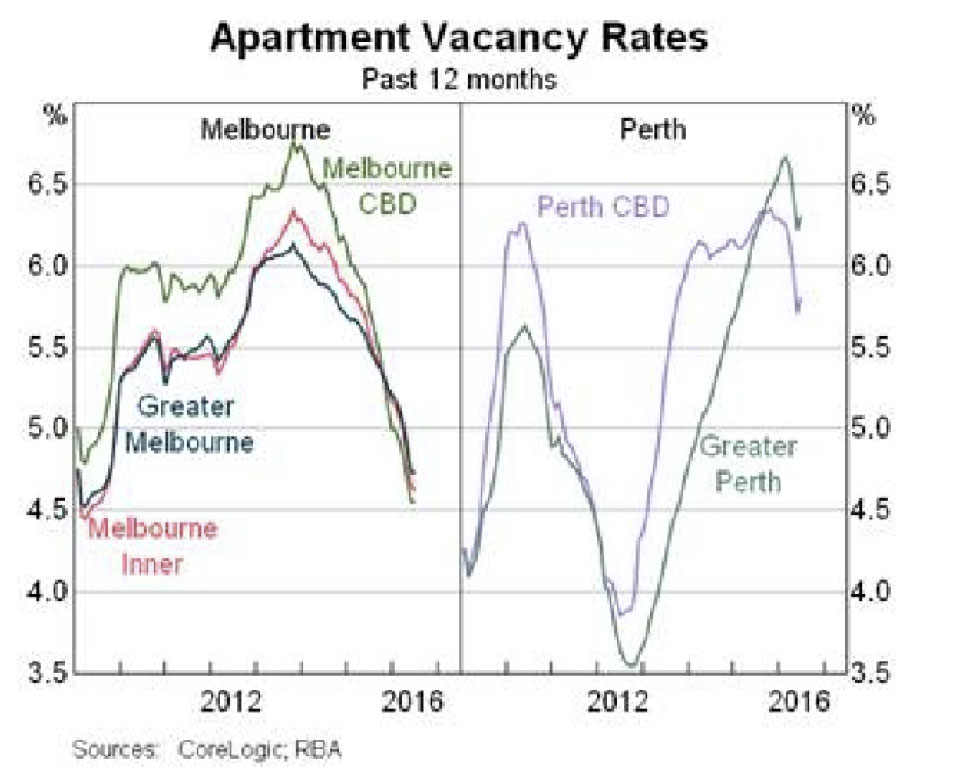
They say that a first look at the data indicates that the large additions to supply may be weighing on the apartment markets in inner-city Brisbane and  Melbourne. It also highlights the strength of current conditions in the Sydney apartment market, whereas Perth and areas heavily exposed to the mining industry are experiencing some weakness in housing markets

The substantial volume of apartment construction currently taking place across Australia has been concentrated in Sydney, Melbourne and Brisbane. The large amount of expected apartment completions over the coming years has led to concerns around potential oversupply, particularly in the inner-city areas of Brisbane and Melbourne. By number, these 3 city’s CBDs are forecast to have the largest amount of apartment completions over the coming two years As a share of the existing stock, the new forecast supply in Brisbane CBD will increase the dwelling stock in that area by 25 per cent. Adjacent areas to the Brisbane CBD, such as Brisbane Inner – North, and Holland Park – Yeronga are also forecast to have substantial increases in supply.

In Melbourne, the total number of new units is estimated at over 16 000 over the next two years, well above the forecast increase in other areas and as in Brisbane, neighbouring areas such as Port Phillip are also expected to have large numbers of new units.

Liaison suggests developers will increasingly offer rental guarantees as apartment supply increases (as a way of securing investor sales) and will be quick to adjust rents in response to vacancies. This raises the risk that a ‘flight to quality’ will translate to the broader apartment market over time through softer demand for older low quality, low amenity apartments.

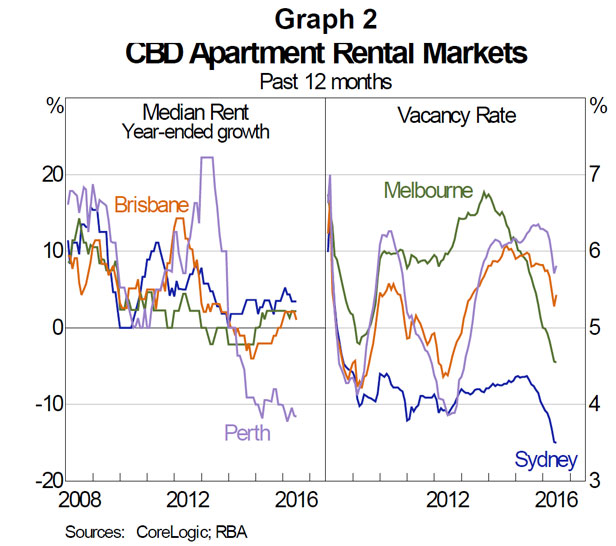
In Sydney, the areas forecast to have large numbers of new units are more geographically dispersed and the proportional increase to the dwelling stock is generally smaller than for Melbourne and Brisbane. The dataset provides information about market conditions at a more granular level. For example, CBD apartment market conditions differ markedly across cities; the weakness in the Perth economy has led to sizeable declines in apartment values and rents as well as elevated vacancy rates, Brisbane and Melbourne’s apartment market conditions are subdued, while Sydney’s remains strong.

rba-vacancy-2

For Greater Sydney, expected apartment completions are higher than in the other capital cities. But oversupply is less of a concern, because this expected supply forms a lower share of the dwelling stock and is relatively spread out across the inner and middle suburbs. For those areas within Sydney forecast to experience larger increases in supply relative to the existing dwelling stock, (such as Strathfield – Burwood – Ashfield, Parramatta, Ryde – Hunters Hill and Auburn), there is little sign that oversupply concerns are weighing on these areas, with both value and rental growth remaining relatively strong However, in Melbourne and Brisbane, value growth in areas with the largest amount of expected completions (such as Melbourne City and Brisbane Inner) is relatively weak.

rentals-rba-1

In Darwin, the housing market faces major headwinds as population growth slows. Contacts reported that high-density housing is oversupplied after years of strong building activity, which has led to falls in rents and prices and a rise in vacancy rates. High-rise construction has fallen significantly and building companies have had to adapt by rapidly shedding staff.

Apartment vacancy rates are already the highest of any capital city and residential rents have fallen considerably “white collar” workers – such as in engineering and design – do rent apartments. These highly-paid workers are either leaving now or have already left, which could partially explain the high vacancy rates already in Darwin. The decrease in accommodation costs resulted in Darwin’s CPI growth falling to around 0 per cent in year-ended terms in June 2016.

Have We Passed Peak Build?

The monthly HIA survey of Australia’s largest volume builders reveals that total seasonally-adjusted new home sales increased in September 2016, the second consecutive month of growth.

hia-sept-2016Within the month, growth was driven by detached house sales which rose by 3.8 per cent, while sales of units eased back by 0.8 per cent over the same period. However, Victoria was the only state to record an increase in new home sales over this period with 14.0 per cent growth in sales over the past year.

In fact, detached house sales fell in four out of the five states covered by the report, an exact reversal of the situation in August. During September 2016, the largest fall in sales was recorded in South Australia (-23.0 per cent), followed by Western Australia (-17.2 per cent), New South Wales (-12.9 per cent) and Queensland (-2.6 per cent).

“During September, HIA’s New Home Sales grew by 3.8 per cent, a further increase on the 2.9 per cent rate of growth over the previous month,” remarked HIA Senior Economist, Shane Garrett.

“However, the mix of available indictors suggests that new home building activity has now passed its peak and that the 2015/16 financial year will not be matched in terms new dwelling starts. This is particularly the case for multi-residential sales, which have eased by 6.2 per cent during the September 2016 quarter compared with the same period a year earlier”.


Residential Deposits Reaches Record – Stockland

The property developer Stockland updated security holders on its progress over the past year and its plans for the year ahead and released its first quarter FY17 market update, announcing a strong start to the year, including a record number of deposits for its Residential business. They see constructive signs for an elongated property cycle.

half-buit-house-picStockland achieved 2,301 net deposits on residential lots, townhouses and completed homes in the quarter, up from 1,557 for the corresponding period in FY16. Chief executive Mark Steinert said projects in Sydney, Melbourne and south east Queensland made “significant contributions” to the growth in deposits, while Perth has shown signs of stabilisation.

As forecast in its FY17 outlook in August, around two thirds of Stockland’s Residential profit will fall into the second half.

Net deposits on residential lots, townhouses and completed homes jumped 47.7 per cent to 2,301 in the three months to September 30, from 1,557 in the same period a year ago. Andrew Whitson, CEO Residential, said: “We see continued high demand in the Sydney and Melbourne markets and an encouraging return of first home buyers in south east Queensland, who are taking advantage of the Queensland First Home Owners’ Grant, which was recently increased to $20,000.

“We remain on track to achieve more than 6,000 residential settlements for the full year and see constructive signs for an elongated property cycle.”

Stockland’s Retail business, the single biggest contributor to group earnings, saw a slight moderation in the rate of sales growth. Total sales for the quarter increased by 2.4 per cent, with comparable specialty sales up 1.1 per cent on the corresponding quarter last year. Importantly, sales data from approximately one-third of the portfolio is excluded, due to the redevelopment of some of its most productive centres, most notably Stockland Wetherill Park in western Sydney and Stockland Green Hills in the lower Hunter Valley. Comparable specialty sales per square metre grew 3.0 per cent for the quarter to $9114 per square metre.

Stockland reported that the strongest retail categories were communications technology; food catering and casual dining; and retail services.

John Schroder, CEO Commercial Property at Stockland, said: “The first quarter saw the short term impact of redevelopment activity and retail remixing within our centres, which will deliver future earnings growth. We expect retail sales growth to continue at moderate levels, and we remain confident of achieving 3 – 4 per cent comparable retail FFO growth in FY17, in line with our guidance.”

Stockland maintained good leasing momentum within its Logistics and Business Parks business, with leases executed on 62,400 square metres of floor space and Heads of Agreements signed on a further 92,500 square metres. Weighted Average Lease Expiry (WALE) remained steady at 4.5 years.

“We’ve maintained our disciplined approach to capital recycling and we are using our capabilities to upgrade and reposition our portfolio,” explained Mr Schroder. “We have made good progress on our $400 million development pipeline, which is strongly weighted towards the higher-performing Sydney and Melbourne markets.”

In Retirement Living, Stockland achieved 255 net reservations during 1Q17. The first quarter result was well supported by Stockland’s development pipeline with 96 net reservations of new homes, including from its development projects at Cardinal Freeman The Residences at Ashfield in Sydney’s inner west and Willowdale Retirement Village in south west Sydney. Stockland recorded 159 net reservations within its established portfolio, with the figure constrained by a comparatively lower turnover of homes in New South Wales and Queensland.

Stockland confirmed that it is on track to achieve target growth in Funds from Operations (FFO) per security of 5.0 – 7.0 per cent across the entire group, with a profit skew to 2H17, assuming no material change in market conditions.

Stockland continues to target an estimated distribution per security of 25.5 cents, assuming no material change in market conditions.


Morrison targets state planning regulations as problem for housing affordability

From The Conversation.

The government will push states to remove unnecessary residential land use planning regulations that are impeding the supply of housing, Treasurer Scott Morrison will say in a major speech acknowledging the pressing issue of housing affordability.

Addressing the Urban Development Institute of Australia on Monday Morrison will say that improving affordability “right across the housing spectrum must … be a key policy goal for governments at all levels”.

half-buit-house-pic-4

Developing a sensible policy requires separation of the forces that have caused prices to increase, he will argue. “Of all the determinants of house prices in Australia, whether cyclical or structural, the most important factor behind rising prices has been the long running impediments to the supply side of the market.

“This not only relates to the volume of supply but also the responsiveness, flexibility, diversity and composition of that supply, as housing needs becomes more complex.

“A period of weak residential construction in the mid to late 2000s left many markets undersupplied, especially in NSW.”

While a large volume of construction is now coming through and much more is anticipated, not all is in the right place or of the right type, Morrison will say.

“Whilst Sydney, Melbourne and Brisbane have record supply, most of this is in the inner city apartment market … Unfortunately, we are still seeing a muted supply of detached housing in other parts of our cities.”

Morrison will list supply side constraints as including “complex land planning and development regulation; insufficient land release; the planning, cost and availability of infrastructure provision; transaction and betterment taxes; public attitudes towards urban infill; and, for Sydney in particular, physical geographic constraints.”

State governments could do a lot to improve planning processes and the provision of infrastructure, he will say.

He will instance developers telling Treasury about increasing development times including one case on Melbourne’s outskirts where it took 12 years for a project to go from land acquisition to a new suburb.

“This is how long it took for the land to be rezoned and for the developer to meet the onerous hurdles required in construction.

“While some construction standards are important for maintaining the safety and quality of newly constructed dwellings, some of these hurdles sounded almost farcical. For example the Melbourne developer wasn’t permitted to design the shopping precinct of the new suburb they had built because the Victorian government required that their own architects did the work (and at their own pace).

“So even though there have been some signs of a supply response in recent years, particularly in inner-city apartments, more needs to be done to ensure that supply increases more broadly – both in terms of location and type of dwelling – and that the roadblocks to this increased supply are removed.”

This will be a focus of Morrison’s discussions at the next Council on Federal Financial Relations in early December.

The proportion of Australian households owning or paying off their home has fallen from 71% to 67% over the past 20 years.

The proportion of home owners aged over 45 with a mortgage has increased significantly in that time.

“It’s taking longer for people to own their own home and be free of their mortgage. This trend has the potential to undermine retirement incomes, with superannuation cashed in on retirement to clear the mortgage or having mortgage costs eating into retirement income or undermining their ability to save more as they approach retirement,” Morrison will say. Housing un-affordabilty thus has a “cascading impact”.

Morrison will point to the “real pinch point” – being able to get into the market in the first place.

“As house prices have risen relative to incomes, this is making it more difficult for first home buyers to keep up and save an adequate deposit,” he will say.

“The proportion of home loans that are being provided to first home buyers was 13.4% in August 2016, the lowest point since February 2004 and well below its long term average of 19.4%.

“In aggregate, across the country, a 20% deposit on the nationwide median home loan is more than 100% of annual household disposable income. This is slightly above the decade average, but well above the 60% levels that were the norm prior to 2000,” Morrison will say.

“The market is getting away from people. No matter how hard they work or save or even earn, they are finding it harder and harder to get into the market.”

But “the key to addressing housing affordability is not to crash the housing market. Rather the objective is to have housing policies that mitigate the artificial inflation of asset prices, ensure that supply is not restricted from responding to genuine demand and that enable homebuyers, through their own efforts, to make more rapid progress to being able to enter the market”.

On the issue of the looming glut in inner city apartments, Morrison will say that “notwithstanding some regional risks, the current construction cycle would likely have to run-up faster and continue for longer before over-supply became a nationwide macroeconomic risk.

“That is not to say that the size and length of the current construction boom won’t warrant attention in the coming months and years. Policy makers are very cognisant of the risks and have been doing something about it.”

Land Prices Push Higher

The HIA-CoreLogic Residential Land Report for the June 2016 quarter has just been published by the Housing Industry Association, and CoreLogic. The Residential Land Report offers a comprehensive review of quarterly sales activity and price trends in 41 regional and six capital city markets across Australia.

During the June 2016 quarter, land transactions experienced the largest increase in Hobart (+26.9 per cent) compared with the same period year earlier. Land turnover was unchanged in Adelaide (+0.2 per cent). Land sales saw the largest reduction in Sydney (-38.3 per cent), followed by Melbourne (-14.3 per cent) and Brisbane (-3.9 per cent). Perth also experienced a small decline in land market turnover (-3.5 per cent).

“Residential land prices in Australia climbed to yet another all-time high during the June 2016 quarter, on the back of strong demand and lower interest rates,” HIA Senior Economist, Shane Garrett commented.

hia-land

According to the HIA-CoreLogic Residential Land Report, the median residential land price rose by 2.6 per cent during the June 2016 quarter, to a new all-time high of $237,535. A total of 18,395 residential lots are estimated to have been transacted during the quarter – down by some 9.3 per cent on a year ago.

According to CoreLogic research director Tim Lawless, the increase in land transactions nationally was accompanied by a surge in land sales located in Tasmania as well as in some regional markets. “Hobart saw land sales jump by almost 27 per cent over the first half of 2016 compared with the same period a year ago, while the largest cities, where affordability constraints are already the most visible, recorded a substantial reduction in land sales over the first six months of 2016.”

“The volume of land sales across Sydney was down sharply while land prices surged 14.1 per cent higher over the year. The opposing trends of transaction numbers and prices is a clear indication of demand outweighing supply which is creating significant price inflation across vacant land markets,” Mr Lawless added.

“While unit markets have seen approvals and construction activity reach spectacular highs, supply levels across the detached housing sector remains insufficient in many areas. The lack of available vacant land highlights that greenfield housing markets are likely to remain undersupplied which implies further upwards price pressures across the key vacant land markets where demand remains strong,” concluded Tim Lawless

“Housing affordability has deteriorated across several key markets, and the ongoing rise in land prices is proving very challenging,” Shane Garrett explained.

“With market supply having fallen further over the past year, policy makers need to look very carefully at ways of bringing about more sustainable outcomes in residential land supply. This will inevitably involve tackling issues around the pace of land release, the bottlenecks in the planning process and the excessive burden of taxation,” concluded Shane Garrett.