Can the private rental sector provide a secure, affordable housing solution?

From The Conversation.

Despite a relatively healthy supply-side picture for the general housing market, the expected trickle down of housing opportunities to low-income households in Australia has failed to materialise.

The UK Department for Communities and Local Government boasted this year of a seven-year high in construction starting on new houses; in the 12 months to December 2015, there were a little over 143,500 housing starts. With a population of 54.3 million, the English housing sector is adding one new dwelling for every 380 persons.

Over the same period there were 231,411 housing approvals in Australia. With a population of 23.5 million in 2014, the Australian housing sector is adding one new dwelling for every 102 persons.

The supply of new housing has matched Australian population growth in recent times. The figure below profiles growth of the housing stock between 2006 and 2014, and compares it to population growth over the same period Australia-wide, as well as across the state capitals, Canberra and Darwin.

Growth in the national housing stock has kept pace with population growth for almost a decade.

However, the picture differs across state and territory capitals. In Perth and Sydney, increases in the housing stock are insufficient to match the increase in these state capitals’ populations. But there are different patterns underlying this common outcome.

In Perth, population growth was exceptionally strong. It was faster than any other city: its population soared (by 2014) to more than 28% above 2006 levels. Such rapid growth would stretch the capacity of most housing construction sectors, even in the absence of any supply-side impediments.

Sydney’s population growth (at 14%) is below the average across all cities (17%). Despite this relatively low increase in its population, housing supply failed to produce a matching increase in the housing stock.

A housing system under pressure

The balance between growth in population and expansion in housing stock through new housing supply is thought to be relevant to an understanding of housing affordability pressures. New housing construction that matches population growth should ease price and rent pressures, where all else is equal.

Although most new housing is built and sold in the higher price ranges and therefore purchased by higher-income groups, the housing they vacate will fall in price. It therefore becomes accessible to middle-income groups. And, as they shift upmarket, the housing they move out of falls in price and becomes accessible to lower-income households.

Eventually, this filtering process opens up new opportunities for the homeless.

Housing affordability is generally thought to be worsening, especially for low-income households. Homelessness numbers remain stubbornly high. And official figures for June 2015 reveal there were 154,000 households on state housing authority waiting lists for public housing.

It is likely that the length of these waiting lists underestimates the need for public housing. We have modelled the income rules determining eligibility for public housing, and estimate that there are nearly 900,000 households satisfying these income eligibility criteria.

More than two-thirds of these households (650,000) contain one or more persons who:

  • are aged 65 and over;
  • have a long-term health condition or disability; or
  • have children aged under 15.

These are people who value the security of tenure that has typically been offered by public housing, but who are unlikely to be able to buy their own homes. There are nearly 1 million individuals in these households – a group that is currently ill-served by Australia’s housing system.

Housing solutions through private-public partnerships

The need for new housing solutions for these low-income groups is clearly a pressing requirement. However, raising the capital funding to expand public or social housing to meet their housing needs seems improbable.

Secure leasing is a private-public partnership option that offers a rent premium to those private landlords willing to offer long-term leases to those satisfying the income tests for public housing. They would also be either of pension age, disabled or caring for children.

In the unregulated Australian rental housing market, leases are almost always short term. This gives landlords the option to realise investments in the near term. Hence, a long-term lease proposal requires Australian governments to offer landlords a rent premium to compensate them for the money sacrificed when they enter into a long-term arrangement.

Consider a reform scenario in which landlords are given an incentive to offer five-year secure leases to households eligible for public housing who are now living in the private rental sector, with rent increases capped at increases in the consumer price index over the secure lease period.

We estimate that, over five years, the budgetary cost to the government to house these 650,000 households in secure lease arrangements is A$13.4 billion.

The uneven distribution of these households across states and territories means the program’s cost varies across the five most-populous states. Our estimates are $4.7 billion in New South Wales, $3 billion in Victoria, $2.5 billion in Queensland, $1 billion in South Australia, and $1.8 billion in Western Australia – with the remainder borne by Tasmania and the territories.

This cost is much more affordable than the capital funding required to expand the social housing stock through the construction of new social housing dwellings.

The Australian tax system currently provides indirect support for the supply of private rental housing through tax concessions such as negative gearing and capital gains tax discounts. Is it now time to harness some of the private investment stimulated by these concessions to help improve the supply of affordable and secure housing opportunities for low-income households.

Authors: Gavin Wood, Professor of Housing, RMIT University; Rachel Ong, Deputy Director, Bankwest Curtin Economics Centre, Curtin University

Melbourne and Brisbane face apartment supply shocks – RBA

From The New Daily.

The Reserve Bank has warned that a sharp fall in the value of inner-city apartments in Melbourne and Brisbane is “closer to materialising”, as developers continue to flood both markets with new high-rise dwellings.

The central bank made the observation in its latest financial stability review, which noted that supply pressures are likely to weigh most on apartment prices in Brisbane and Melbourne.

Over the next two years, around 16,000 new apartments will be completed in Melbourne, raising the prospect of a glut in high-rise units.

About 12,000 new apartments are expected to be built in Brisbane.

The RBA is concerned that a fall in demand for new apartments could test the ability of developers and property buyers to meet repayments on loans that collectively run into the tens of billions.

“In residential property development, the risks in some apartment markets are closer to materialising, as the large and geographically concentrated increase in supply approaches,” the central bank said.

“If apartment market conditions were to deteriorate in these inner-city areas, it is more likely that banks would experience material losses on their development lending rather than on their mortgages.

“Banks would experience losses on these exposures in default events where the value of the properties is insufficient to cover the debt outstanding.”

Home borrowers in WA and Queensland under ‘stress’

In its wide-ranging survey of the domestic housing market, the RBA also observed that the number of home borrowers unable to meet mortgage repayments was rising “substantially” throughout the mining regions of Queensland and Western Australia.

House prices in some have more than halved in the last three years, leaving many borrowers without means to repay loans.

This has triggered a significant rise in the number of homes being repossessed by banks, particularly in WA’s Pilbara mining region where the median house price has slumped to less than $400,000 from $830,000 in 2013.

home borrowersMany borrowers have been left without means to repay loans. Photo: Getty

Borrowers are also under pressure in Queensland’s Central Highlands where house values have been crunched by more than 55 per cent.

“Although the household sector’s aggregate financial position has remained broadly steady, households in some parts of the country are experiencing increased financial stress,” the RBA observed.

“Housing loan performance in Western Australia and Queensland in particular deteriorated further over the first half of 2016.

“The (commercial) banks attributed this deterioration largely to declining incomes in the mining states rather than to unemployment.”

The big problem for many borrowers in mining towns is that it has become extremely difficult to repay lenders because there are simply no buyers for their properties, even when they are offered at big discounts.

The national picture: risks have ‘lessened a little’

While thousands of borrowers living in mining areas are doing it tough, the RBA believes that the overall risk profile of Australian home borrowers actually improved in the first half of the year.

The Reserve attributed the modest improvement to the slowdown in house price growth and the effect of tighter lending measures imposed by the Australian Prudential Regulation Authority on the banks.

Although the average mortgage debt of Australian home borrowers rose to a record $256,000 at the end of June, the RBA observed that a larger proportion of recent home buyers had stumped up bigger deposits compared to people who applied for loans last year.

The RBA also observed that fewer borrowers took out interest-only loans in the June quarter.

rbaThe Reserve Bank acknowledged that fewer borrowers took out interest-only loans in the June quarter. Photo: AAP

One of Australia’s leading banking industry researchers – Martin North of Digital Finance Analytics – is less sanguine about the risk profile of home loans and general lending by the banks.

He pointed to the latest loan data published by the Australian Bureau of Statistics, which showed that investment property lending was the only credit category to grow in August.

“The lack of business investment growth is hobbling overall economic outcomes, whilst our housing stock value, and bank balance sheets are artificially being inflated,” he said.

“This mix of lending and the implications, is what the RBA should be discussing.

“Ultra-low interest rates are not helping to restore productive growth.”

Residential Building Booming

The latest data from the ABS shows that the trend estimate of the value of total building work done rose 1.5% in the June 2016 quarter to $26.1bn. The trend series smooths out some of the swings period to period, and provide a better view of the underlying trajectory of the numbers. Apartment building activity is driving much of the lift.

The trend estimate of the value of new residential building work done rose 2.1% in the June quarter. The value of work done on new houses was flat while new other residential building rose 4.5%. Total residential building was $17.2bn.

buidling-work-june-2016lThe trend estimate of the value of non-residential building work done rose 0.5% in the June quarter and worth $8.9bn.

The statistics were compiled using building approval details and returns collected from builders and other individuals and organisations engaged in building activity. Since the September quarter of 1990, the quarterly estimates have represented all approved public and private sector owned:

  • residential building jobs valued at $10,000 or more.
  • non-residential building jobs valued at $50,000 or more.


Sydney Region Home Building Reaches New High

According to data to June 2016 from the NSW Department of Planning & Environment, more than 30,000 new homes have been built in Sydney in the last financial year, the highest figure since the building boom in the lead-up to the Sydney Olympic Games.

sydney-approvals

The latest figures from the Metropolitan Housing Monitor showed 30,191 new homes and apartments had been finished in the greater Sydney region.

This is the highest number of completions since the 1999-2000 financial year, when 30,520 completions were recorded.

Planning Minister Rob Stokes said the completion numbers were due to the strong local economy, a solid rate of development approvals and the NSW Government’s efforts to release land and build infrastructure to support housing supply.

“More houses being built means more opportunity for Sydneysiders to buy homes across our city,” Mr Stokes said.

“Unprecedented spending on new public transport and roads is helping to address a housing undersupply backlog of up to 100,000 homes. At the same time we’re creating a simpler, more efficient planning system to make it easier to build the homes we need.”

New home completions have increased by ten per cent in greater Sydney over the past financial year. Forty per cent of completed homes are within six local government areas: City of Sydney, Blacktown, Camden, Parramatta, Liverpool and The Hills.

New Home Sales mount a partial recovery in August – HIA

The monthly HIA survey of Australia’s largest volume builders reveals that total seasonally-adjusted new home sales mounted a partial recovery in August 2016.

hia-august-2016

In the month of August 2016 detached house sales increased in four out of five mainland states, after falling everywhere in July and rising everywhere in June. In August 2016 sales increased by: 12.1 per cent in South Australia; 8.7 per cent in New South Wales; 7.8 per cent in Western Australia; and by 4.2 per cent in Queensland. Detached house sales fell by 5.0 per cent in Victoria during the month.

The number of seasonally-adjusted detached house sales increased by 2.9 per cent in August 2016, following a decline of 7.4 per cent in July. However, ‘multi-unit’ sales dropped by 17.3 per cent in July before recovering by 17.8 per cent in August.

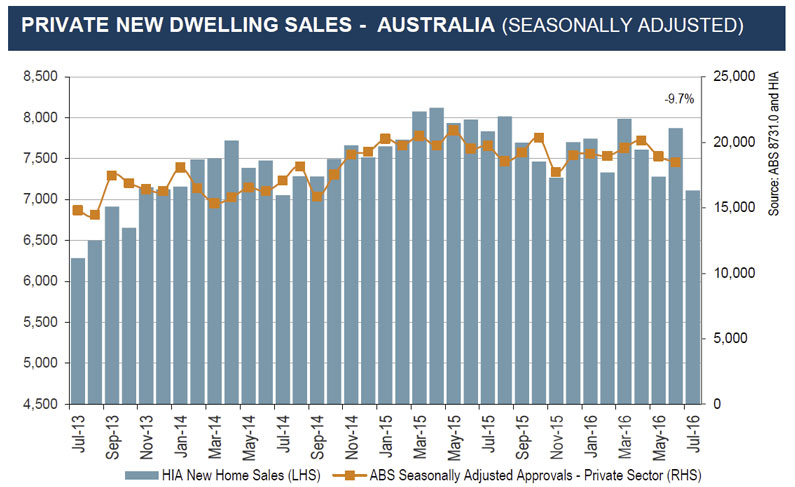
“HIA New Homes Sales fell by a rather hefty 9.7 per cent in July 2016, but then increased by 6.1 per cent in August,” said HIA Chief Economist, Dr Harley Dale.

“Sales of new detached houses and ‘multi-units’ didn’t rebound sufficiently in August to offset the decline in July. These latest New Home Sales figures therefore don’t paint a stellar picture of an August recovery – following as they do a big drop in July, but unless you’re a pessimist looking for a large black hole then this latest update is a long way from a downbeat story.”

“Australia is in the midst of the longest and biggest new home building cycle in the nation’s history,” Harley Dale said. “Despite being at the mature stage of this cycle we still face a situation where key leading indicators such as HIA New Home Sales point to healthy levels of construction ahead, even if volumes will be down on the 2015/16 record high.”

“Total new home sales expanded by 1.5 per cent over the three months to July this year. That is a great result when the level of national new home building has already grown over four consecutive years,” concluded Harley Dale.


Building Approvals Up In July

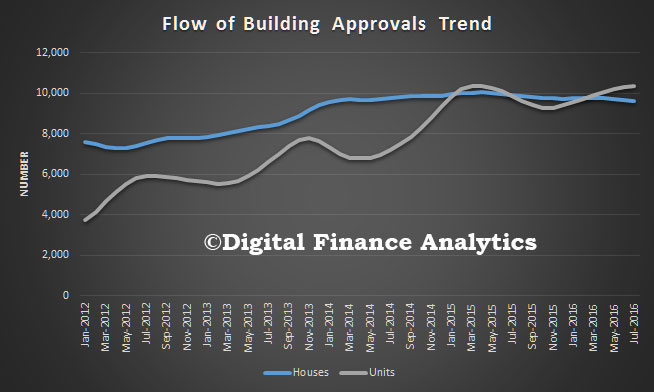
The number of dwellings approved rose 0.2 per cent in July 2016, in trend terms, and has now risen for eight months, according to data released by the Australian Bureau of Statistics (ABS) today. The number of units rose, whilst the number of houses fell.

Build-Approval-July-2016

Dwelling approvals increased in July in New South Wales (2.4 per cent) and Victoria (0.5 per cent) but decreased in Tasmania (3.7 per cent), Northern Territory (3.2 per cent), Australian Capital Territory (2.6 per cent), Queensland (1.8 per cent), South Australia (1.8 per cent) and Western Australia (1.8 per cent) in trend terms.

In trend terms, approvals for private sector houses fell 0.5 per cent in July. Private sector house approvals fell in South Australia (1.6 per cent), Western Australia (1.5 per cent) and Victoria (1.1 per cent). Private sector house approvals rose in Queensland (0.8 per cent) and were flat in New South Wales.

In seasonally adjusted terms, total dwelling approvals increased 11.3 per cent, driven by a rise in total other residential dwelling approvals (23.4 per cent). Total house approvals fell 0.6 per cent.

The value of total building approved rose 1.9 per cent in July, in trend terms, and has risen for seven months. The value of residential building rose 0.9 per cent, while non-residential building rose 3.9 per cent.

Will New Home Sales take a new year dip?

The Housing Industry Association (HIA) New Home Sales Report to July 2016, which is based on a survey of Australia’s largest volume builders, suggests new commencements in 2016/17 will slow significantly.

HIA-New-Home-July-2016“The short term outlook for healthy levels of new home construction remains intact – calendar year 2016 will be a record year for new dwelling commencements, but the situation could look very different from next year,” commented HIA Chief Economist, Dr Harley Dale.

“The monthly HIA survey of Australia’s largest volume builders reveals that total seasonally adjusted new home sales fell by 9.7 per cent in July 2016 following an increase of 8.2 per cent in June. The overall trend decline in new home sales is accelerating, signalling a relatively sharp drop (from a record high) in new dwelling commencements from 2017.”

“New home construction has been the kingmaker of the Australia economy, but the cycle has peaked,” noted Harley Dale.

“In all likelihood we will experience sharper falls in new home construction in both 2017 and 2018. The magnitude of decline in new home construction in coming years will of course be exaggerated by where we are coming from – record levels of medium/high density construction and historically healthy levels of detached/semi-detached dwelling construction.”

“There will no doubt be a tendency to sensationalise any negative results for new housing as the trajectory of the down cycle unfolds. We would do well to remember that this down cycle is following a record high that is some 24 per cent higher than the previous (1994) peak and that there is an unprecedented degree of uncertainty this time around as to how the next few years of new home building unfold,” concluded Harley Dale.

In the month of July 2016 detached house sales fell in all five mainland states, after rising everywhere in June. Sales dropped by 12.6 per cent in South Australia and were down by 8.7 per cent in Queensland, 8.2 per cent in Western Australia, 6.2 per cent in NSW, and 6.0 per cent in Victoria.


June Bounce for New Home Lending

Latest ABS figures on housing finance show that new home lending saw a healthy rise during June, said the Housing Industry Association, who suggests it is linked to the May interest rate cut.

During June 2016, the number of loans to owner occupiers for dwelling construction rose by 2.1 per cent in seasonally adjusted terms while loans for the purchase of new homes saw growth of 2.7 per cent. Overall, new home lending volumes increased by 2.3 per cent during the month and some 6.3 per cent higher than the same month last year.

“The RBA cut its interest rate at the beginning of May so June’s housing finance results are the first month’s data to fully capture the effect of cheaper mortgage costs,” explained HIA Senior Economist Shane Garrett. “Encouragingly, prospective homebuyers seem to have taken advantage of the lower interest rate environment as evidenced by today’s positive results for new home lending,” Shane Garrett pointed out.

“June was also dominated by the close federal election campaign which was the source of some uncertainty across the economy. Today’s data indicate that the benefits of lower interest rates trumped any reluctance by buyers to enter the market during the tight election race. It’s therefore likely that last week’s interest rate cut will help bolster activity on the new home building side,” concluded Shane Garrett.

Compared with a year earlier, the number of loans to owner occupiers constructing or purchasing new homes increased in a number of states over the year to June 2016. The strongest growth was in Victoria (+19.1 per cent), followed by New South Wales (+10.8 per cent). There was a more measured increase in Queensland (+4.3 per cent). . Over the same period, there were substantial reductions in Western Australian (-20.7 per cent), and the Northern Territory (-17.7 per cent) while Tasmania recorded a more modest fall(-3.5 per cent). New home lending to owner occupiers in South Australia and the ACT during June 2016 was comparable with the level a year ago.

HIA-June16

Dwelling Approvals Fall In June

The number of dwellings approved fell 0.9 per cent in June 2016, in trend terms, according to data released by the Australian Bureau of Statistics (ABS) today. This is the second successive monthly fall.

Building-Approvals-June-2016Dwelling approvals decreased in June in Western Australia (5.2 per cent), Tasmania (3.7 per cent), Queensland (3.2 per cent), Australian Capital Territory (2.8 per cent) and Victoria (0.1 per cent), but increased in the Northern Territory (3.6 per cent), South Australia (1.6 per cent) and New South Wales (0.8 per cent) in trend terms.

In trend terms, approvals for private sector houses fell 0.6 per cent in June. Private sector house approvals fell in Western Australia (3.5 per cent), Victoria (0.6 per cent), Queensland (0.5 per cent) and South Australia (0.3 per cent). Private sector house approvals rose in New South Wales (0.9 per cent).

In seasonally adjusted terms, total dwelling approvals decreased 2.9 per cent, with both total other residential dwelling approvals (3.4 per cent) and total houses (2.4 per cent) recording falls.

The value of total building approved rose 1.2 per cent in June, in trend terms, and has risen for six months. The value of residential building rose 0.1 per cent while non-residential building rose 3.7 per cent.

New Home Sales bounce back in June – HIA

The HIA New Home Sales Report, a survey of Australia’s largest volume builders, shows that total new home sales ended 2015/16 on a higher note, said the Housing Industry Association.

“The overall trend is still one of modest decline for New Home Sales, but a bounce of 8.2 per cent in June 2016 highlights the resilience of the national new home building sector,” commented HIA Chief Economist, Dr Harley Dale.

HIA-June-2016---New“The overall profile of HIA New Home Sales is signalling an orderly correction to national new home construction in the short term, as are other leading housing indicators,” noted Harley Dale.

“Below the national surface, the large geographical divergences between state housing markets have been a prominent feature of the current cycle – that will continue. The New Home Sales series highlights this fact. Comparing the June quarter this year to the same period last year, detached house sales are down very sharply in South Australia (-21.4 per cent) and in Western Australia (-27.5 per cent), yet sales are up by 17.0 per cent in Victoria and by 7.1 per cent in Queensland. New South Wales rounds off the detached house coverage provided by the New Home Sales report and sales are down by 7.3 per cent on an annual basis.”

The sale of detached houses bounced back by 7.2 per cent in the month of June 2016. ‘Multi-unit’ sales continued their recent recovery, growing by 11.5 per cent after a lift of 4.9 per cent in May. In the month of June 2016 detached house sales increased in all five mainland states with the largest increases occurring in Queensland (+14.9 per cent) and WA (+9.1 per cent). Detached house sales increased by 7.5 per cent in NSW, 3.7 per cent in South Australia, and 2.2 per cent in Victoria.