Record high unit construction increases settlement risk

According to CoreLogic RP Data, the recent boom in unit construction has seen record-high levels of unit approvals and construction culminating in a substantial volume of new unit stock, much of which will settle over the next 24 months.

CoreLogic’s new settlement risk report looks at the number of units due to settle over the next 6, 12, 18 and 24 months. This is based on the expected completion of new developments coupled with the number of units being built in these developments.

The first table highlights the number of unit sales over the 12 months to April 2016, the average number of annual unit sales over the five years to April 2016 and the anticipated number of unit completions over the 12 month to April 2017 and 24 months to April 2018. Across the combined capital cities there are 92,102 new units set for completion over the next 12 months with that figure rising to 231,129 over the next 24 months.

Number of expected unit settlement, data to April

2016-05-16--img1

Looking at the expected new unit supply, Sydney and Melbourne predictably have the greatest increases in stock over the next two years. If you compare the volume of stock expected to settle over the next 12 and 24 months to the average number of unit sales annually over the past five years, you can see a big disconnect, particularly in the four largest capital cities. The historic sales figures include sales of both existing and new units keeping in mind that new stock, usually accounts for a smaller slice of total sales than resales of existing stock.

The large volume of new stock, coupled with an ever-growing supply of existing stock which resells means that historic high levels of unit settlements are due to occur over the next two years in most cities. In fact, in Melbourne and Brisbane even a recurrence of the peak year for sales over the next two years wouldn’t represent enough demand to cater for all of the new units set to settle over the coming 24 months.

The second table highlights the SA3 regions nationally that have the highest number of anticipated unit settlements over the next 24 months. Given the much higher number of unit settlements in Sydney and Melbourne, these cities dominate this list with eight and 12 of the regions listed respectively. In Queensland, three regions from Brisbane and one from the Gold Coast are listed while one Perth region is also listed.

SA3 regions nationally with the most expected unit completions over
24 months to Apr-18

2016-05-16--img2

If we compare the capital cities, it becomes evident that most of the stock in Melbourne, Brisbane and Perth is located in inner-city (within 10km radius of the city). Taking a look at Sydney, the new unit supply is more geographically diverse. Yes, there are a lot of new units in inner city areas but there are also plenty in outer areas like Parramatta, Strathfield, Auburn and Kogarah-Rockdale. In some respects this spreads some of the risk around the city rather than other cities where new supply is much more centralised.

The large volume of new unit settlements over the next two years does raise some potential concerns, namely:

  • In many regions, capital growth for units has been substantially lower than that for houses. Many off-the-plan unit buyers would have expected a level of capital growth between contract and settlement.
  • Mortgage lenders have recently tightened their lending criteria and subsequently some people who have committed to purchasing off-the-plan units may not be able to borrow as much as they could at the time of signing the contract.
  • Units are much more likely to be owned by investors. Not only have lenders recently tightened mortgage criteria, they have also increased mortgage rates for investors.
  • Many of the units are coming up for settlement in similar locations and will compete with existing unit stock. With so much stock coming on-line at once there is an increasing concern as to whether settlement valuations will actually meet the contract price of these units.
  • To compound the situation, three of the four largest banks have announced they will no longer be lending to home buyers from overseas which could result in a larger number of contracts not progressing through to settlement, considering a larger proportion of off-the-plan unit sales are to overseas buyers.

New Housing Sales Buoyant

The demise of the housing sector has been over done judging by the latest figures released by the Housing Industry Association (HIA), which shows that the sale of new properties grew strongly in March, up 8.9% after a 5.3% fall in February. Across the quarter sales increase by 2.8%, though this is lower than a year back.

HIA-new-home-sales-March-2016We see the continued strong growth in apartment sales, up 16.3%, compared with houses at 7.0%, though house sales increased in Queensland up 13.2, Western Australia (9.8%), New South Wales (9.8%) and Victoria (2.8%) South Australia fell 6.9%.

Dwelling approvals rise in March

The number of dwellings approved rose 0.6 per cent in March 2016, in trend terms, and has now risen for four months, according to data released by the Australian Bureau of Statistics (ABS) today.

Dwelling approvals increased in March in the Australian Capital Territory (18.9 per cent), Western Australia (1.1 per cent), Queensland (0.8 per cent) and Victoria (0.2 per cent) in trend terms. Dwelling approvals decreased in the Northern Territory (18.1 per cent), Tasmania (1.5 per cent), New South Wales (0.3 per cent) and South Australia (0.1 per cent) in trend terms.

In trend terms, approvals for private sector houses rose 0.3 per cent in March. Private sector house approvals rose in Victoria (1.7 per cent), but fell in South Australia (0.8 per cent), Western Australia (0.7 per cent) and Queensland (0.2 per cent). Private sector house approvals were flat in New South Wales.

In seasonally adjusted terms, dwelling approvals increased 3.7 per cent. Private sector house approvals rose 2.6 per cent, while private sector dwellings excluding houses rose 6.7 per cent.

The value of total building approved fell 0.9 per cent in March, in trend terms, and has fallen for eight months. The value of residential building rose 0.4 per cent while non-residential building fell 3.9 per cent.

New Dwelling Commencements Down in Dec 2015 Quarter

The ABS building activity data to December 2015, released today, shows the trend estimate for the total number of dwelling units commenced fell 1.5% in the December 2015 quarter following a rise of 0.7% in the September quarter, whilst the seasonally adjusted estimate for the total number of dwelling units commenced fell 5.1% to 53,727 dwellings in the December quarter following a rise of 2.3% in the September quarter.

The trend estimate for new private sector house commencements fell 1.5% in the December quarter following a fall of 1.3% in the September quarter, whilst the seasonally adjusted estimate for new private sector house commencements fell 5.4% to 26,840 dwellings in the December quarter following a rise of 2.8% in the September quarter.

The trend estimate for new private sector other residential building commencements fell 0.7% in the December quarter following a rise of 3.2% in the September quarter, whilst the seasonally adjusted estimate for new private sector other residential building fell 3.8% to 25,733 dwellings in the December quarter following a rise of 3.9% in the September quarter.

However, the trend estimate of the value of total building work done rose 0.3% in the December 2015 quarter, whilst the seasonally adjusted estimate of the value of total building work done rose 1.0% to $24,507.5m in the December quarter, following a rise of 1.0% in the September 2015 quarter.

The trend estimate of the value of new residential building work done rose 1.3% in the December quarter. The value of work done on new houses fell 2.0% while new other residential building rose 5.5%. The seasonally adjusted estimate of the value of new residential building work done rose 2.1% to $13,960.0m. Work done on new houses fell 2.2% to $7,640.8m, while new other residential building rose 7.8% to $6,319.3m.

The trend estimate of the value of non-residential building work done fell 0.9% in the December quarter. The seasonally adjusted estimate of the value of non-residential building work done in the quarter fell 0.1%, following a fall of 1.5% in the September 2015 quarter.

 

Real Estate Investment In Australia From China Doubled Last Year – FIRB

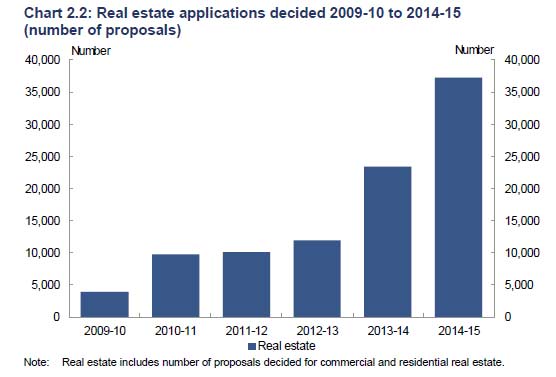
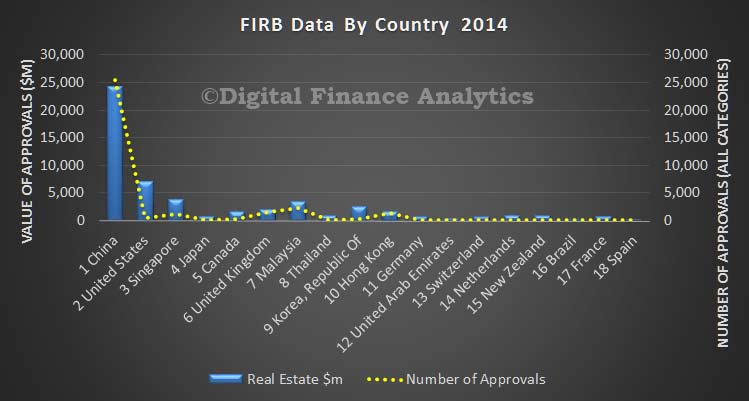
China foreign investment in real estate in Australia doubled that last year, according to the Foreign Investment Review Board (FIRB) in their annual report for the year 2014-2015. Total foreign investment approvals across all categories were worth $194.6 billion. No applications were rejected last year, though some were approved only with conditions.

Looking at the real estate sector, we see significant growth in applications compared with previous years.

FIRB-2014-1Approved investment in real estate (comprising commercial and residential proposals) was $96.9 billion in 2014-15 (compared with $74.6 billion in 2013-14). Residential approvals rose from $34.7 billion in 2013-14 to $60.75, of which $49.25 billion were for development.

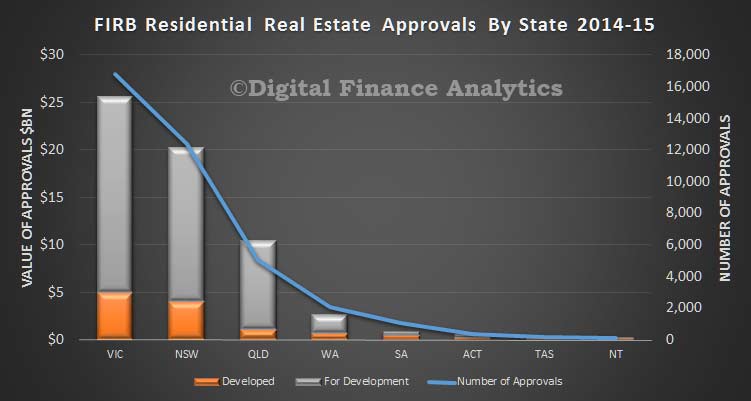
Looking at the state analysis, VIC leads the way in terms of the number and value of approvals. For example VIC had $20.6 billion of developments for approval, compared with $16.24 billion in NSW.

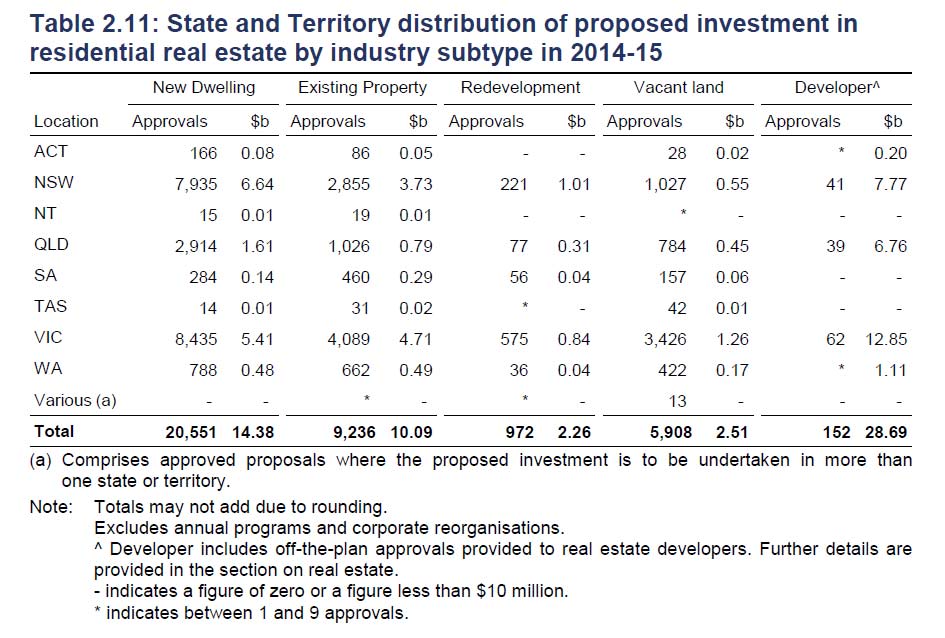
FIRB-2014-2The FIRB report includes a state analysis by type of development

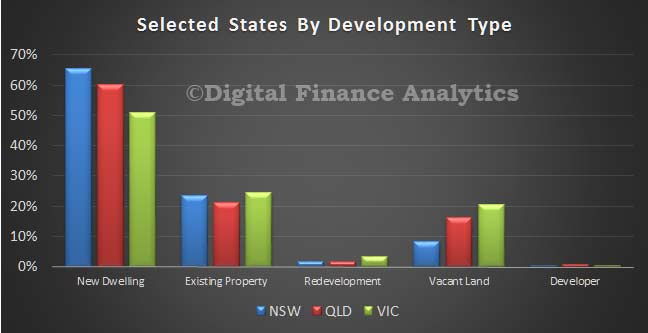
FIRB-2014-3Our analysis shows the largest proportion of new dwelling approvals in NSW, compared with VIC and QLD. On the other hand, VIC had the highest proportion of existing property and vacant land approvals.

FIRB-2014-4The Country data provided by the FIRB report does not separate residential real estate from commercial property. That said, the data shows China as the largest investor, based on number of approvals and value. In the previous year, China originated 14,716 approvals, compared with 25,431 in 2014-15 overall, whilst real estate was worth $12.4 billion in 2013-14 compared with $24.3 billion in 2014-15.

FIRB-2014-5


Trend Building Approvals Fall Again

According to the ABS, the trend estimate for total dwellings approved fell 0.5% in February and has fallen for 11 months while the seasonally adjusted estimate for total dwellings approved rose 3.1% in February following a fall of 6.6% in the previous month.

Building-Approvals-Number-Feb-2016The trend estimate for private sector houses approved fell 0.9% in February and has fallen for 10 months while the seasonally adjusted estimate for private sector houses fell 1.2% in February and has fallen for two months.

The trend estimate for private sector dwellings excluding houses fell 0.4% in February and has fallen for 11 months whilst the seasonally adjusted estimate for private sector dwellings excluding houses rose 7.6% in February following a fall of 8.4% in the previous month.

Value-Approvals-Feb-2016The trend estimate of the value of total building approved fell 0.8% in February and has fallen for seven months. The value of residential building fell 0.7% and has fallen for 10 months. The value of non-residential building fell 1.2% and has fallen for six months.
The seasonally adjusted estimate of the value of total building approved rose 5.3% in February following a fall of 8.9% in the previous month. The value of residential building rose 6.9% following a fall of 9.2% in the previous month. The value of non-residential building rose 2.0% after falling for two months.


Dwelling approvals continue to decline in February

The number of dwellings approved fell 0.5 per cent in February 2016, in trend terms, and has fallen for 11 months, according to data released by the Australian Bureau of Statistics (ABS) today.

Dwelling approvals decreased in February in the Northern Territory (9.7 per cent), South Australia (2.1 per cent), Western Australia (1.4 per cent), Queensland (0.8 per cent), Tasmania (0.5 per cent) and New South Wales (0.1 per cent) but increased in the Australian Capital Territory (4.9 per cent) in trend terms. Dwelling approvals were flat in Victoria, in trend terms.

Approvals for private sector houses fell 0.9 per cent in February, while approvals for private sector dwellings excluding houses fell 0.4 per cent, in trend terms.

Private sector house approvals fell in Western Australia (2.2 per cent), New South Wales (1.5 per cent), South Australia (1.3 per cent), Queensland (0.5 per cent) and Victoria (0.3 per cent).

The seasonally adjusted estimate for dwelling approvals rose 3.1 per cent in February following a 6.6 per cent fall in January. The rise in February was driven by dwellings excluding houses (up 7.7 per cent), offset by a 1.0 per cent fall in approvals for houses.

The largest contributors to the overall rise in seasonally adjusted dwelling approvals by state were Tasmania (24.0 per cent), New South Wales (14.4 per cent) and Queensland (9.5 per cent).

The value of total building approved fell 0.8 per cent in February, in trend terms, and has fallen for seven months. The value of residential building fell 0.7 per cent while non-residential building fell 1.2 per cent.

New Home Sales Momentum Easing – HIA

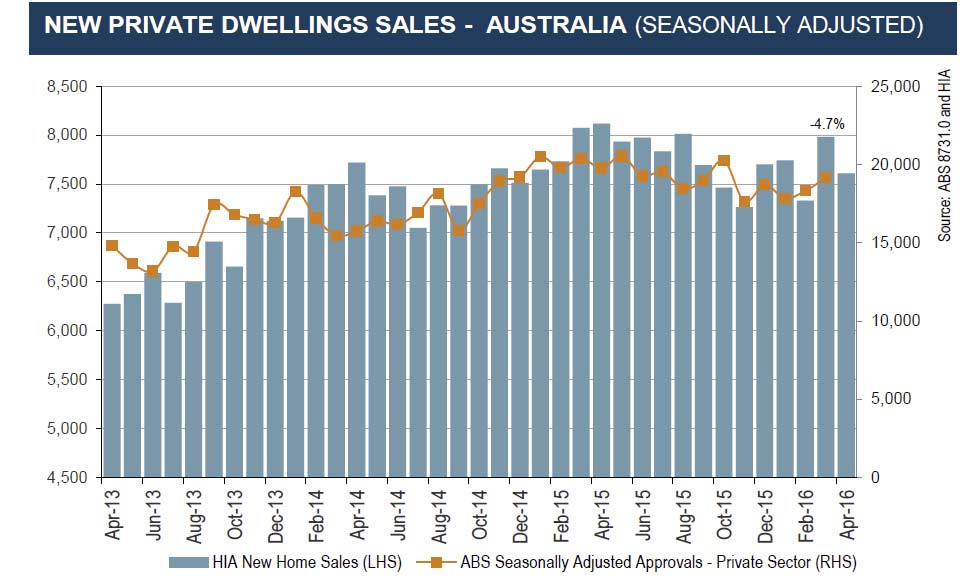
The HIA New Home Sales Report, a survey of Australia’s largest volume builders, recorded a relatively sharp decline of 5.3 per cent in February 2016, said the Housing Industry Association.

Seasonally adjusted detached house sales fell by 3.9 per cent in February 2016, while the sale of ‘multiunits’ dropped by a sharper 10.6 per cent. In the month of February 2016 detached house sales increased in by 1.7 per cent in Victoria and by 1.8 per cent in Western Australia. Detached house sales fell by 7.4 per cent in New South Wales, 12.1 per cent in Queensland, and 3.5 per cent in South Australia.New-Home-Sales-HIA-Mar-2016

Sydney Home Prices Take A Dive

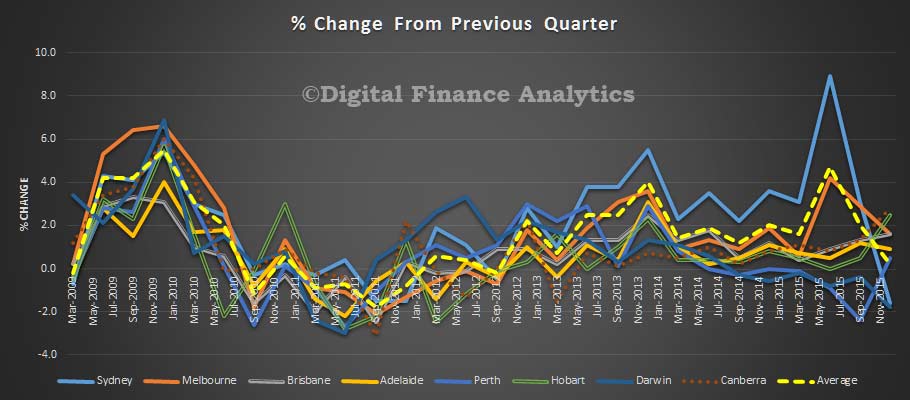
The Residential Property Price Index (RPPI) for Sydney fell 1.6 per cent in the December quarter 2015 following positive quarterly growth over the last three years, according to figures released today by the Australian Bureau of Statistics (ABS).  Sydney established house prices fell 2.1 per cent and attached dwellings prices fell 0.8 per cent in the December quarter 2015. Annually, Sydney residential property prices rose 13.9 per cent.

Dec-2015-Price-Movements
In other capital cities in the December quarter 2015, the RPPI rose in Melbourne (+1.6 per cent), Brisbane (+1.6 per cent), Adelaide (+0.9 per cent), Canberra (+2.8 per cent), Perth (+0.5 per cent) and Hobart (+2.5 per cent) and fell in Darwin (-1.8 per cent ).

For the weighted average of the eight capital cities, the RPPI rose 0.2 per cent in the December quarter 2015 and rose 8.7 per cent over the previous year.

The total value of Australia’s 9.6 million residential dwellings increased $31.6 billion to $5.9 trillion. The mean price of dwellings in Australia is now $612,100.

Should more of us be building our own homes?

From The Conversation.

More and more people of all ages are unable to buy their own home in Britain, and there is no denying the country is in the grip of a nationwide housing crisis.

The main “solutions” put forward by the government so far have focused on how to encourage the house building industry to build more homes, and faster. But we need to move away from these traditional notions of developer-led housing and instead encourage more self-building.

Already in Britain self-builders build more homes than the largest individual house-builder, but despite these figures, it is still considered a marginal activity and an individual choice rather than a potential large-scale policy solution.

This is short sighted because self-build is a good way to develop more appropriate housing which meets residents’ demands and desires while also being affordable.

Self building – coming to a hillside near you? Stefan Stefancik/Pexels

In European countries self-build is the norm; in France and Belgium it accounts for about 50% of all new building and in Sweden about a third of new house building is self-built – compare that with England where the figure stands at less than 10%.

We are crying out for more self-build housing in Britain, not only as a way to address the housing shortage but also as a way to deliver low carbon lifestyles – something conventional house construction has failed to do.

Close to home

What is considered self-build varies internationally, but it is generally when a resident has built all or part of their home, sometimes working with or employing others during the build. In Australia, for example, the term custom build more accurately describes how a lot of new houses are built.

With custom build, a developer offers two or three design options and the customer chooses a design and the number of different rooms they want. The difference between self-build and custom-build is the level of resident responsibility, organising and interaction. But all varieties offer useful options for the provision of more affordable housing.

How to build a house of straw. Jenny Cestnik/Flickr, CC BY-ND

Many people build their own homes with limited building experience, but are keen to get involved because they get to choose the layout, materials and aesthetics of their home – plus self-build is often a much cheaper way to get on the housing ladder.

With residents taking on all, or some of, the jobs themselves and moving away from reliance on the brick – the use of cheaper and quicker methods like prefabricated systems, reclaimed materials, or straw-bales can reduce costs and cut out the need for a company to make a profit.

The significant cost of land can be also mitigated with self-build by developing communal land ownership structures that make it available for affordable housing. And costs can be lowered even further when a collective builds homes, such as co-housing groups, who share the purchase of land, infrastructure and building.

Building for the future

Despite the low number of self-builds, Britain already has a broad variety of homes built in this way – from the large detached houses featured on programmes such as Grand Designs to numerous small homes crafted from low-cost, natural or reclaimed materials.

In an attempt to create housing for local residents some councils have started to allocate land for self-build housing, and others have created exemptions in planning legislation that allow certain forms of self-building in places normally denied building permission.

To tackle the housing crisis we need a complete rethink of the way we build houses in Britain. Self-building shouldn’t be for the reserve of the mega rich, or those looking for a project in retirement. Instead young people, families, couples, anyone should be able to build their own home.

Shipping containers: homes of the future? lorigami/Flickr, CC BY-ND

We need to look to our European neighbours to learn a thing or two about self-building and shared ownership. We need to learn how to minimise the amount of materials required by building smaller individuals houses with shared communal space for gardens, laundry, workshops and storage.

And instead of purchasing freehold we could roll out more stakeholder ownership models – just like Lilac in Leeds. At Lilac costs are linked to ability to pay and residents only pay a housing charge equivalent to 35% of their net income. Meaning the higher earners subsidise those on lower incomes.

With a rise in self-build housing we could build our way out of the current housing crisis – but maybe more importantly, we could also avoid a repeat of it in the future.

Author: Jenny Pickerill, Professor of Environmental Geography, University of Sheffield