The Foreign Investment Review Board recently published their annual report for 2013-2014. Whilst we question whether they capture the full picture, the report shows that real estate and services related applications accounted for around 76 per cent of the value of approvals in 2013-14. China was the largest investor in 2013-14 in terms of the value of all approvals (17 per cent of the total value), followed by the United States and Canada. Three (yes three!) proposals were rejected in the year.
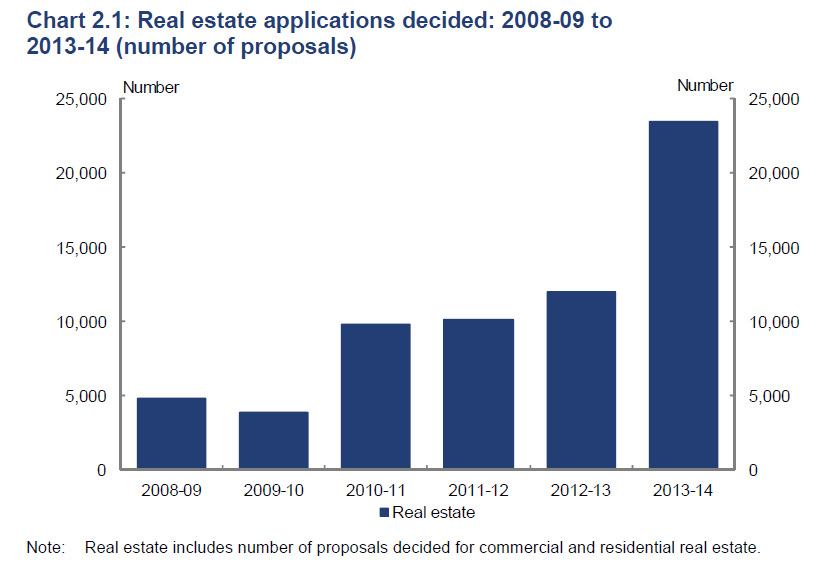
In 2013-14, 24,102 proposals received foreign investment approval, compared with 12,731 in 2012-13. The real estate sector had a significant increase in approvals with 23,428 approvals in 2013-14,compared with 12,025 approvals in 2012-13.
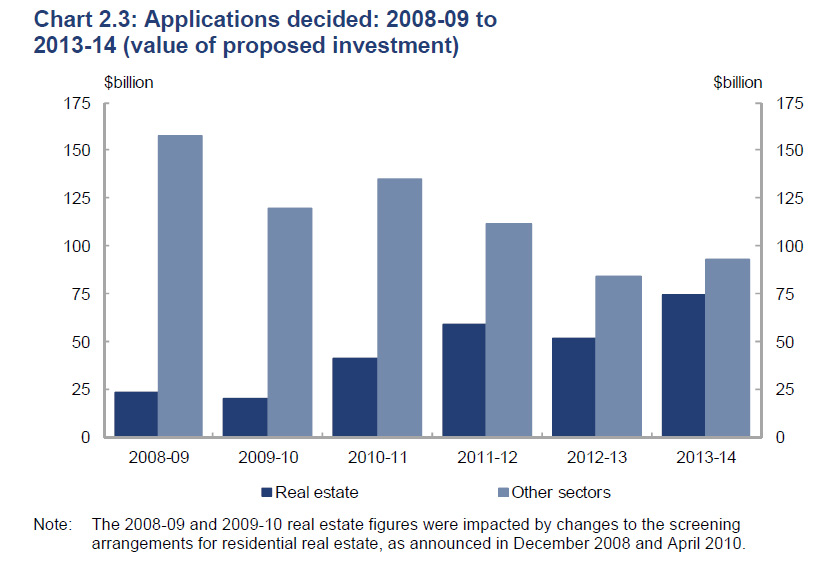
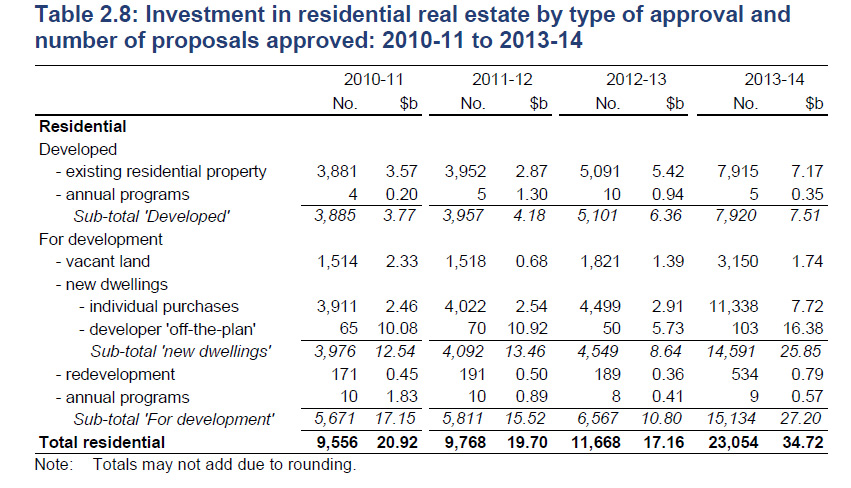
Approvals in 2013-14 were given for $167.4 billion of proposed investment. This represented a 23.4 per cent increase on the $135.7 billion in proposed investment approved in 2012-13. In real estate, approved proposed investment was $74.6 billion in 2013-14, compared with $51.9 billion in 2012-13. Proposed investment in commercial real estate increased, from $34.8 billion in 2012-13 to $39.9 billion in 2013-14. Proposed investment in residential real estate also increased, from $17.2 billion in 2012-13 to $34.7 billion in 2013-14.
 In 2013-14, three proposals were rejected (compared with no rejected proposals in 2012-13). Of the three proposals rejected, two related to residential real estate and the other related to the rejection in November 2013 of Archer Daniel Midlands Company’s proposed takeover of GrainCorp Limited.
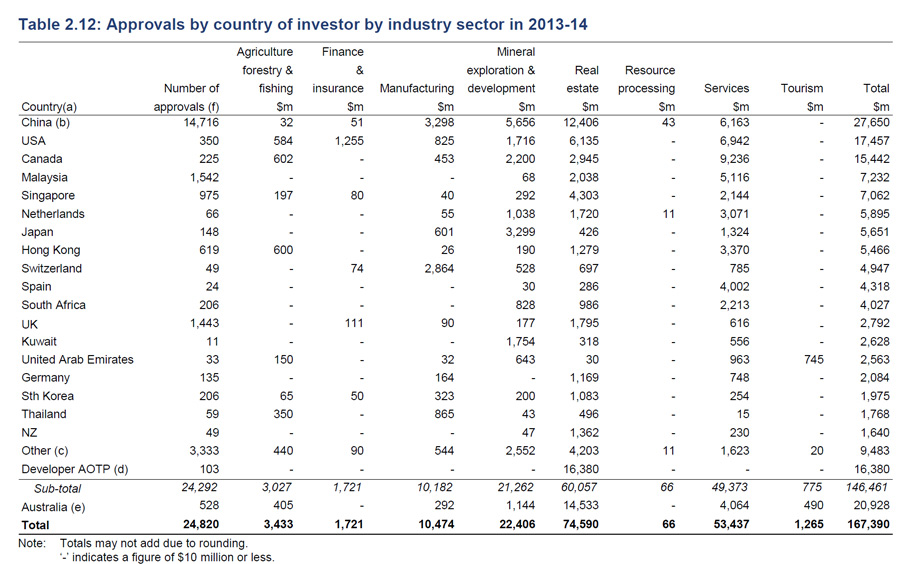
The real estate sector was the largest destination by value, with approvals in 2013-14 of $74.6 billion (an increase of $22.7 billion from 2012-13). In 2013-14, the other major sectors were: services (excluding tourism), with approved proposed investment of $53.4 billion (an increase of $27.5 billion); and mineral exploration and development, with approved proposed investment of $22.4 billion (a decrease of $23.1 billion).
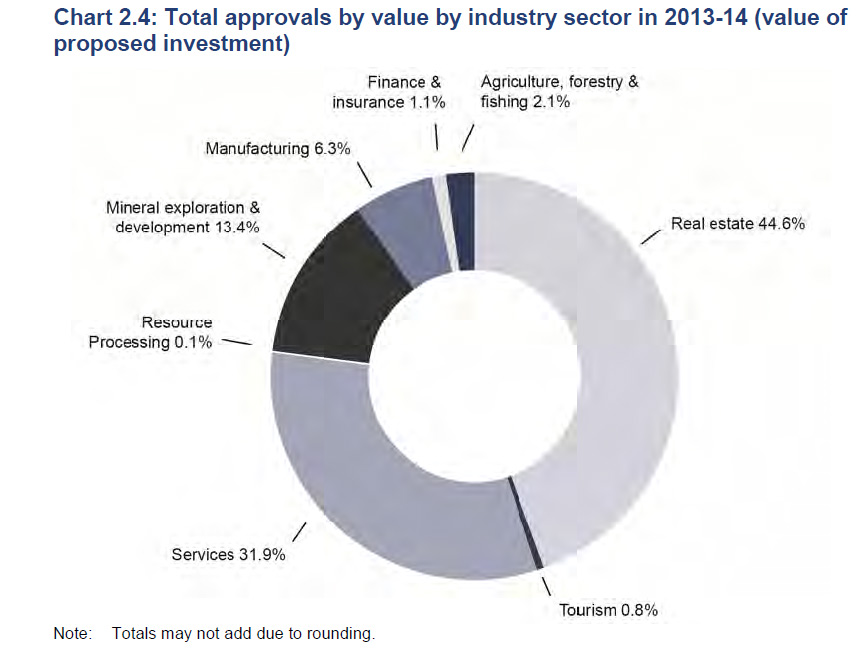 Real Estate accounted for 44.6% ot the total value. Here is the more detailed breakdown.
 For the first time China ($27.7 billion) was the largest source country for approved proposed investment in 2013-14, overtaking the United States ($17.5 billion). Other major source countries of approved proposed investment in 2013-14 were Canada ($15.4 billion), Malaysia ($7.2 billion) and Singapore ($7.1 billion).
On 25 February 2015, the Government released an options paper on Strengthening Australia’s Foreign Investment Framework. The paper is available on the Treasury website. The Government has announced that a $15 million cumulative threshold will apply to acquisitions of interests in agricultural land from 1 March 2015. More announcements are expected very soon on how the regime will be reinforced, with fines for potential investors who flout the rules, professionals who assist them, and rules to stop investors from profiting from any potential capital appreciation if they are found out, and forced to sell.