Steve Mickenbecker is Canstar’s Group Executive, Financial Services & Chief Commentator. https://www.canstar.com.au/
With more than 30 years of experience in the Australian financial services industry Steve enjoys sharing his expertise across topics such as home loans, superannuation, insurance, mortgages, banking, credit cards, investment, budgeting, money management and more.
CONTENTS
0:00 Start 0:32 Introduction 1:22 Latest Household Surveys 5:15 Retail 6:30 Low Low Rates 16:28 Buy Now Pay Later – UK Report 23:00 Customer Protections 24:40 Financial Education – The Spending Problem 32:40 Conclusions
Go to the Walk The World Universe at https://walktheworld.com.au/
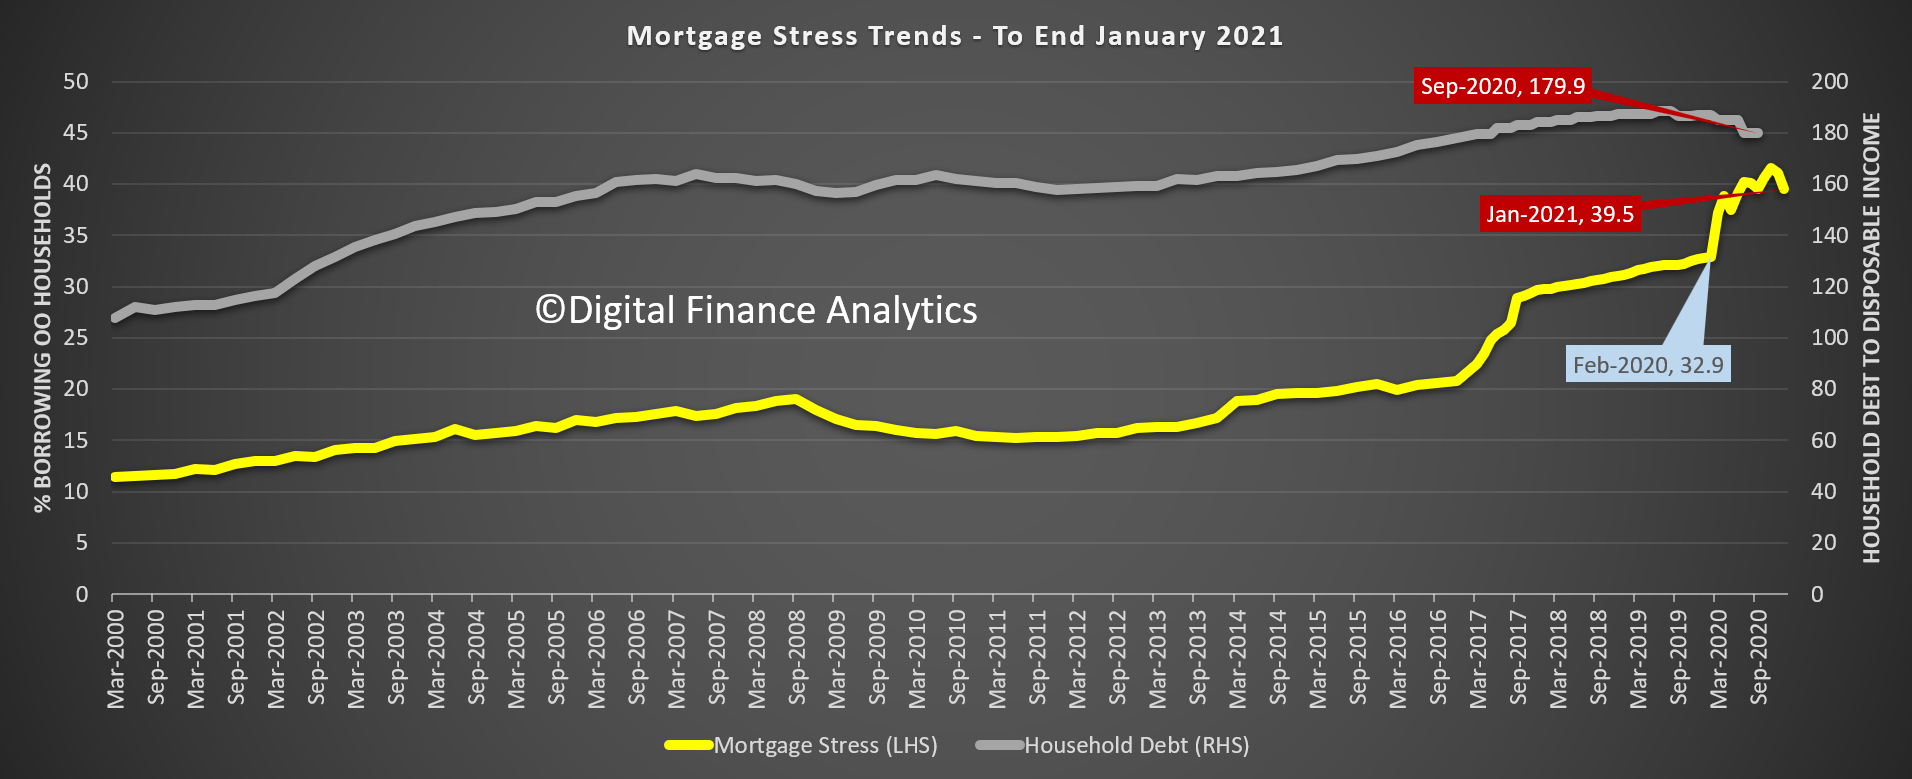
The latest results from our household surveys reveals that by the end of January 2021, overall levels of mortgage stress dropped below 40%, to 39.5% – still well above the level prior to the virus hitting.
This is a consequence of lower mortgage rates following the RBA cash rate cuts, liquidity support and quantitative easing, plus less impact from the virus on lock-downs and employment. That said, whilst many households have grown their savings buffers, a considerable number remain close to the edge, in cash-flow terms. More than 1.4 million mortgaged households remain under pressure
Across the states, mortgage stress fell significantly in VIC, but remains highest in TAS. Rental stress is still elevated, with NSW and ACT having the most significant issues, while property investor stress in also highest in ACT and NSW, thanks to falling returns from rents, and rising vacancy rates in some areas. As a result many property investors are considering selling into the autumn market rise.
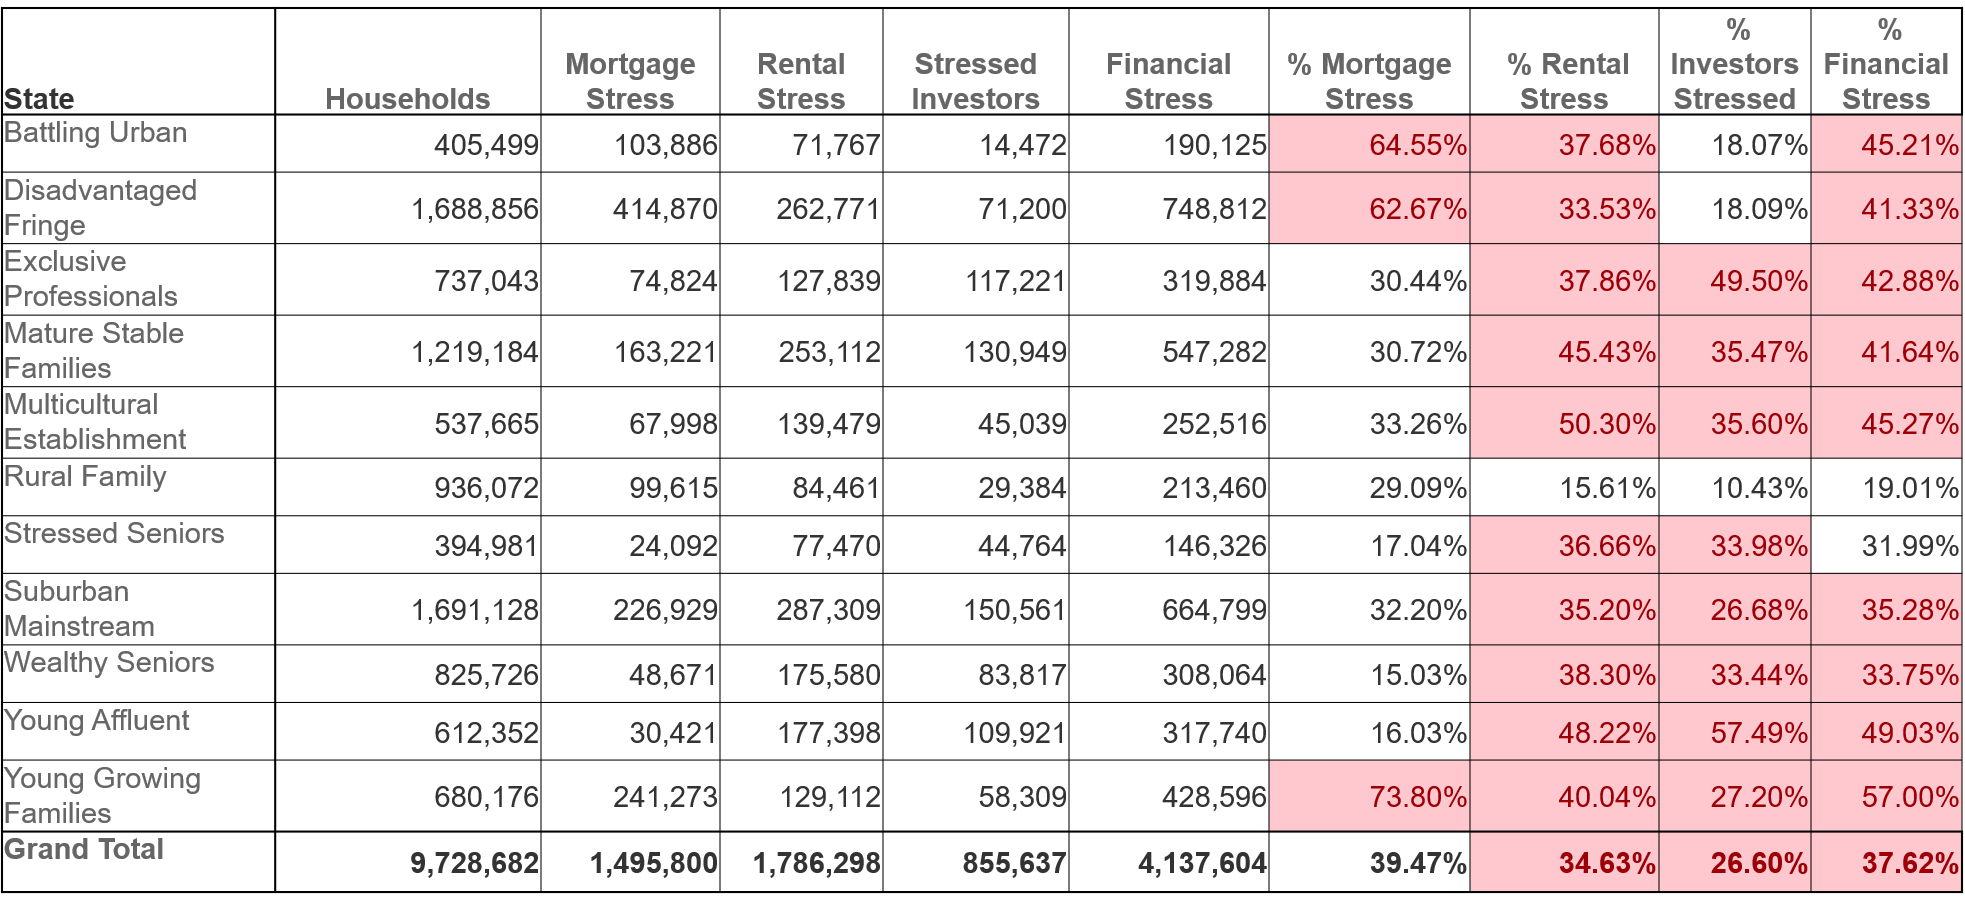
Levels of stress vary across our household segments, with many living on the urban fringe in the high-growth corridors still under pressure. A considerable number of more affluent households, often holding multiple investment properties are also under pressure. Young Growing Families, which include many First Time Buyers remain stretched, with overall Financial Stress (an aggregate of mortgage, rental and investor stress) are the most stressed.
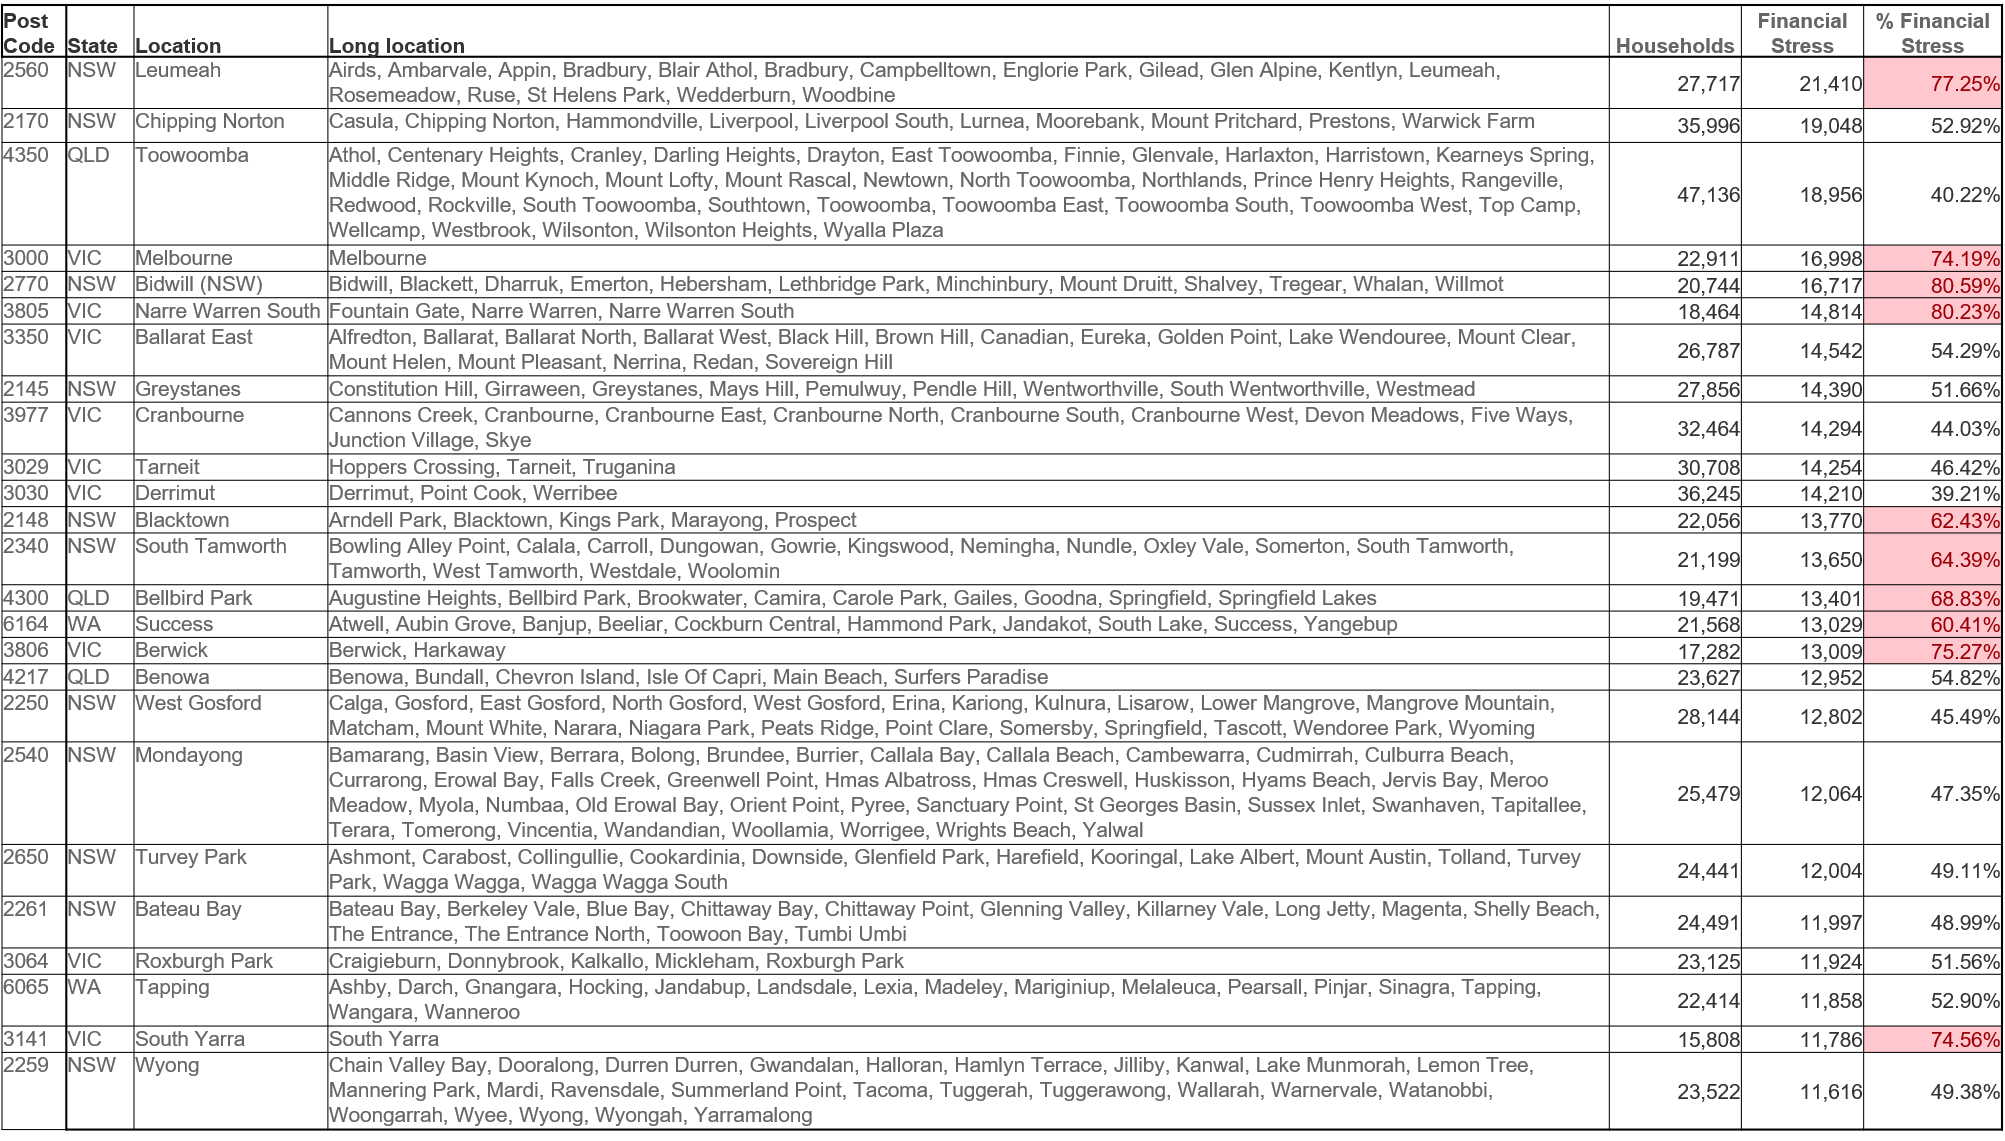
Looking at specific post codes – mortgage stress is highest (by count of households) in Narre Warren 3805, Cambelltown (2560) and Tapping/Wanneroo (6065). All high growth corridors.
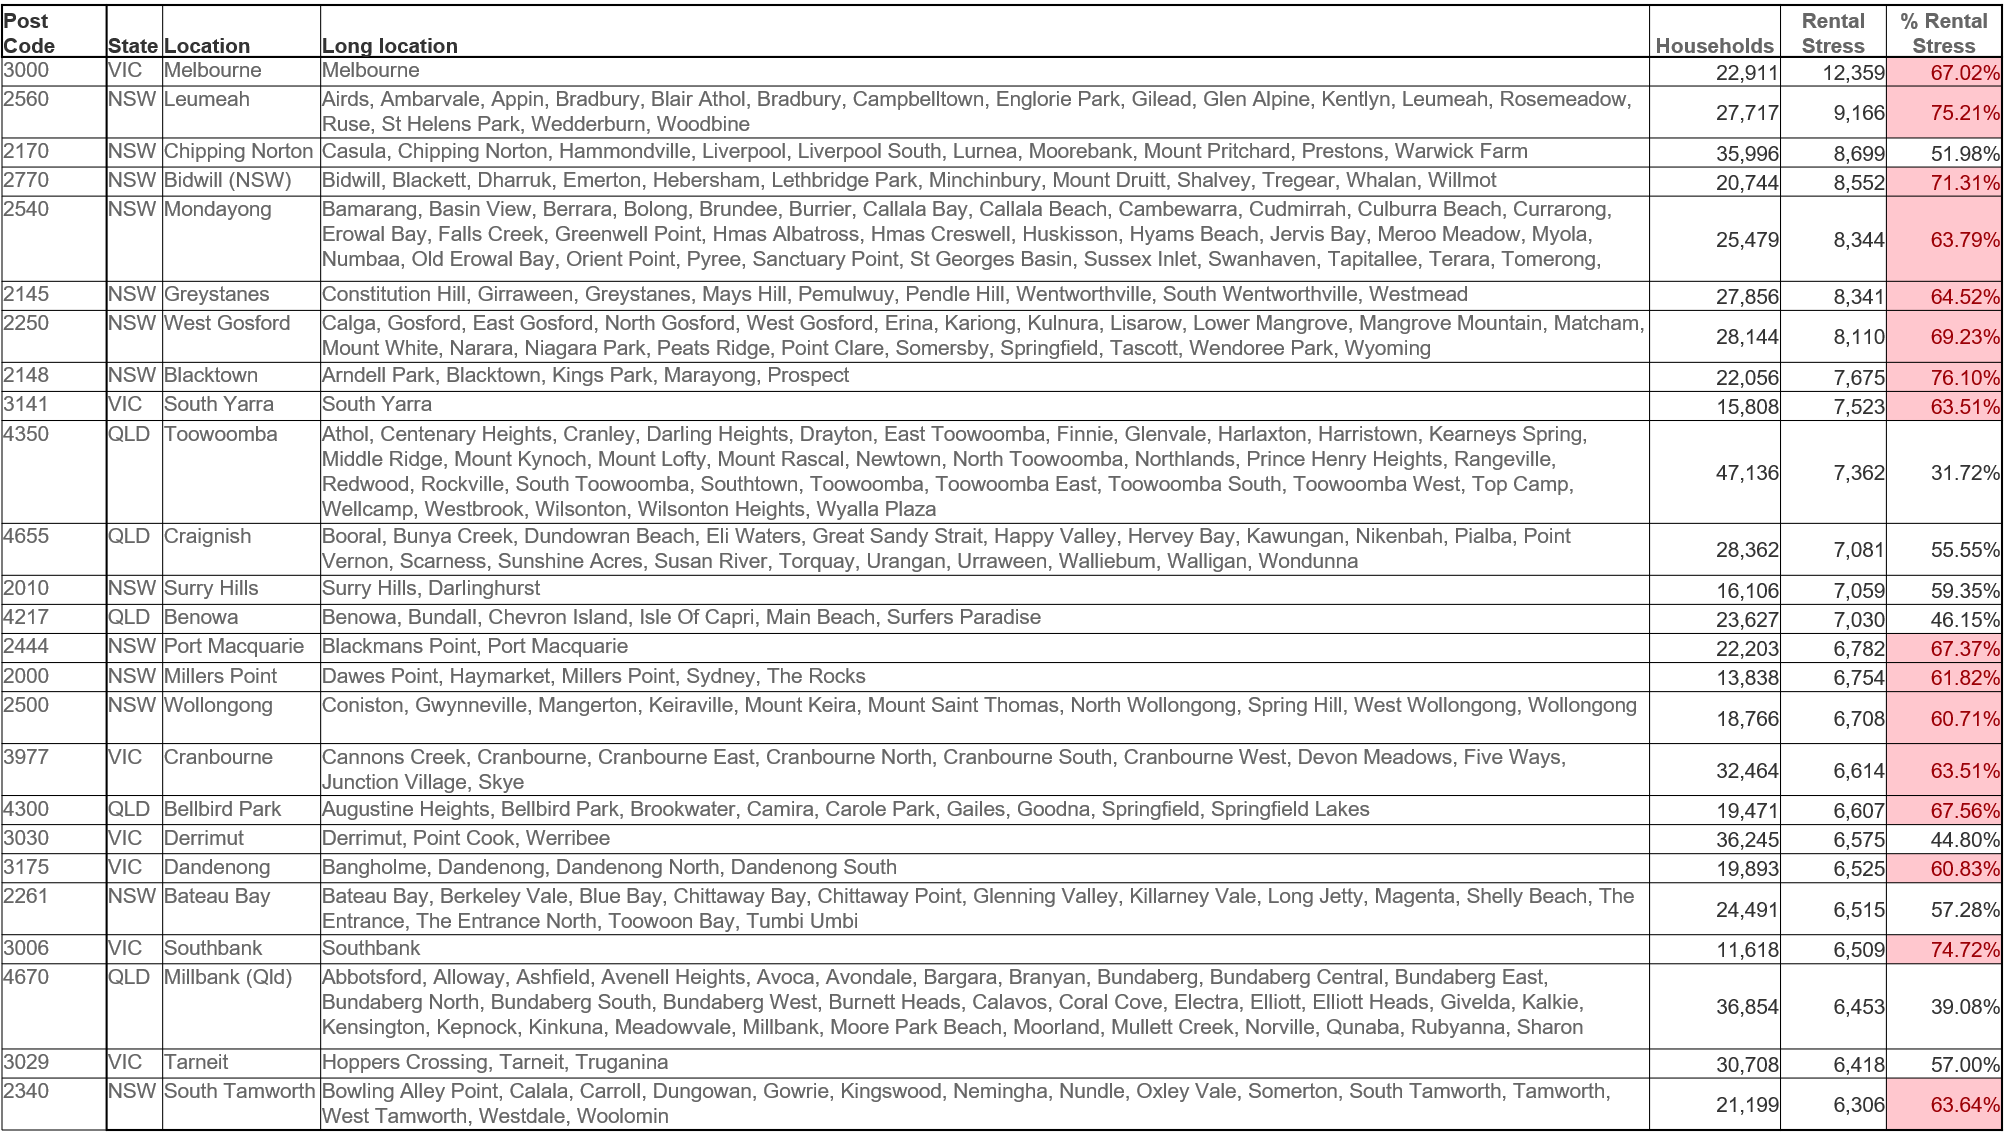
Rental stress is highest in central Melbourne (3000), Cambelltown (2560) and Liverpool (2170). Much of the pressure is from high-rise occupants, as well as in the high growth corridors.
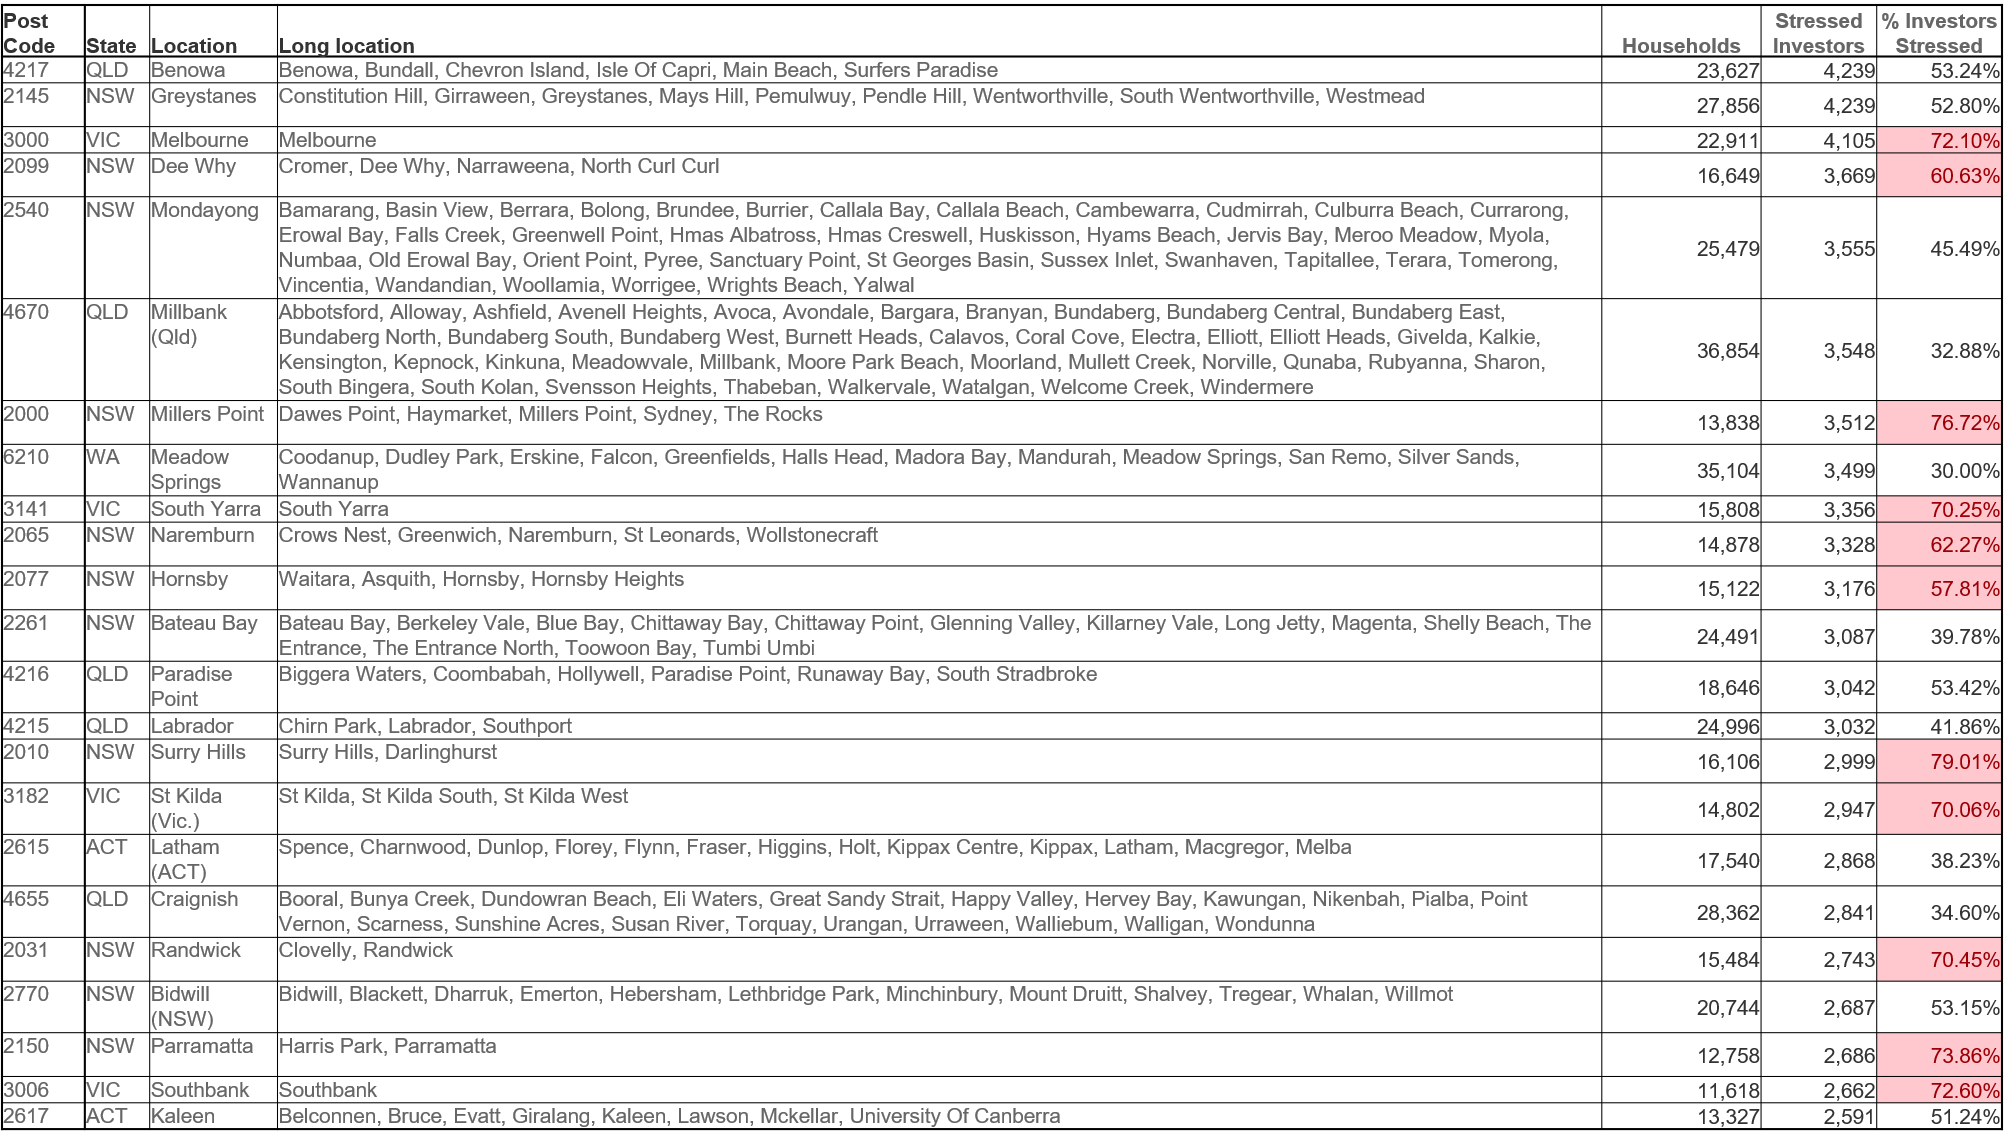
Property investor stress is highest in Surfers Paradise (4217) where tourism is well down, Central Melbourne (3000) and Northern Beaches (2099).
Finally, overall financial stress, our aggregate measure is highest in Cambelltown (2560), Liverpool (2170), Toowoomba (4350) and Central Melbourne (3000).
We discussed this data in detail on our live show last night.
We also updated our scenarios, reflecting the more positive economic news – though retain alternatives where the virus remains less contained. The path of the virus, and its control is clearly directly linked with economic performance and the trajectory of mortgage stress, and home prices ahead.
We discuss the latest Independent Reserve household survey on crypto, which highlights the momentum in Australia with the CEO, Adrian Przelozny.
CONTENTS
0:00 Start 1:42 Awareness 2:31 Adoption 4:20 State Variations 5:30 Age Distribution and Profit 7:30 Amount Invested 10:00 Trust And Confidence 11:15 Future Price Expectations 13:15 COVID Impact 14:20 Gender Divide 16:16 Superannuation and Crypto 18:45 Bitcoin V Ethereum 22:00 CDBC and Crypto 25:38 Close
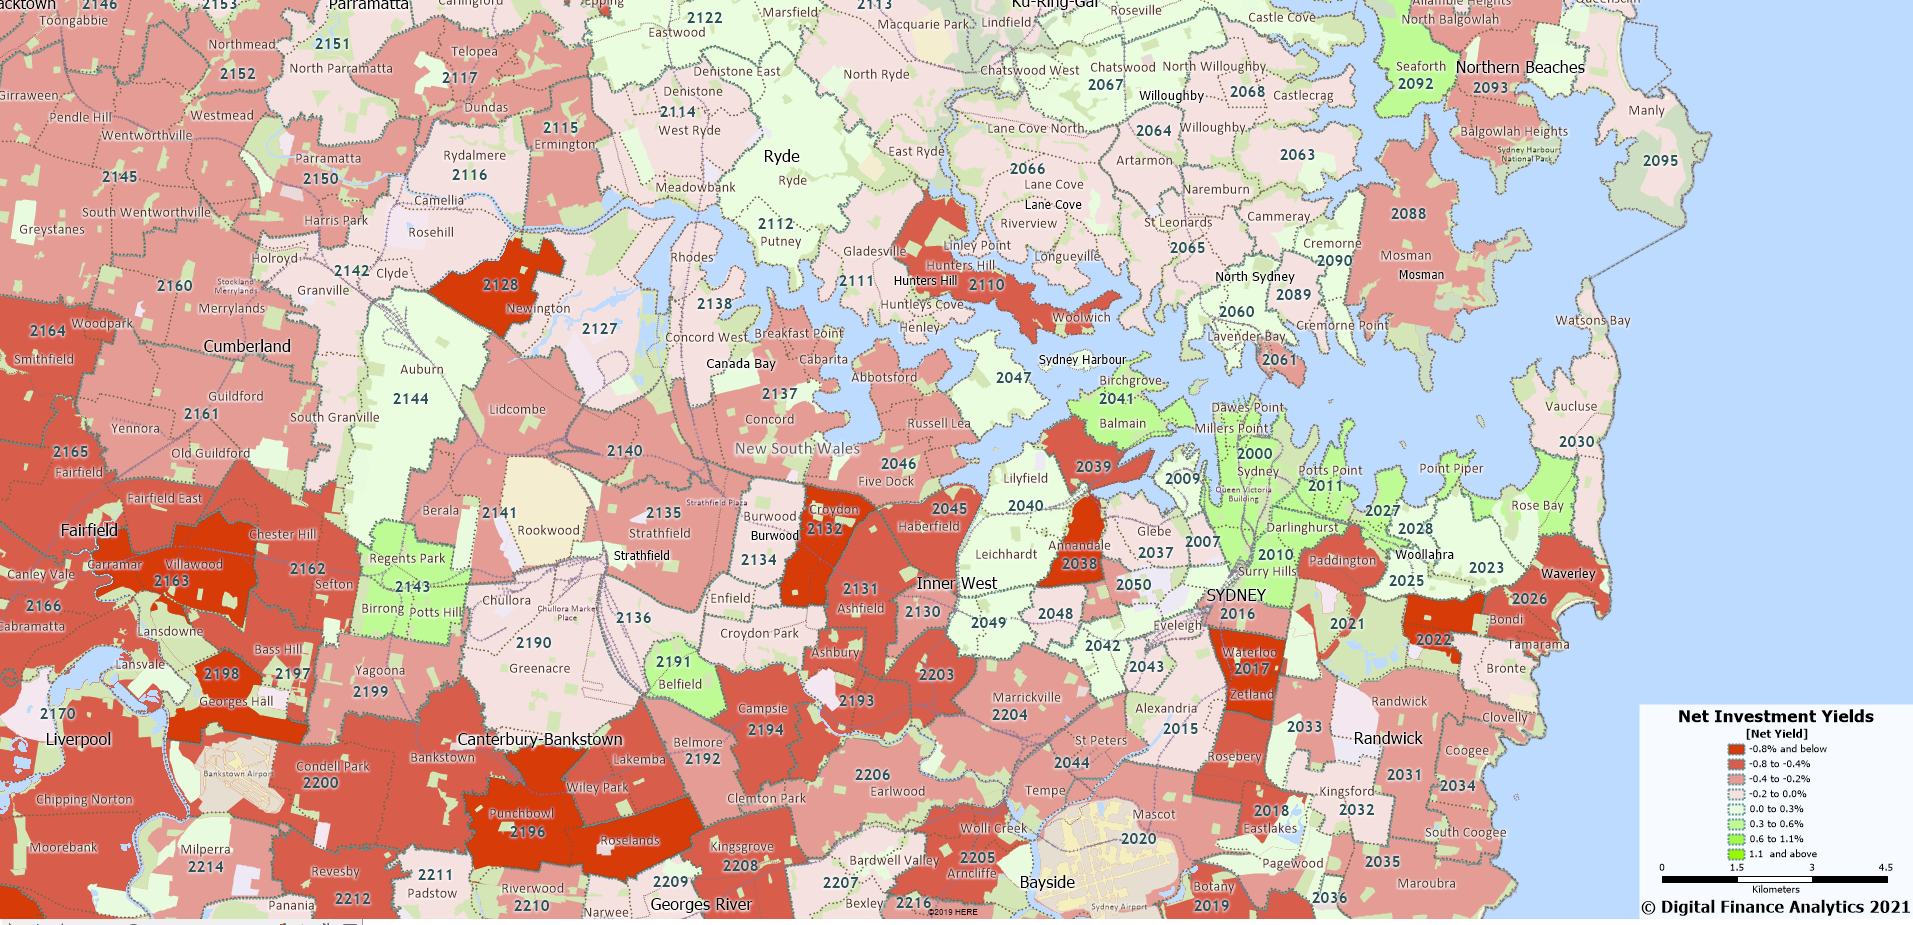
Join us tonight for a live Q&A as we walk though the latest data from our models, and explore financial confidence and property investor yield using our mapping tools.
We will also have our post code stress tool online to answer specific location queries…
Journalist Tarric Brooker and I have our Friday afternoon chat.
Contents 0:00 Start 0:32 Introduction 1:10 The China Factor 7:00 Iron Ore 10:00 Border Opening 12:35 Stimulus 15:30 Labor Positioning
22:30 Home Prices and the Election and K 29:14 Demand Drivers 32:10 First Time Buyers 35:00 Retiring With A Mortgage 39:30 Just Keep Paying The Mortgage 42:00 Economic Realities And Responsible Lending 42:45 Value Narrowed To Financial 46:00 Fear Factor 49:36 The Old New Normal 53:30 Ending
Go to the Walk The World Universe at https://walktheworld.com.au/
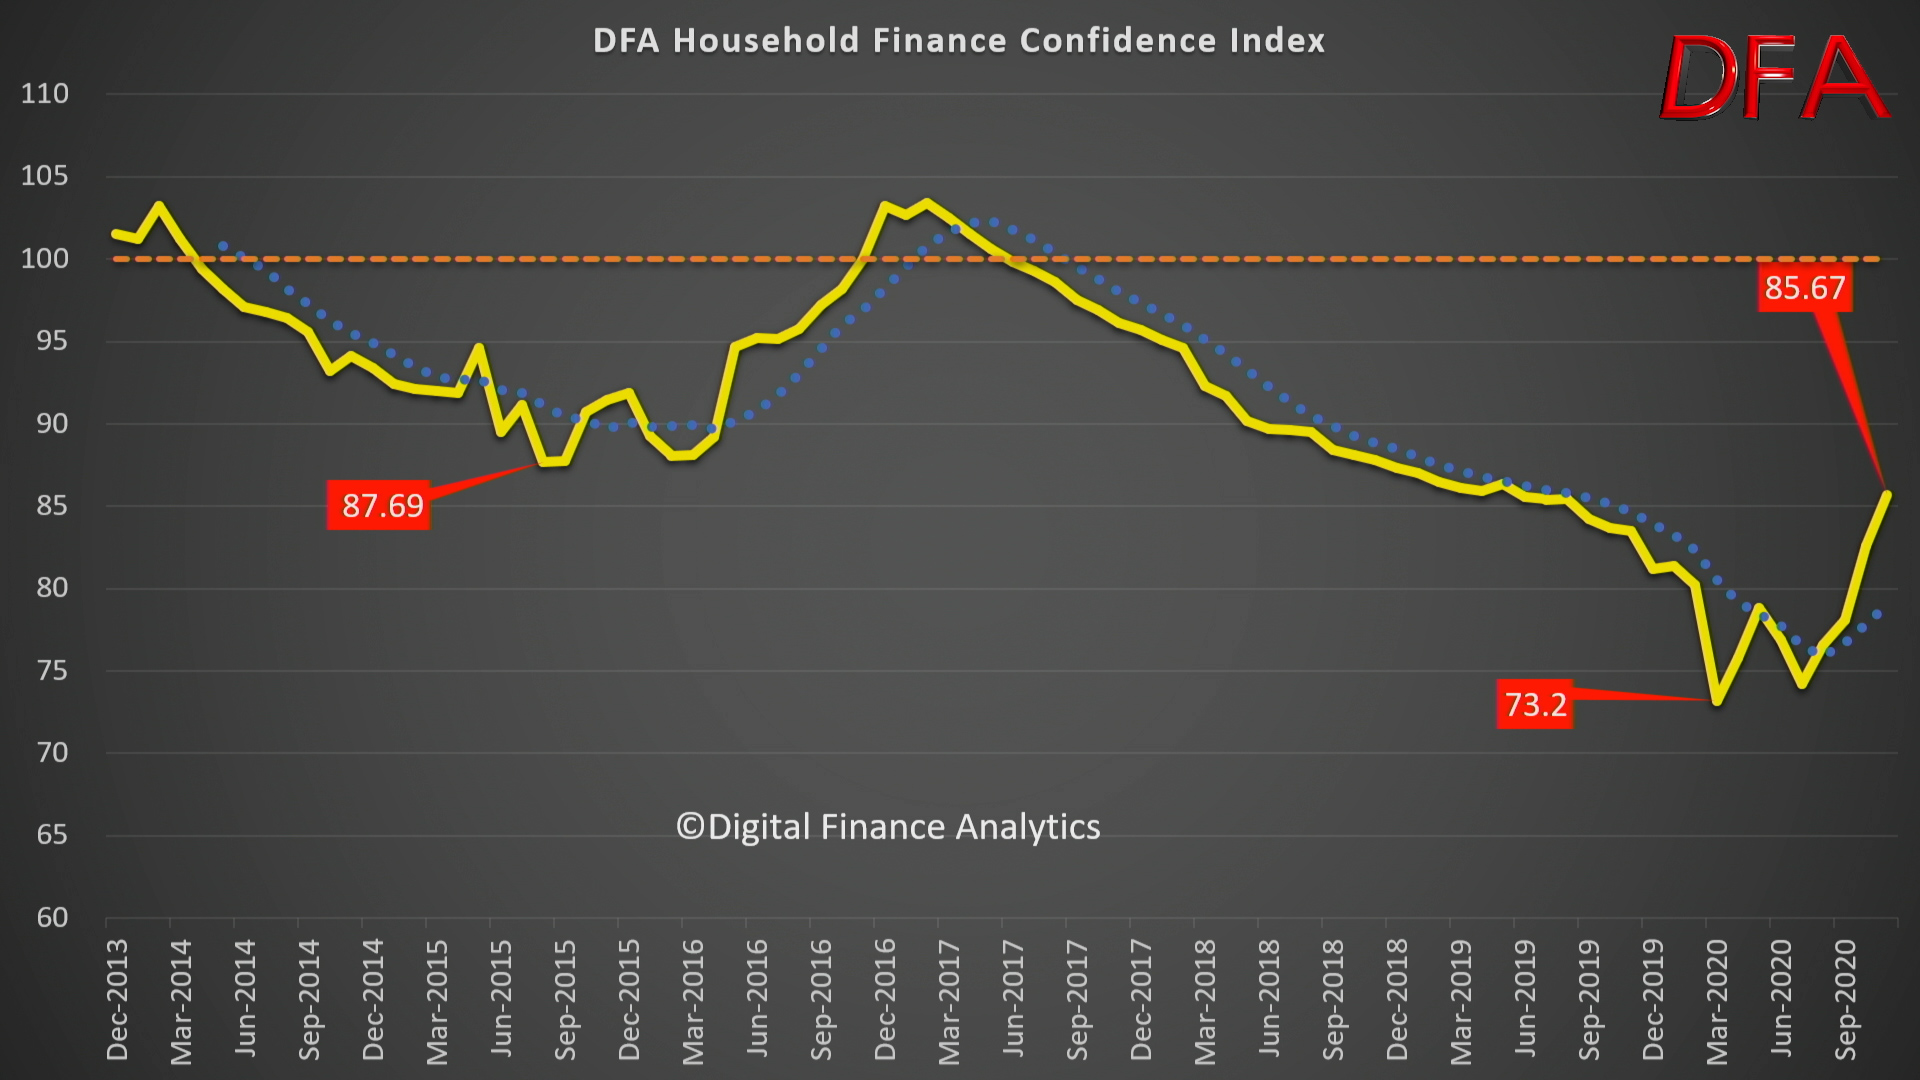
We discuss the latest data from our household surveys.
CONTENTS 0:00 Start 0:31 Introduction 1:00 Overall Index 2:10 Property Segments 3:30 By States 4:20 By Age Bands 6:15 Wealth Segments 7:11 Job Security 7:56 Income 8:30 Costs Of Living 9:45 Savings 10:57 Debt 12:40 Net Worth 14:24 Other Indices 18:25 Conclusions 20:09 Outro
Go to the Walk The World Universe at https://walktheworld.com.au/
Steve is Canstar’s Group Executive, Financial Services & Chief Commentator. He and I discuss the traps created by low rates, and what households need to consider in reaction to them.