Steve is Canstar’s Group Executive, Financial Services & Chief Commentator. He and I discuss the traps created by low rates, and what households need to consider in reaction to them.
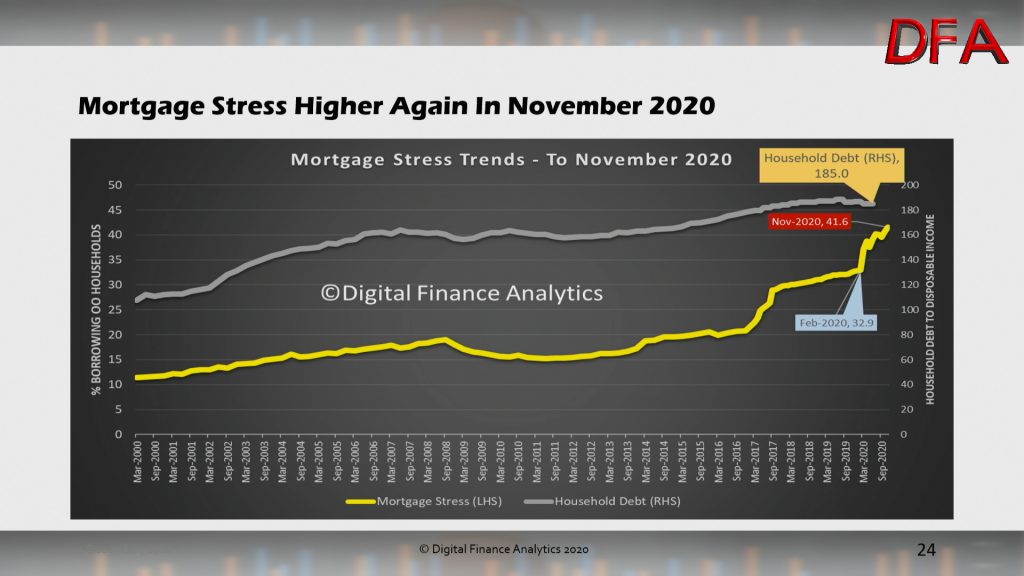
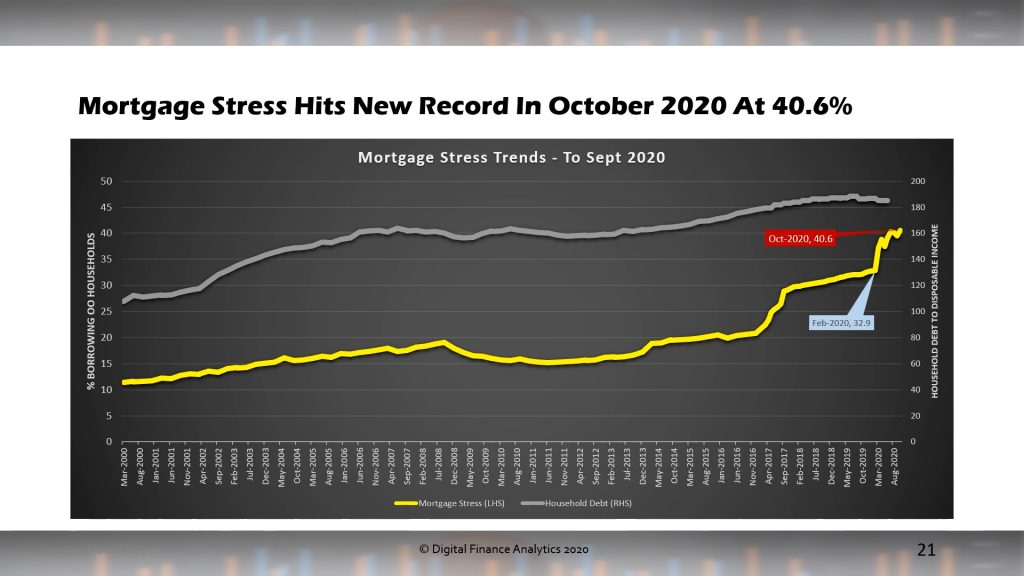
This was not meant to happen – after all the official story is we are in recovery mode – yet the latest results from our rolling household surveys tells another story as unemployment and underemployment rise further, even as Government financial support is tapered down. As a result mortgage stress – those households with a mortgage and cash flow pressures – rose to an astonishing 41.6% in November. Before the pandemic we sat at 32.9% in February, so nearly 10% more households are now feeling the pain.
The surveys showed some mixed drivers of this result. Sure, a number of larger firms have come off JobKeeper as the economy reopenes but more smaller firms are putting people on JobKeeper, even as the level of support is reduced. This was confirmed by the segmental analysis of the latest payroll data which showed growth among larger firms but a fall among smaller firms.
More households have had to recommence mortgage repayments now, with the ABA reporting that among the top 7 largest banks, deferred loans dropped from a peak of $250 billion down to $86 billion in November, with home loan deferrals by the seven largest banks are down to fewer than 145,000. But this has placed considerable pressures on households recommencing, even as unemployment continues to rise – to 7% in November according to the ABS and remember this is artificially understating the true picture as JobKeeper recipients are excluded.
The unemployment rate increased 0.1 pts to 7.0% (1.7 pts higher than a year ago)
Unemployment increased by 25,500 to 960,900 people (and increased by 238,900 over the year to October 2020)
The youth unemployment rate increased 1.0 pts to 15.6% (and increased by 3.1 pts over the year to October 2020)
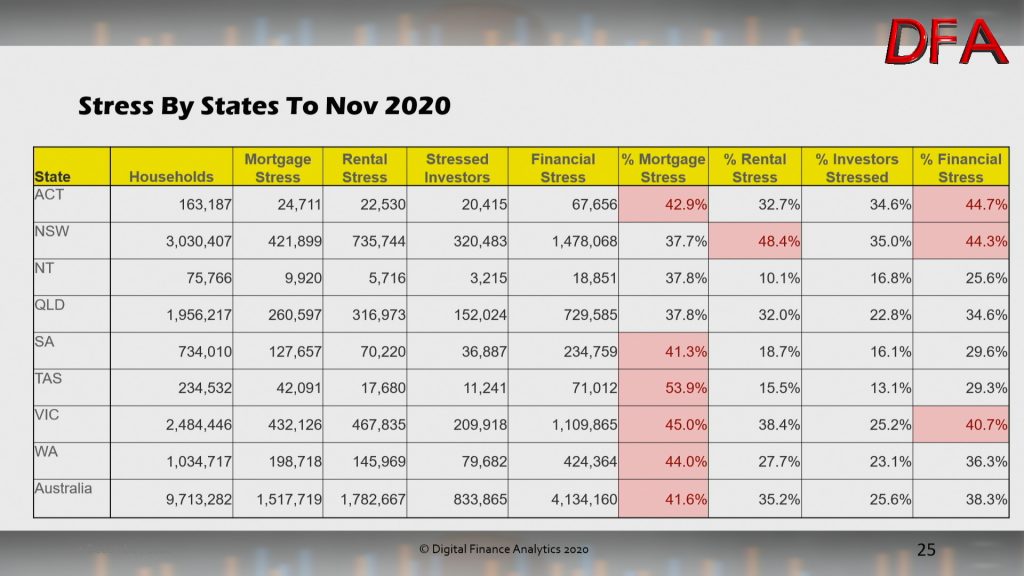
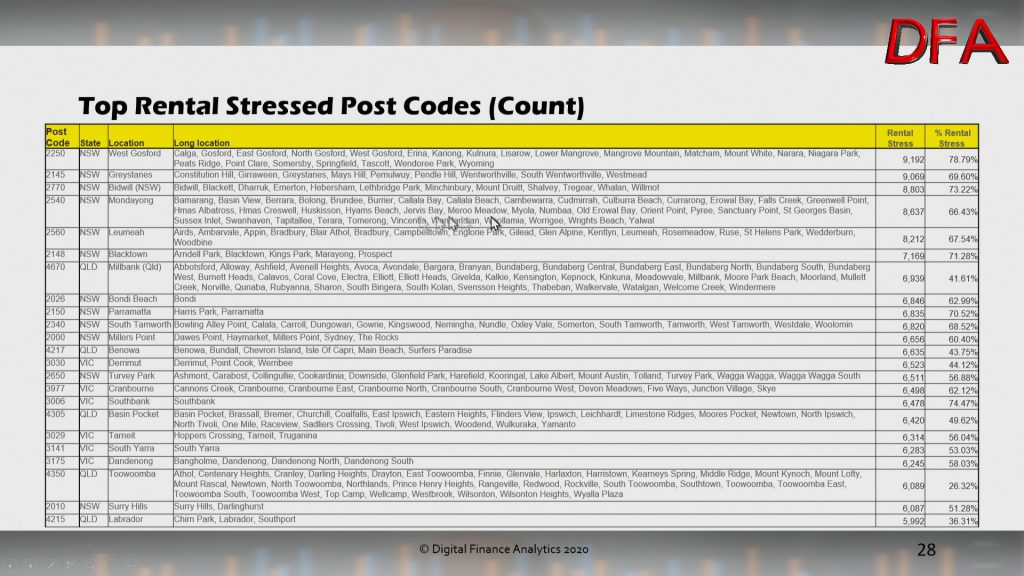
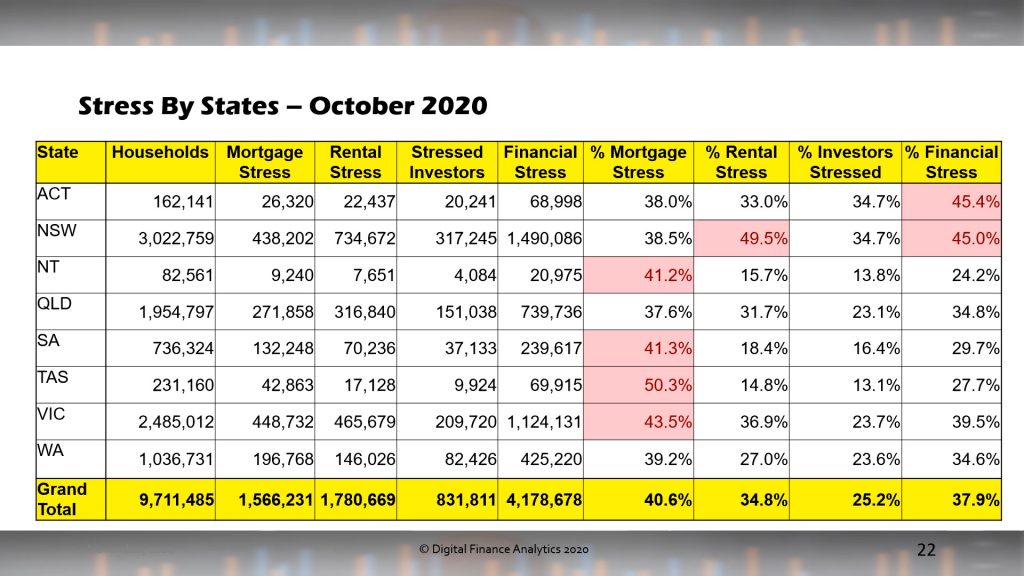
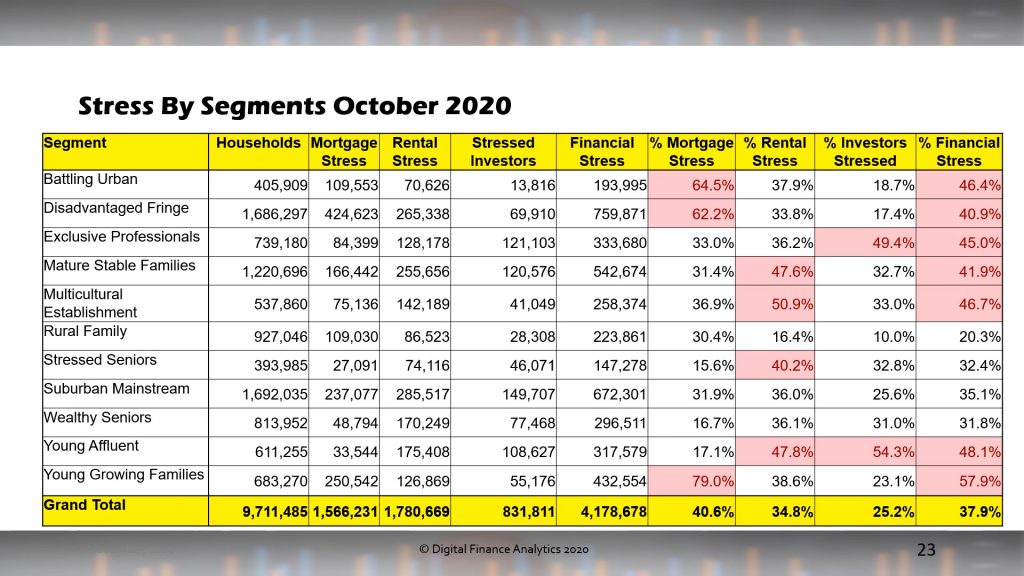
Our analysis also examines Rental Stress, Property Investor Stress and overall Financial Stress by state and household segment.
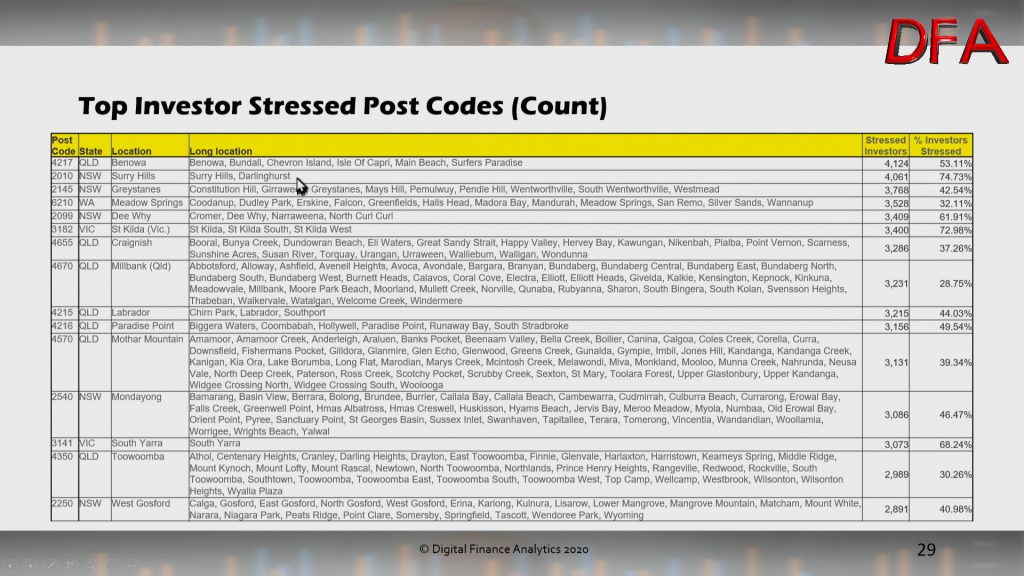
Across the states, Tasmania still retains top mortgage stress spot in in percentage terms, followed by Victoria and Western Australia. Rental stress is highest in New South Wales and Victoria, and across Australia. On average 35.2% of those renting have cash flow issues. Among property investors, 25.6% reported a cash flow deficit, as rents fall, and vacancies rise. More are still considering selling – especially those holding high-rise apartments in Sydney and Melbourne.
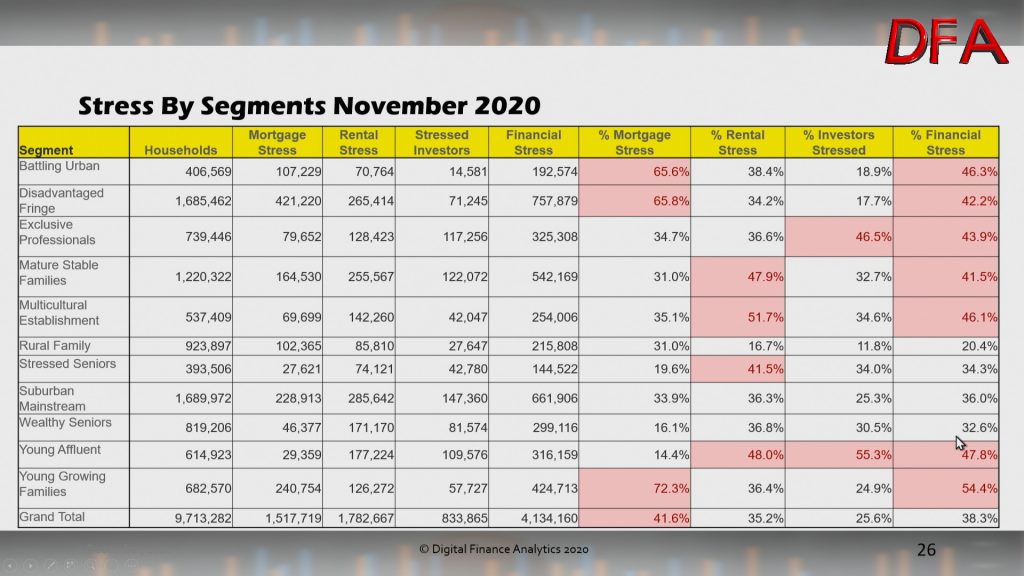
Across our segments, mortgage stress is highest among young growing families, which includes many first time buyers who were attracted into the market by Government incentives. This will not end well. Those living in the high growth corridors are also under pressure, especially on the urban fringe. And we see more affluent households caught up in stress, thanks to higher levels of unemployment – and high leverage.
Rental stress is broad based, with many first generation migrants under pressure, as well as young affluent.
Many affluent households with investment property are stressed, thanks to the proliferation of multiple properties, and high leverage, even as rentals fall in some areas. Once again, units are most exposed.
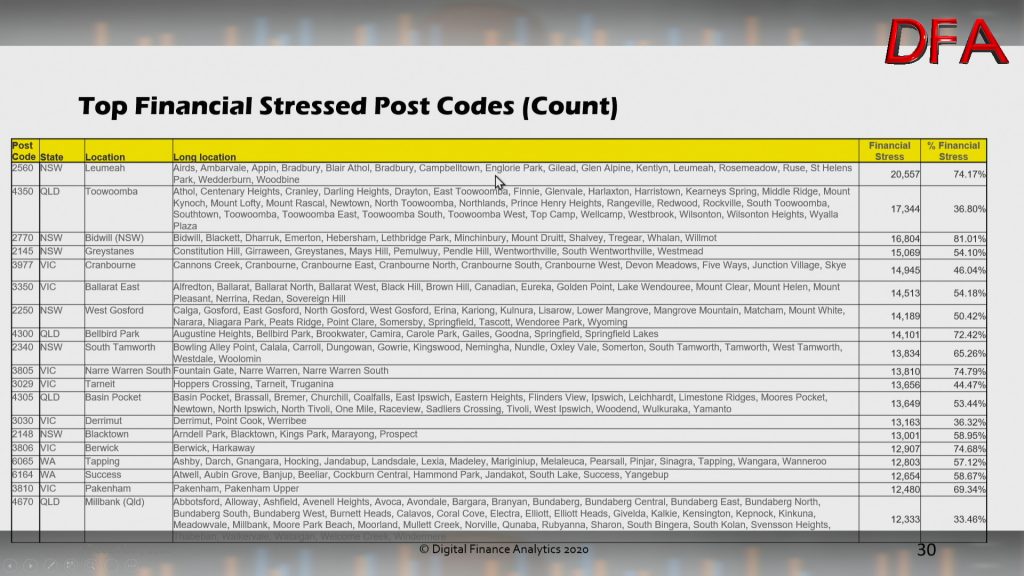
Overall financial stress (an aggregate of the three elements we discussed) is broad based across our segments. This is a significant structural issues – and one which was already in play BEFORE the pandemic. But it is significantly worse now.
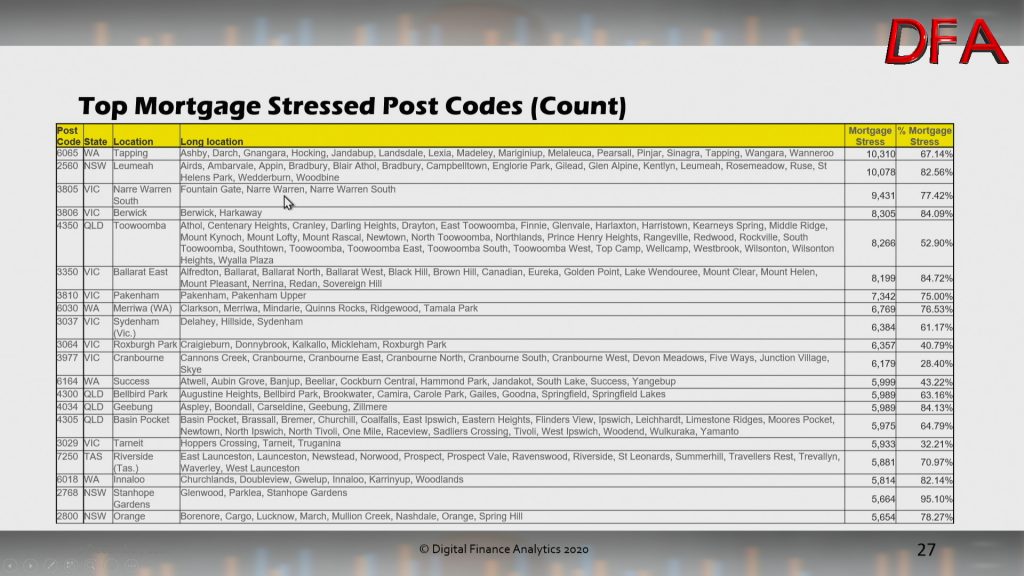
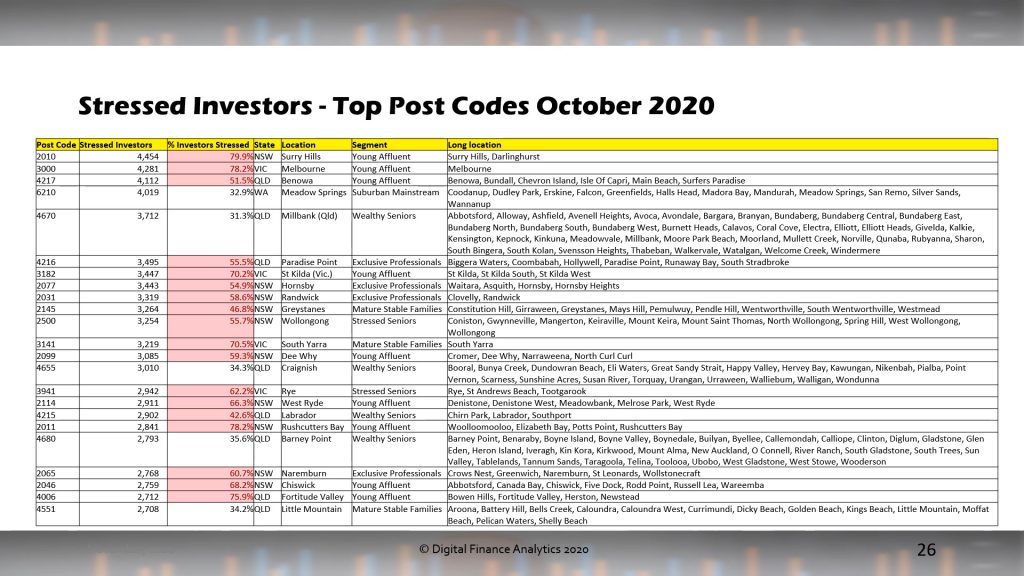
The top postcodes by mortgage, rental and investor stress are presented below. This data is sorted by the number of households impacted by stress (again in cash flow terms). We see high representation in high growth corridors across the country, as well as some inner City suburbs.
Investor postcodes show the location where the investor resides, not necessarily the location of their investment properties.
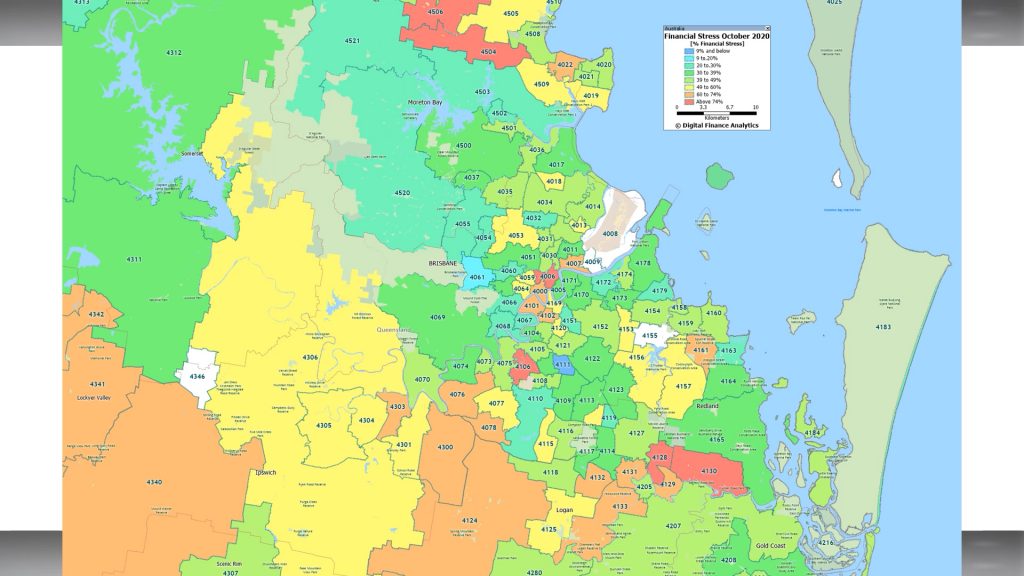
Overall financial stress is highest in the high growth corridors, areas where many households are under pressure, yet also areas where more development in under way and home land packages are being pushed very hard though the current Government schemes.
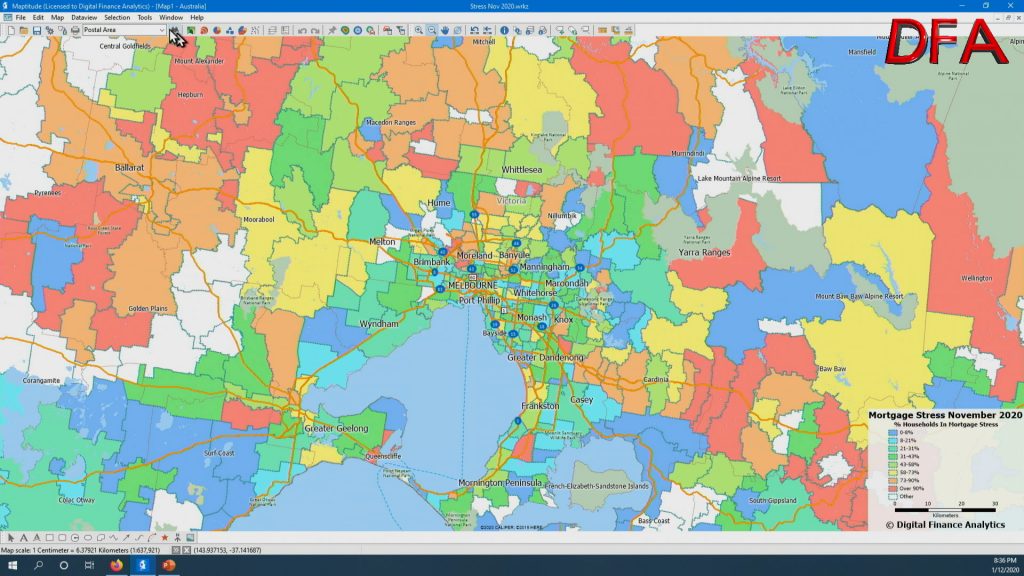
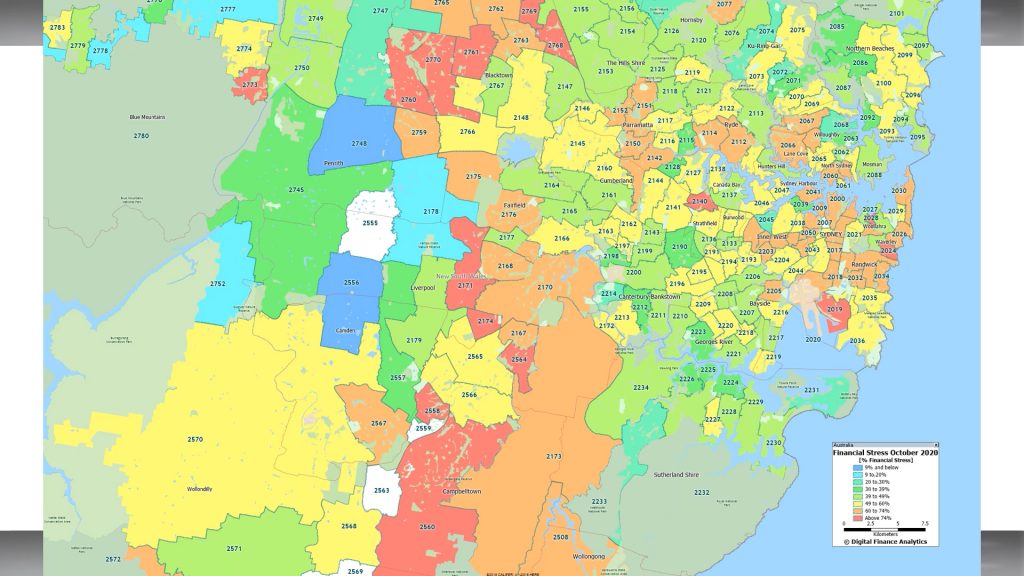
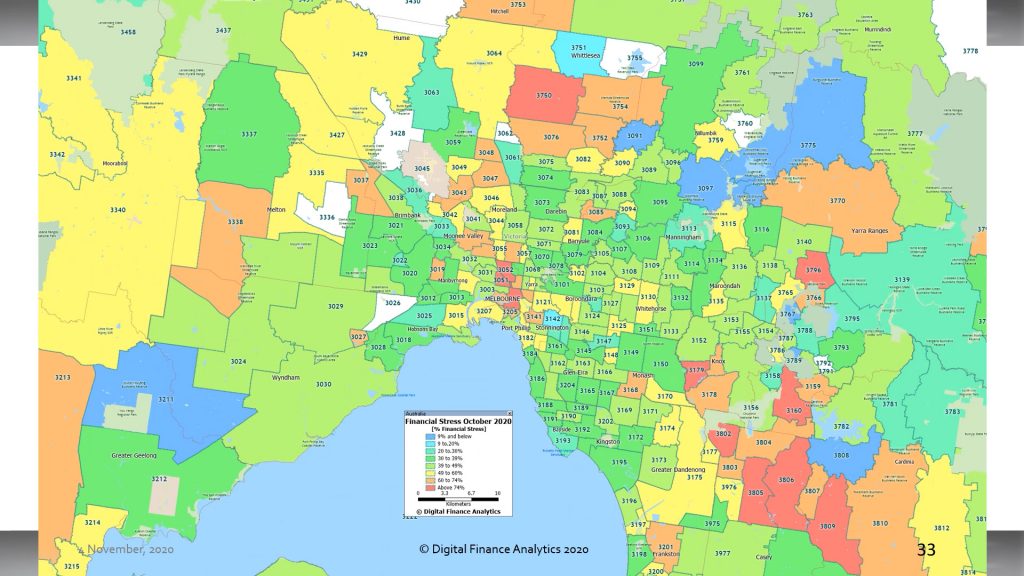
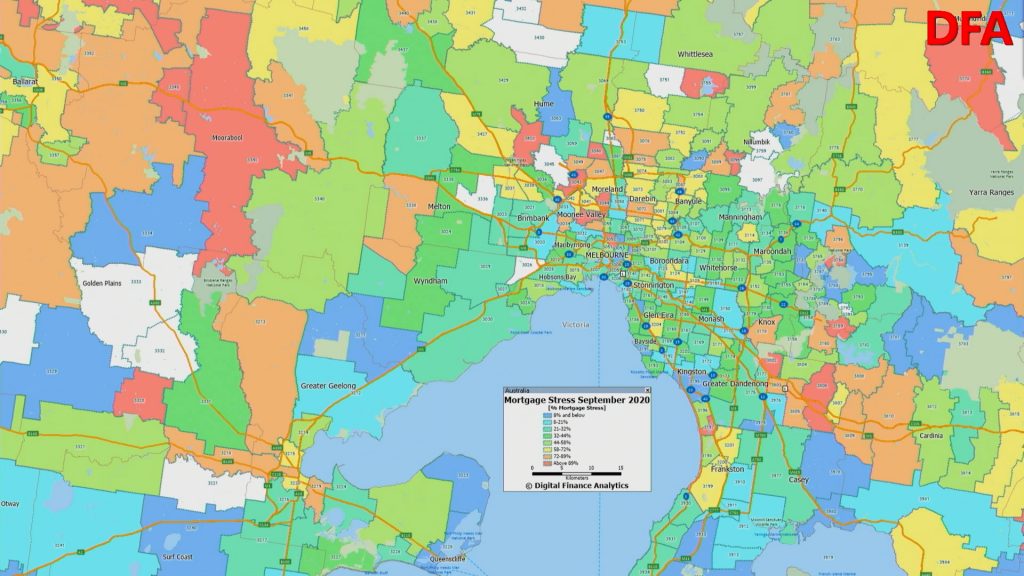
We also mapped the stress – here is an example of mortgage stress in Melbourne. This is to illustrate the patchwork nature of stress (orange and red are high stress areas).
Two final points, as Government support is wound back further, especially in the March quarter next year it seems likely stress will continue to bite, unless unemployment turns around faster than expected.
And as the ABA said recently
“Don’t wait till you are in over your head, talk to your bank, they’ll help you find a way through this. Don’t tough it out on your own”,
This is excellent advice, and should sound a note of caution to those who are considering a property move in the current environment. Mortgage stress can put considerable pressures on households, and often leads to a sale later. So new purchasers should be cautious, and develop their own cash-flows prior to committing – just because a lender agrees to make a loan, this does not necessarily mean its a sensible decision from a borrowers point of view – a bank has a completely different view of “risk”. So buyers beware!
Join us for a live Q&A as I discuss the latest results from our surveys and explore the impact at a post code level. You can ask a question live via the YouTube chat as we explore the latest economic data together. And yes, I will have my stress mapping and post code analytic engine online…
My latest Friday discussion with Journalist Tarric Brooker. Can we believe the official data, and does it make sense? Does it make you blind? Tarric is @AvidCommentator on Twitter.
0:00 Start 0:55 Economic Indicators 7:39 Extend And Pretend 10:35 Confidence 16:54 Narrative Versus Reality 23:06 China and Trade 25:56 Parliamentary Behaviour 35:34 Labor Getting Wedged 39:05 Housing Market 42:4 Get Granular 46:43 USA 48:16 Ending
Steve Mickenbecker is the Group Executive, Financial Services at Canstar. I discuss the recent rates changes across the markets in Australia, consider the implications for savers, and touch on negative rates down the track.
The results from our latest household surveys reveals that despite the return to work as the lock down is eased, the reduction in JobSeeker, JobKeeper and the need to renew mortgage payments are all offsetting the better job news, in a low income growth, high cost environment.
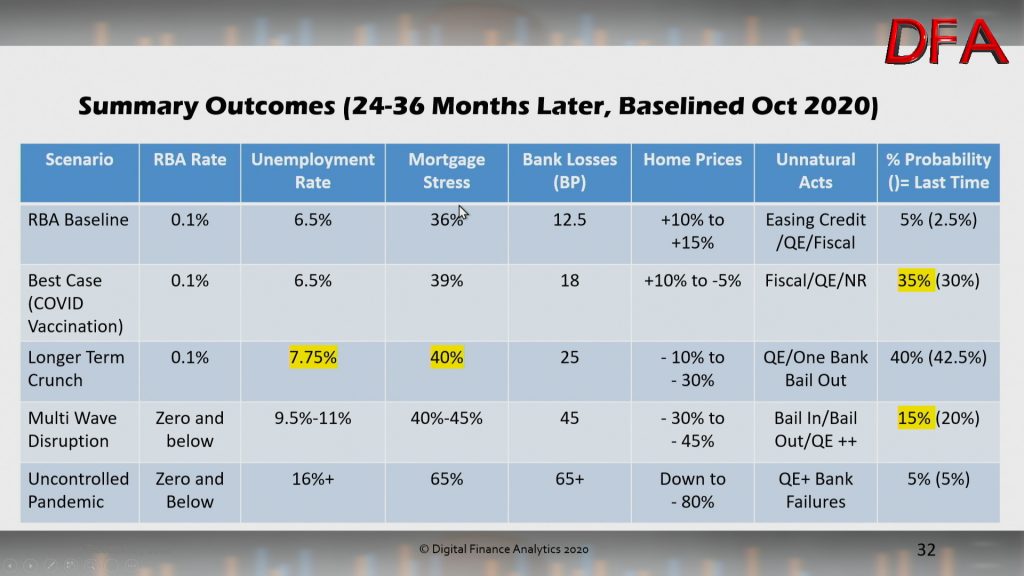
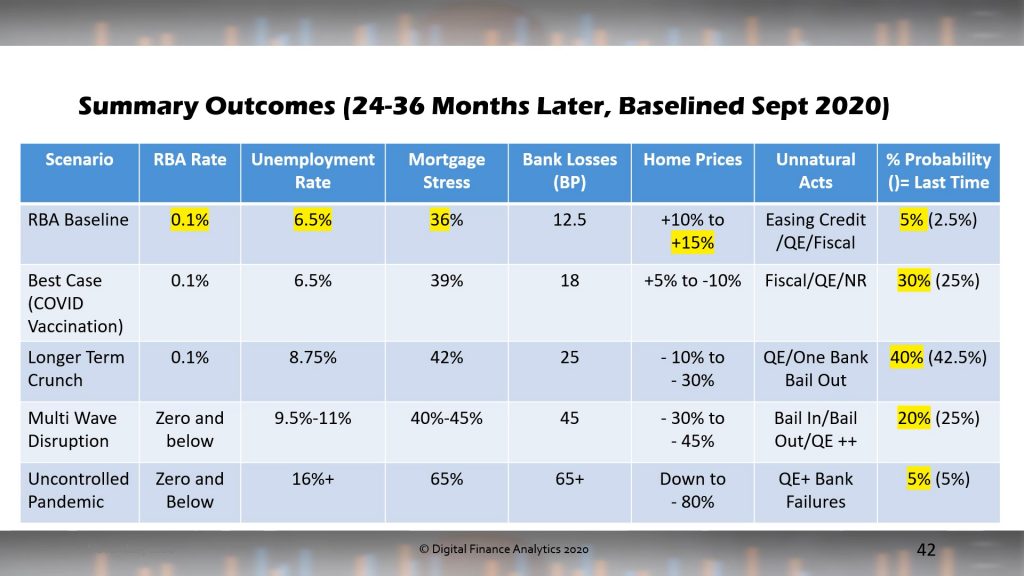
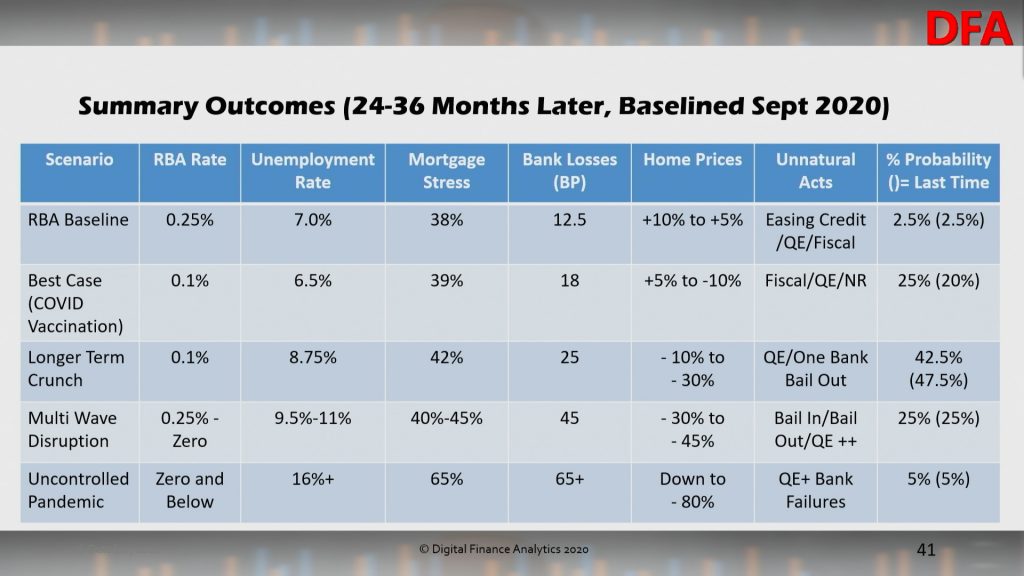
We also updated our property and finance scenarios to take account of the RBA announcements yesterday. There is still a path for higher property prices ahead, but this is not our central scenario over the next 2-3 years. Handling the virus will be a critical issue ahead.
We discussed this in detail on our live stream Q&A.
We measure stress in cash flow terms, recognising that households may have access to credit or savings in the short term, rather than a set proportion on a mortgage repayment. In addition we examine those renting, and those with investment property to give a more complete picture. Note our approach is different from those preferring to use a set percentage of income.
Mortgage stress rose to 40.6%. This is a new record.
Across the states, mortgage stress is most severe in Tasmania and Victoria, whereas rental stress is highest New South Wales. Investor stress is also highest in this state together with the ACT. Overall financial stress is highest in NSW and ACT, with VIC following closely behind.
Across the segments, young growing families (including many first time buyers are the most exposed to mortgage stress, whereas rental stress is hitting younger affluent, first generation migrants and older households. More affluent households are experiencing higher levels of property investor stress, as they are more leveraged, and often have multiple properties. In aggregate Financial stress is touching a wide range of our cohorts.
We present the top post codes (in terms of count) for each stress dimension.
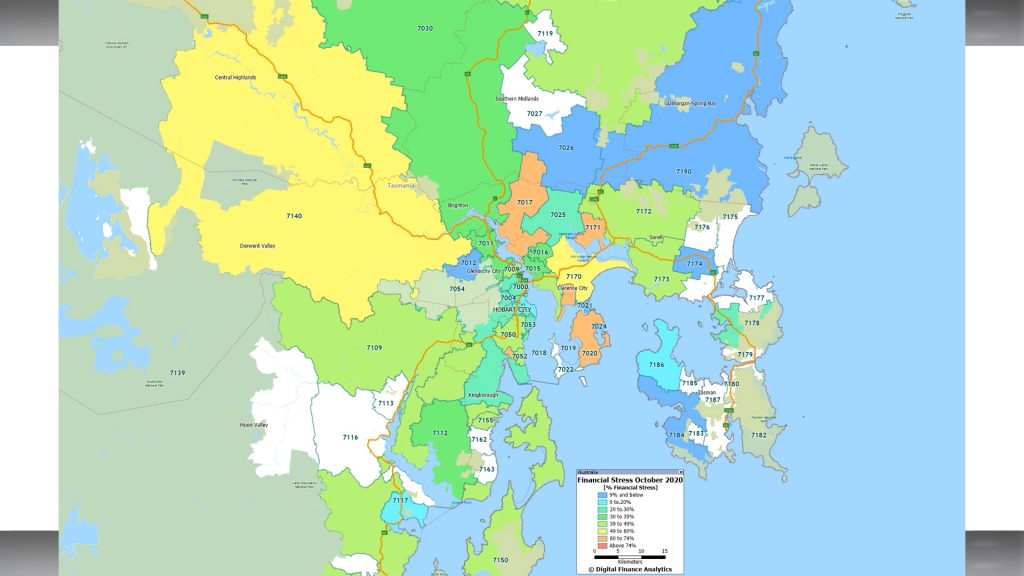
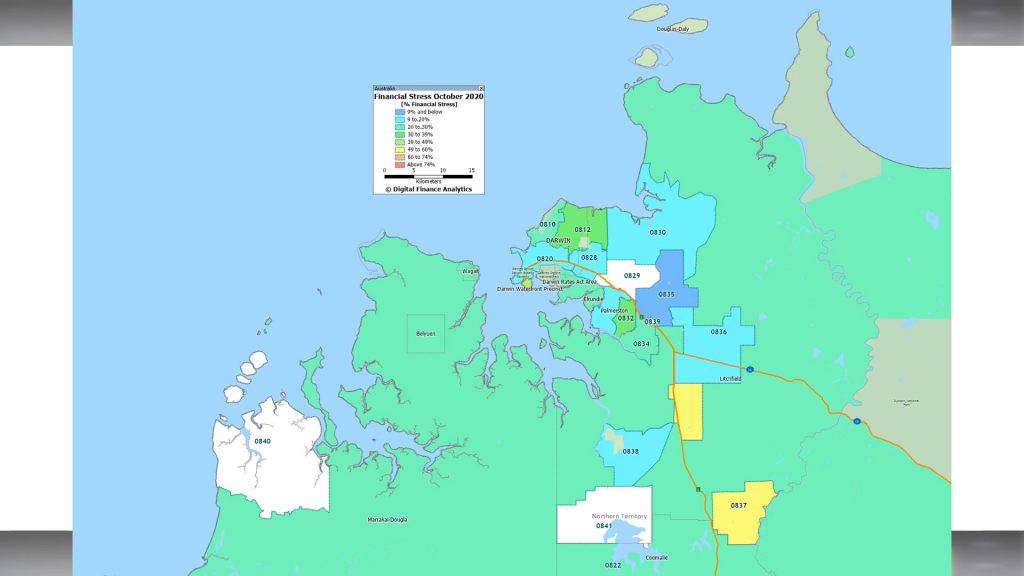
And for the first time we have mapped aggregate financial stress for each major centre, highlighting that pressures on households are impacting a range of locations. Generally the high-growth corridors show significant issues, but even more established areas are also under pressure.
Our view is that we are still in the foothills of the financial crisis, and that as stimulus is withdrawn further, and unemployment continues to rise, stress will deteriorate.
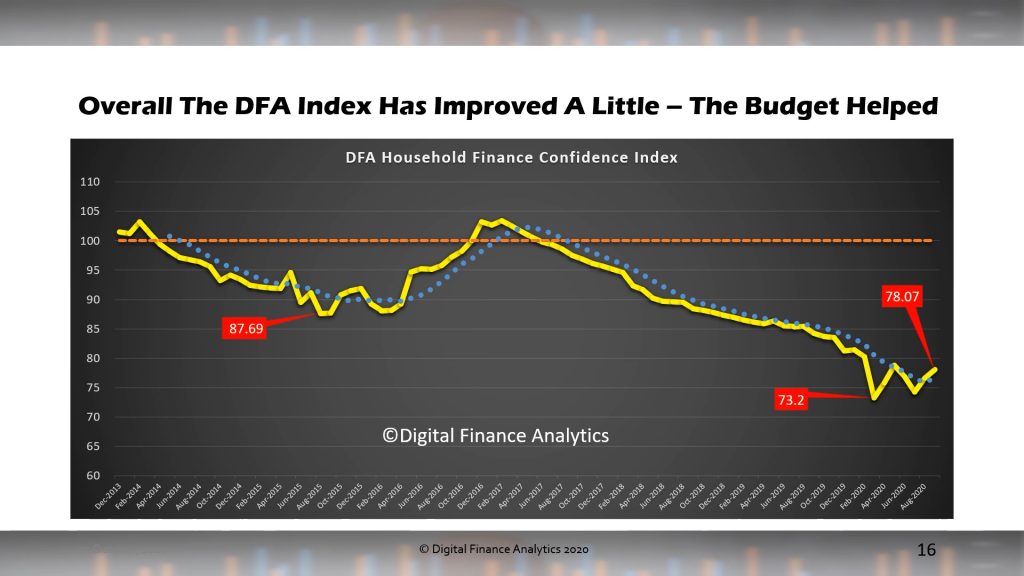
We have released the latest update to our Financial Confidence index, with data to 20th October 2020, later than usual, because we wanted to see if there was a post-budget bounce (as trumpeted by one index provider last week!).
We discussed the findings in our most recent live show:
There was a slight recovery, but nothing which takes our index out of the “gloom” zone. The latest reading is 78.07 still well below the neutral setting.
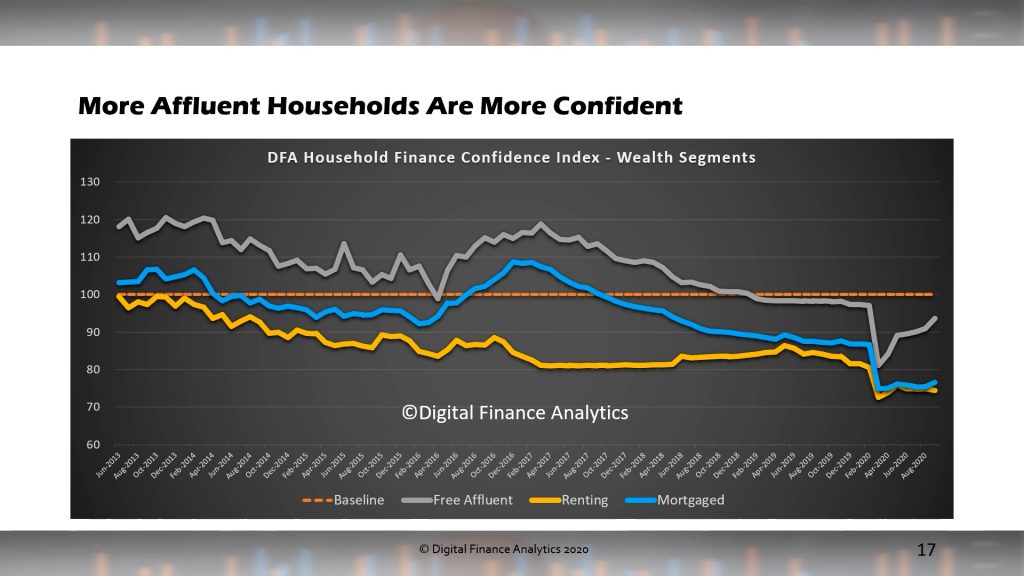
By our affluence segmentation, those mortgage free, and holding market investments improved as markets improved, while those with mortgages and those renting saw little change.
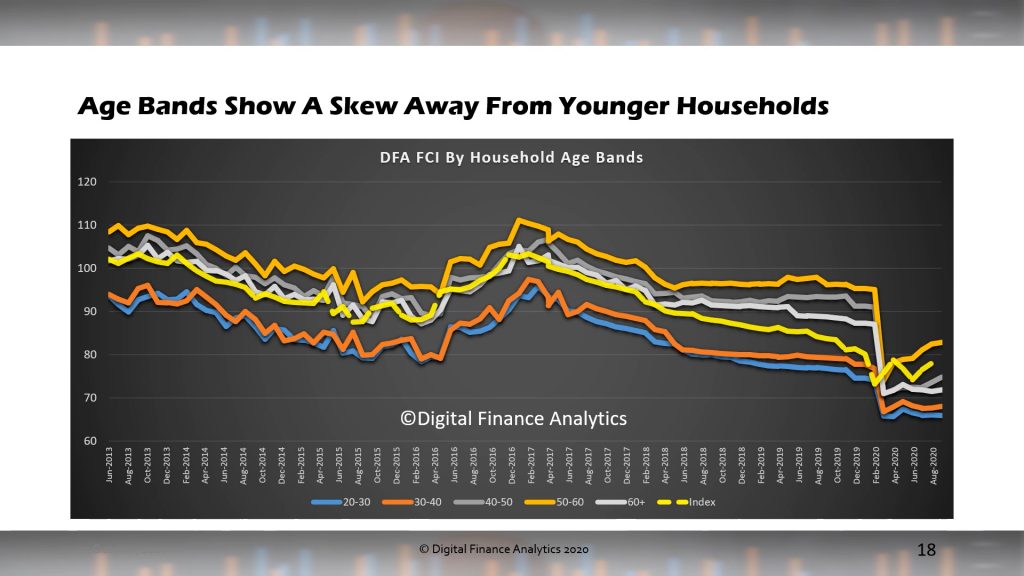
Across the age groups, younger households were least confident, reflecting fragmented jobs and incomes, and high leverage. Older households, especially those mortgage free were more positive, but older groups, reliant on bank savings also remain in gloom territory.
Across the states, Victoria showed a further slide (this may change if the lock-down is relaxed as anticipated), whereas WA continues to move higher, as the local economy recovers.
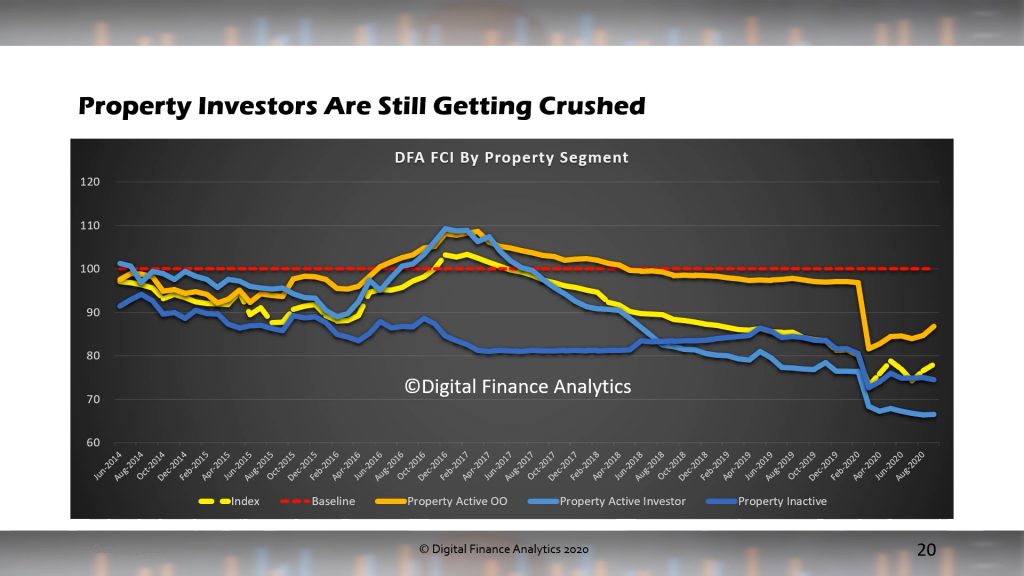
Across the property segments, property investors continue to languish, thanks to lower rental returns, higher vacancy rates and limited capital growth. Owner occupied households benefited from lower rates, and refinance, while those renting benefited from higher availability and lower rents (though some are confronting risks of being forced to leave due to investors wanting to sell, or to give notice).
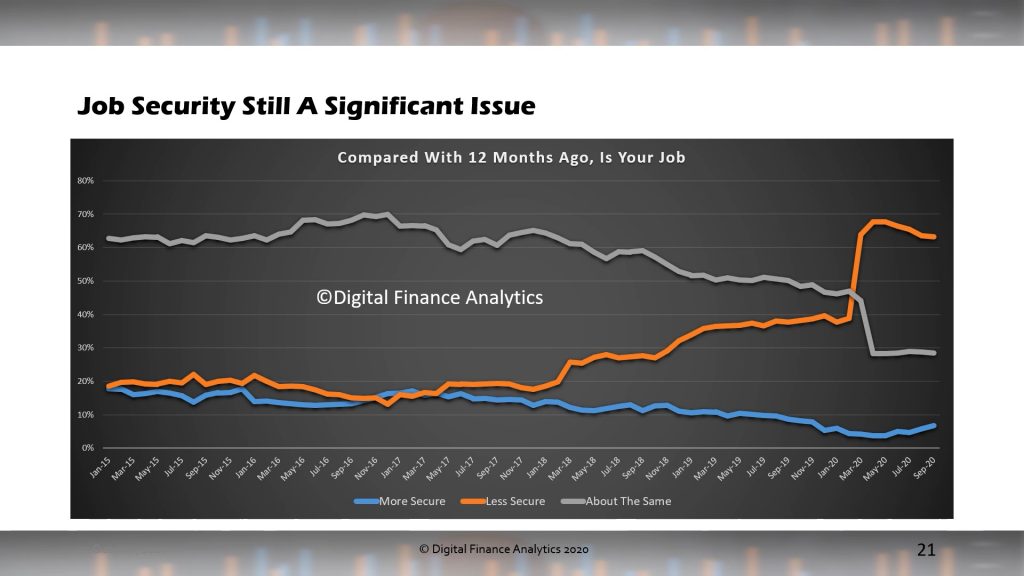
Across the components of the index, job security remains a significant issue with more than 60% of households less secure than a year ago. Many are working less hours, while structural unemployment continues to rise. Many SMEs are also cutting.
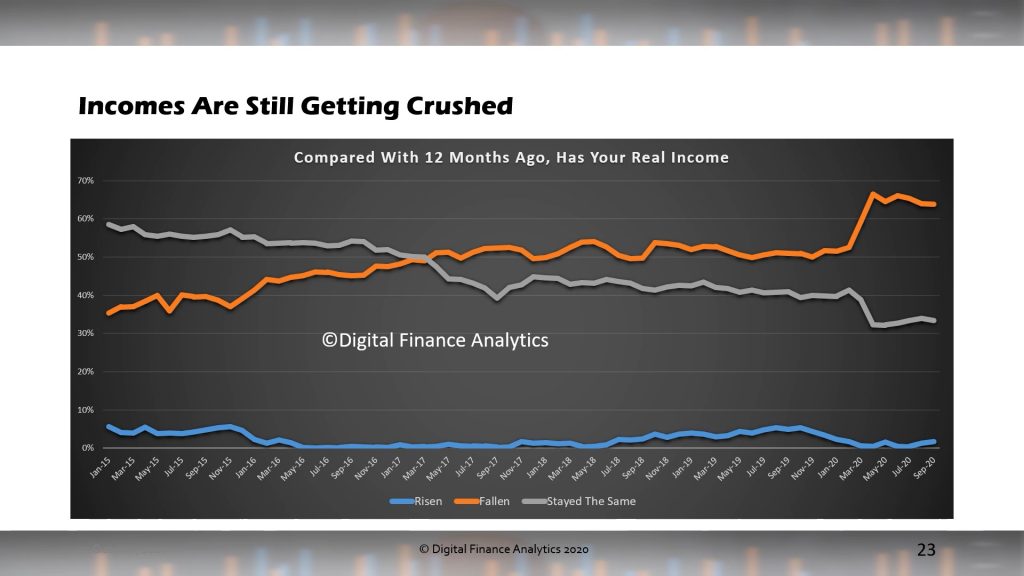
Incomes remain under pressure, thanks to less hours worked, and lower pay rates. Reductions to JobKeeper and JobSeeker are also hitting some now.
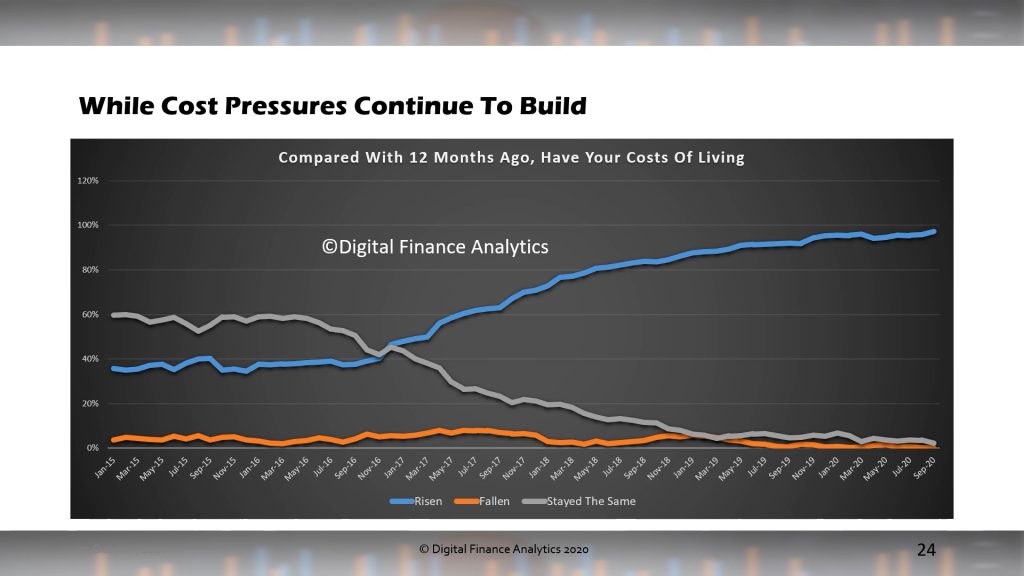
Costs pressures are still clearly in play, with most households seeing costs across multiple categories continuing to rise. Everyday costs at the supermarket appear to be rising faster than the official cpi.
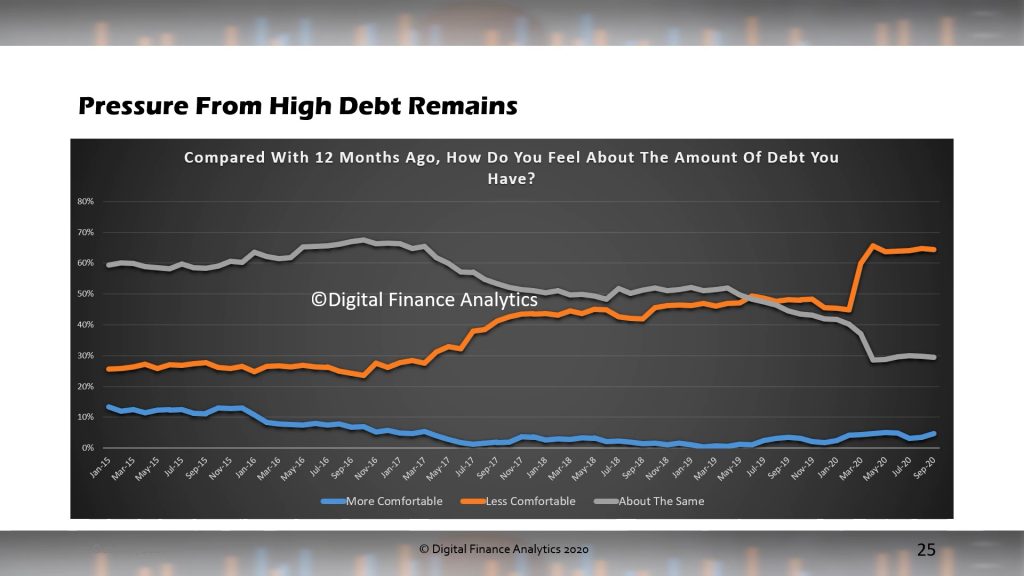
Those households with debt (not all are borrowing) are more concerned, especially those who were on principal and interest repayment holidays which are now ending. We continue to see expansion of credit (and Buy-Now-Pay-Later facilities) to those already in significant debt.
Savings are under pressure, especially with the continued crushing of deposit rates (thanks RBA…!). Those with savings in the banks have see rates drive towards zero in recent times. As a result more households are having to dip into capital, or moving to higher-risk investments. This largely silent group is drowned out by the clamour from the mortgaged sector and property bulls.
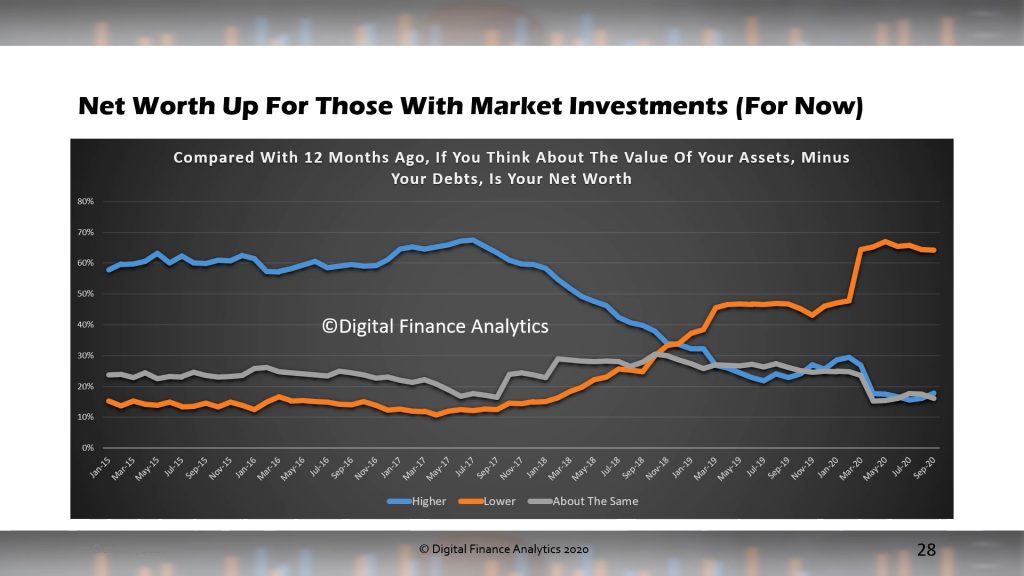
Finally, net worth has improved for those with market investments, for now, though 65% of households are still sitting on lower net worth than a year ago.
Given the current and expected monetary policy settings, we expect to see continued weakness in the index, until such time as employment and income growth accelerates. This is some way away yet.
Join us tonight for our live stream event, where we will be examining the latest results from our surveys, and discussing the broader economic backcloth to today’s RBA minutes. You can ask a question live via the YouTube chat, and we will also have our post data on line.
We have updated our Core Market Models and scenarios with the latest household financial stress data to the end of September 2020.
We discussed this in our live show last night:
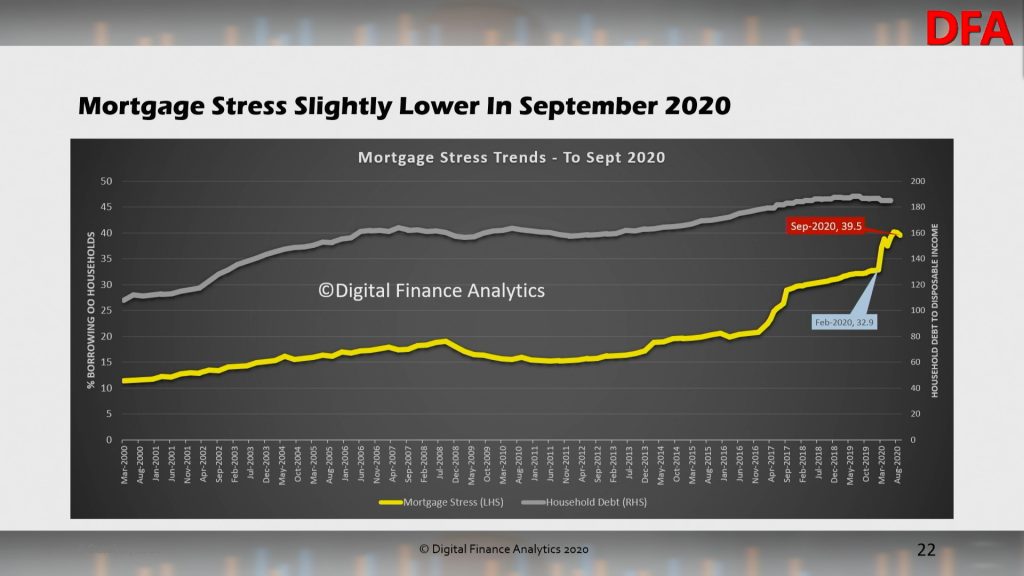
Overall mortgage stress eased back to below 40% of borrowing households at 39.5%. But it remains very high. This is measured in net cashflow terms.
The RBA household debt to income ratio eased back as loans are paid down.
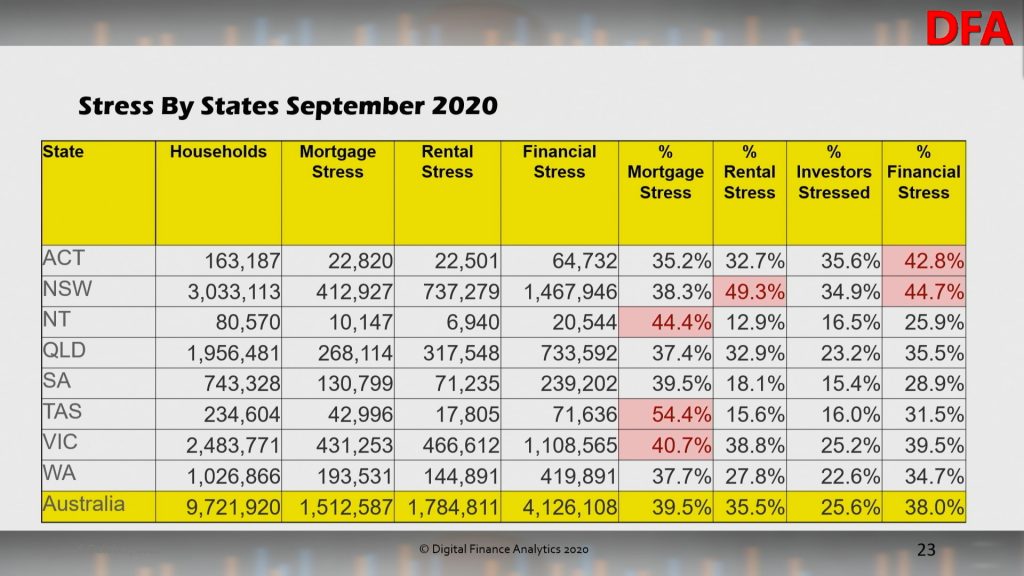
Across the states, mortgage stress is highest (in percentage terms) in Tasmania, NT and Victoria. Rental stress is highest in New South Wales. Overall financial stress (including mortgage, rental and investor stress) is highest in ACT and NSW.
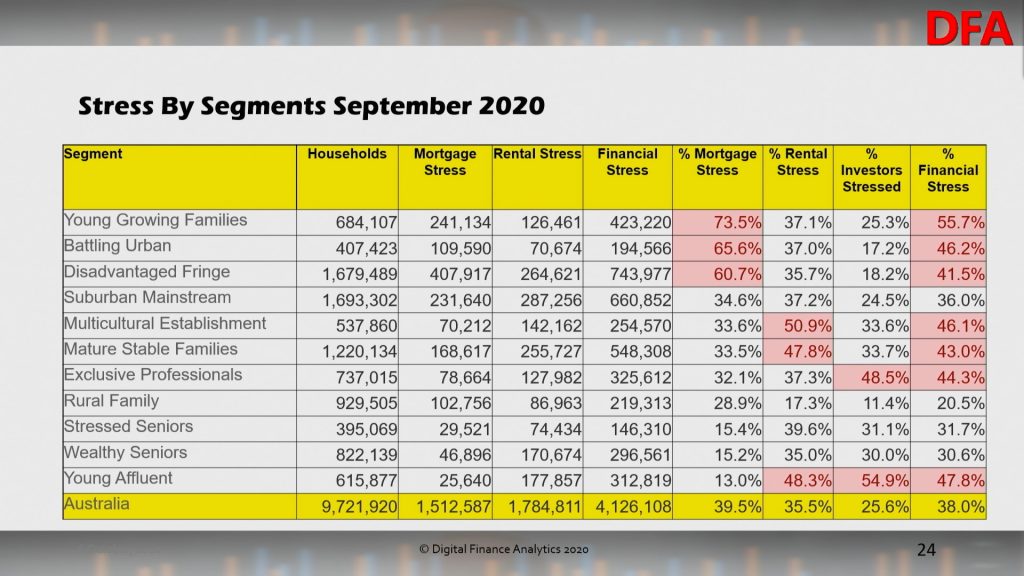
Across our household segments, young growing families (which include first time buyers) are most exposed, together with households on new estates on the edges of our towns and cities. Rental stress is highest among first generation migrants, while investor stress is highest among most affluent households who are highly leveraged into investment property.
As a result aggregate financial stress is dispersed across many of our segments, indicating this is a real structural problem.
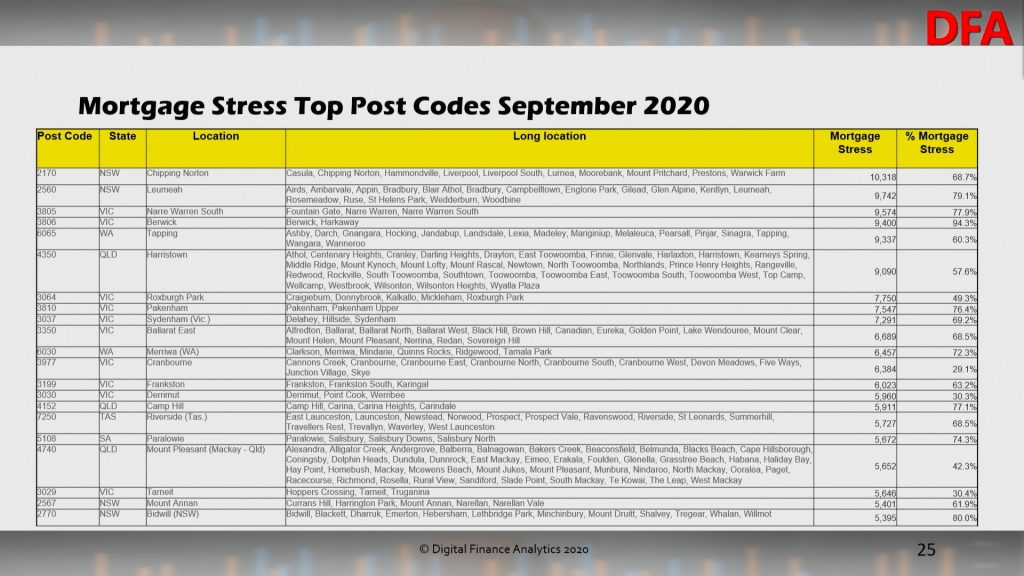
Top post codes by mortgage stress:
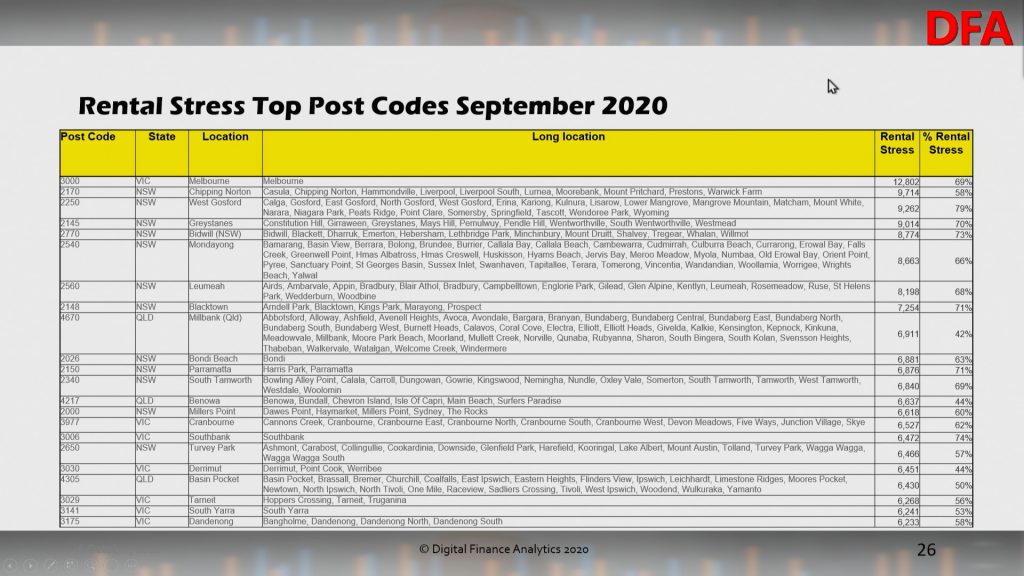
Top post codes by rental stress:
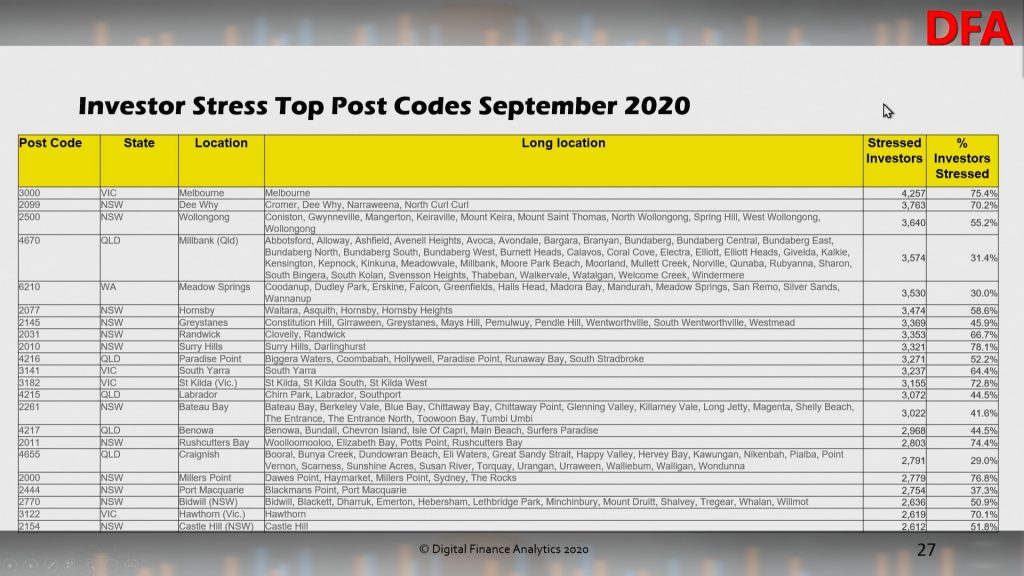
Top post codes by property investor stress:
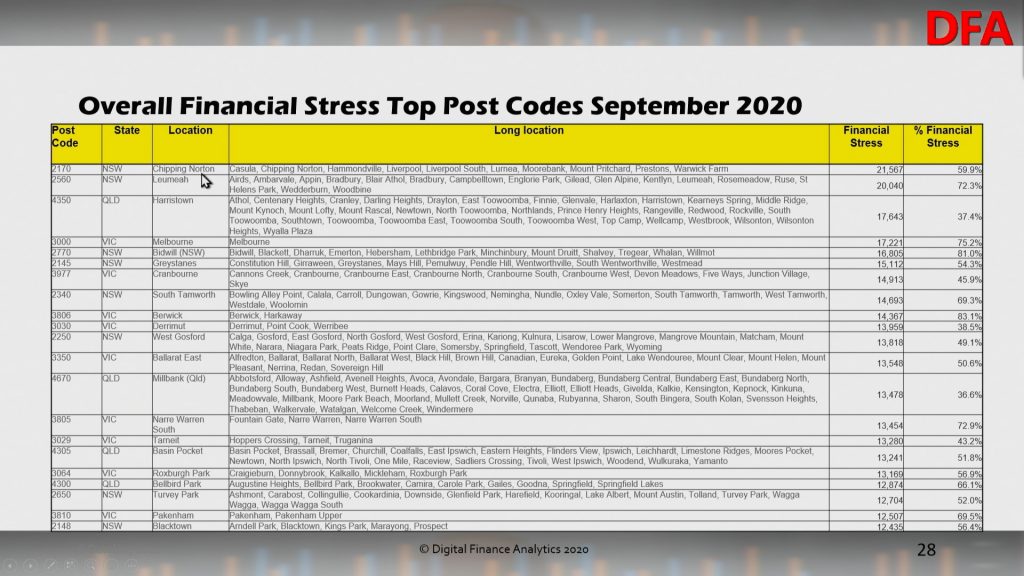
Top post codes by overall financial stress:
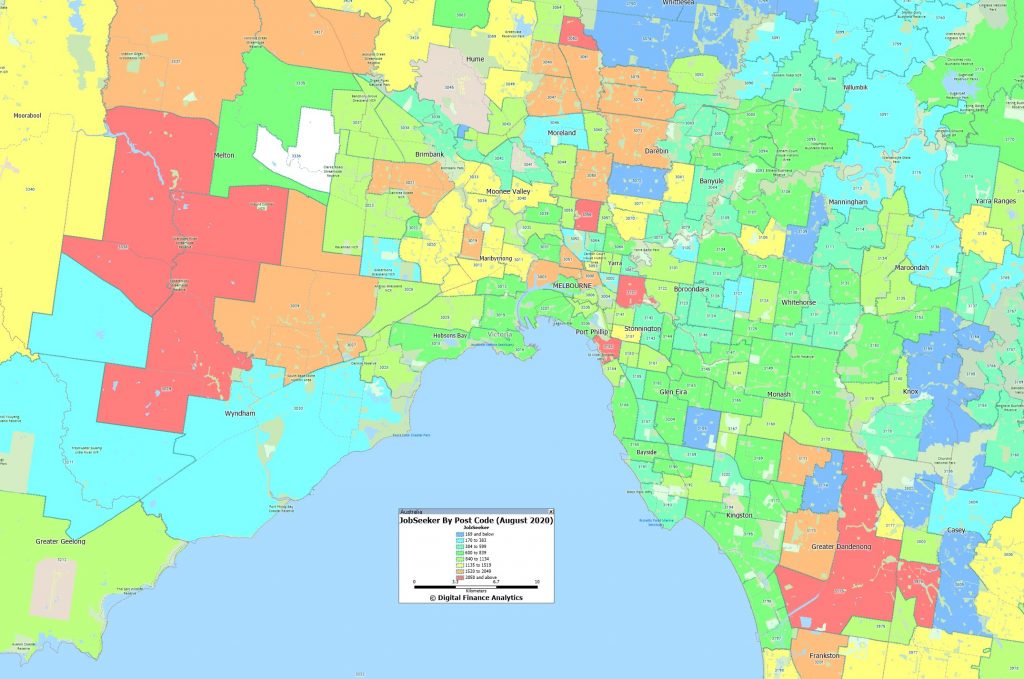
As we discussed in our post last night there is a strong correlation between mortgage stress and high counts of JobSeeker claims. Melbourne is an example:
As the mortgage repayment holidays dry up we expect stress to remain high even if job growth recovers. This is a structural issue which will not be solved with more generous lending standards. Only real income growth would assist, but this seems unlikely for some time to come.