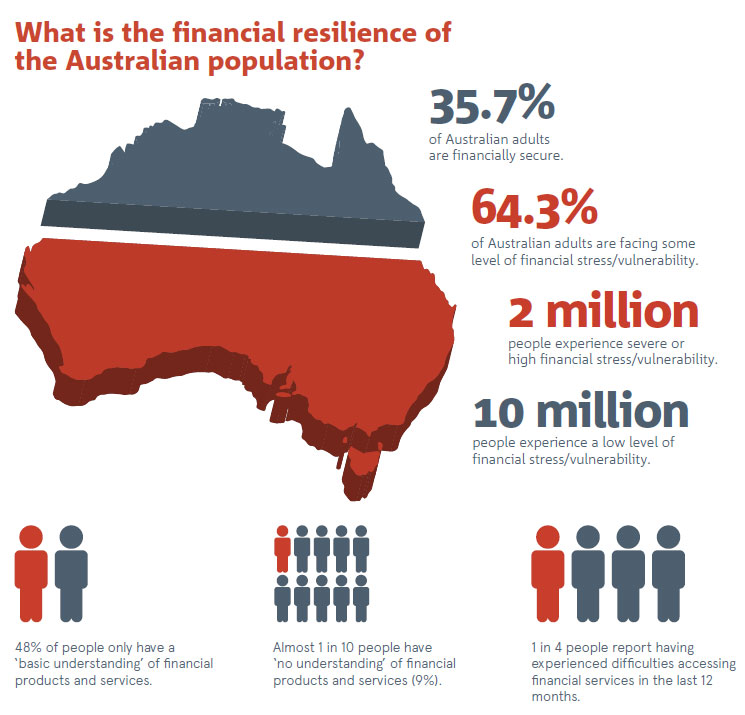
A new study shows two million Australians are experiencing high financial stress which prevents them from coping in difficult situations, for example, in paying unexpected expenses such as a big mobile phone bill or the fridge breaking down.
Adults face these sorts of scenarios frequently. When they arise, people usually turn to savings, a credit card, or a friend or family member to help out.
Our report, Financial Resilience in Australia, funded by the National Australia Bank, quantifies the amount of Australians: experiencing problems paying debts; meeting the costs of living; and accessing appropriate, affordable and acceptable financial products and services.
It also shows some Australians have trouble accessing social support in times of crisis and may have low levels of financial knowledge.
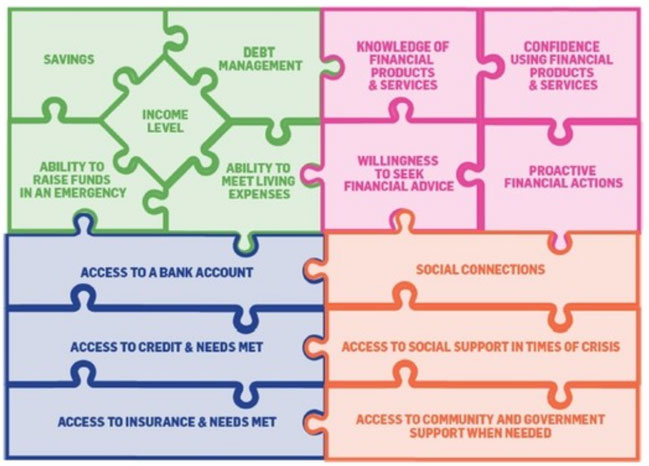
Our research measured financial resilience by the four key resources that support it: personal economic resources (such as savings), financial products and services (such as insurance), financial knowledge and behaviour (including financial literacy), and social capital (having social support in times of crisis, including friends and families).
Many Australians simply don’t have the resources to bounce back. For example, around:
- One in two adults have limited to no savings
- One in two only have a “basic understanding” of financial products and services
- One in ten have unmet need for credit and/or insurance
- One in five have limited or no social connections
- One in 30 stated they needed but did not have access to any form of government or community support.
This has implications for the short and long-term impact on individuals and their families.
Who is most at risk?
Our research found secure housing, steady income, education, being employed and good mental health are strongly associated with financial resilience.
On average, financial resilience is significantly lower among people who are homeless, living in social housing, are short-term renters or live in student accommodation.
Financial resilience increases with the level of education and, unsurprisingly, people with very low personal incomes fare poorly.
Employment status is a key marker. People who are unemployed, underemployed, not in the labour force and those who only work odd jobs are more likely than their full-time employed counterparts to have lower levels of financial resilience.
People with a serious mental illness are significantly more likely to be in severe or high financial stress, are less likely to be financially secure and fare worse on each of the individual resource groups than people without mental illness.
The gender split in financial resilience is fairly even overall. However, the four components of financial resilience are influenced by gender. Women have lower general levels of economic resources than men, but men have lower levels of social capital than women.
People who were born overseas in a non-English speaking country have lower levels of resilience than those who were born in Australia. Finally, the influence of age on financial resilience varies and is often affected by other factors.
One in four study participants reported difficulties accessing financial services. The barriers are varied, but include cost, trust, poor and inadequate services, and (for a few) language, disability and discrimination.
This underscores the importance of making financial information, products and services more user-friendly and accessible. This will ensure these resources are available and accessible to everyone who needs and wants them in society.
The factors influencing financial security are not surprising. People who own their own homes, have a university-level education and have a personal yearly income of more than A$100,000, for example, have higher levels of financial resilience. However, only 35.7% of Australians are financially secure.
The prevailing attitude around financial problems is that individuals are solely responsible for their situation. Our research challenges this ideas as it shows multiple aspects to financial resilience, some out of the individual’s control.
The below shows how interlocked the different components of financial resilience are and when pieces of the puzzle are removed, the most vulnerable people are at risk.
 At the moment social sector leaders are lobbying the government to scrap proposed budget cuts that will reduce the amount of certain welfare payments. Our research shows these same people have the least resilience to bounce back if they were to lose some financial support.
This is an example of how the government needs to play a more active role in understanding financial resilience and where support is needed. By understanding the often interrelated elements of financial resilience, tipping points and who is most at risk, prevention and intervention can be better tailored.
Authors: Rebecca Reeve, Senior Research Fellow, Centre for Social Impact, UNSW Australia; Kristy Muir, Professor of Social Policy / Research Director, Centre for Social Impact, UNSW Australia

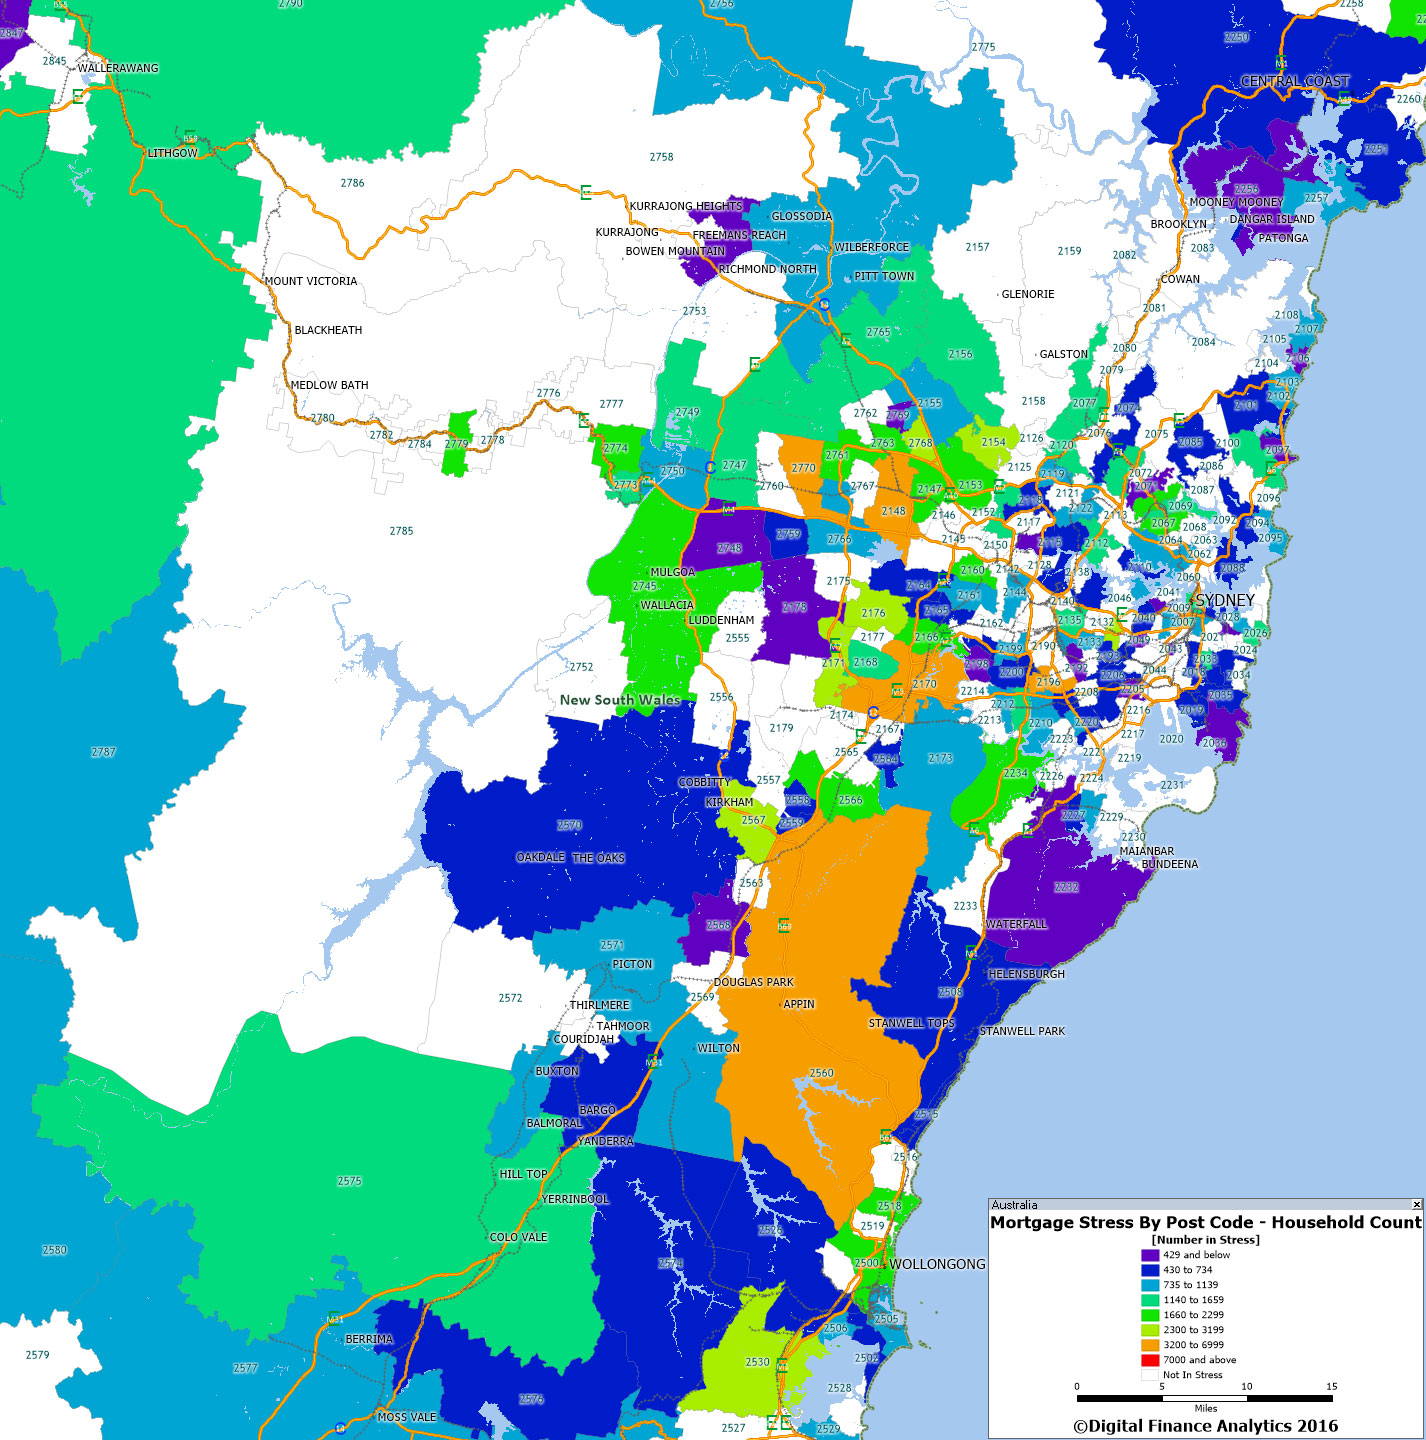
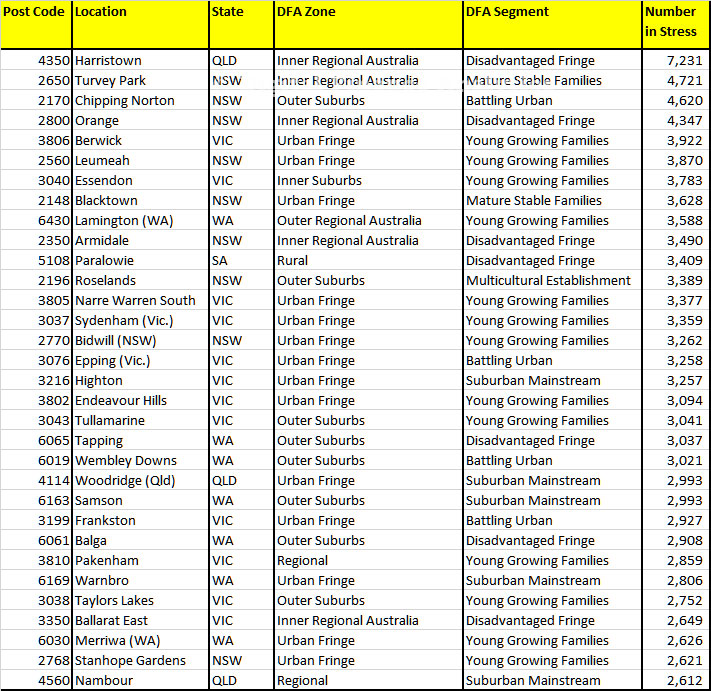
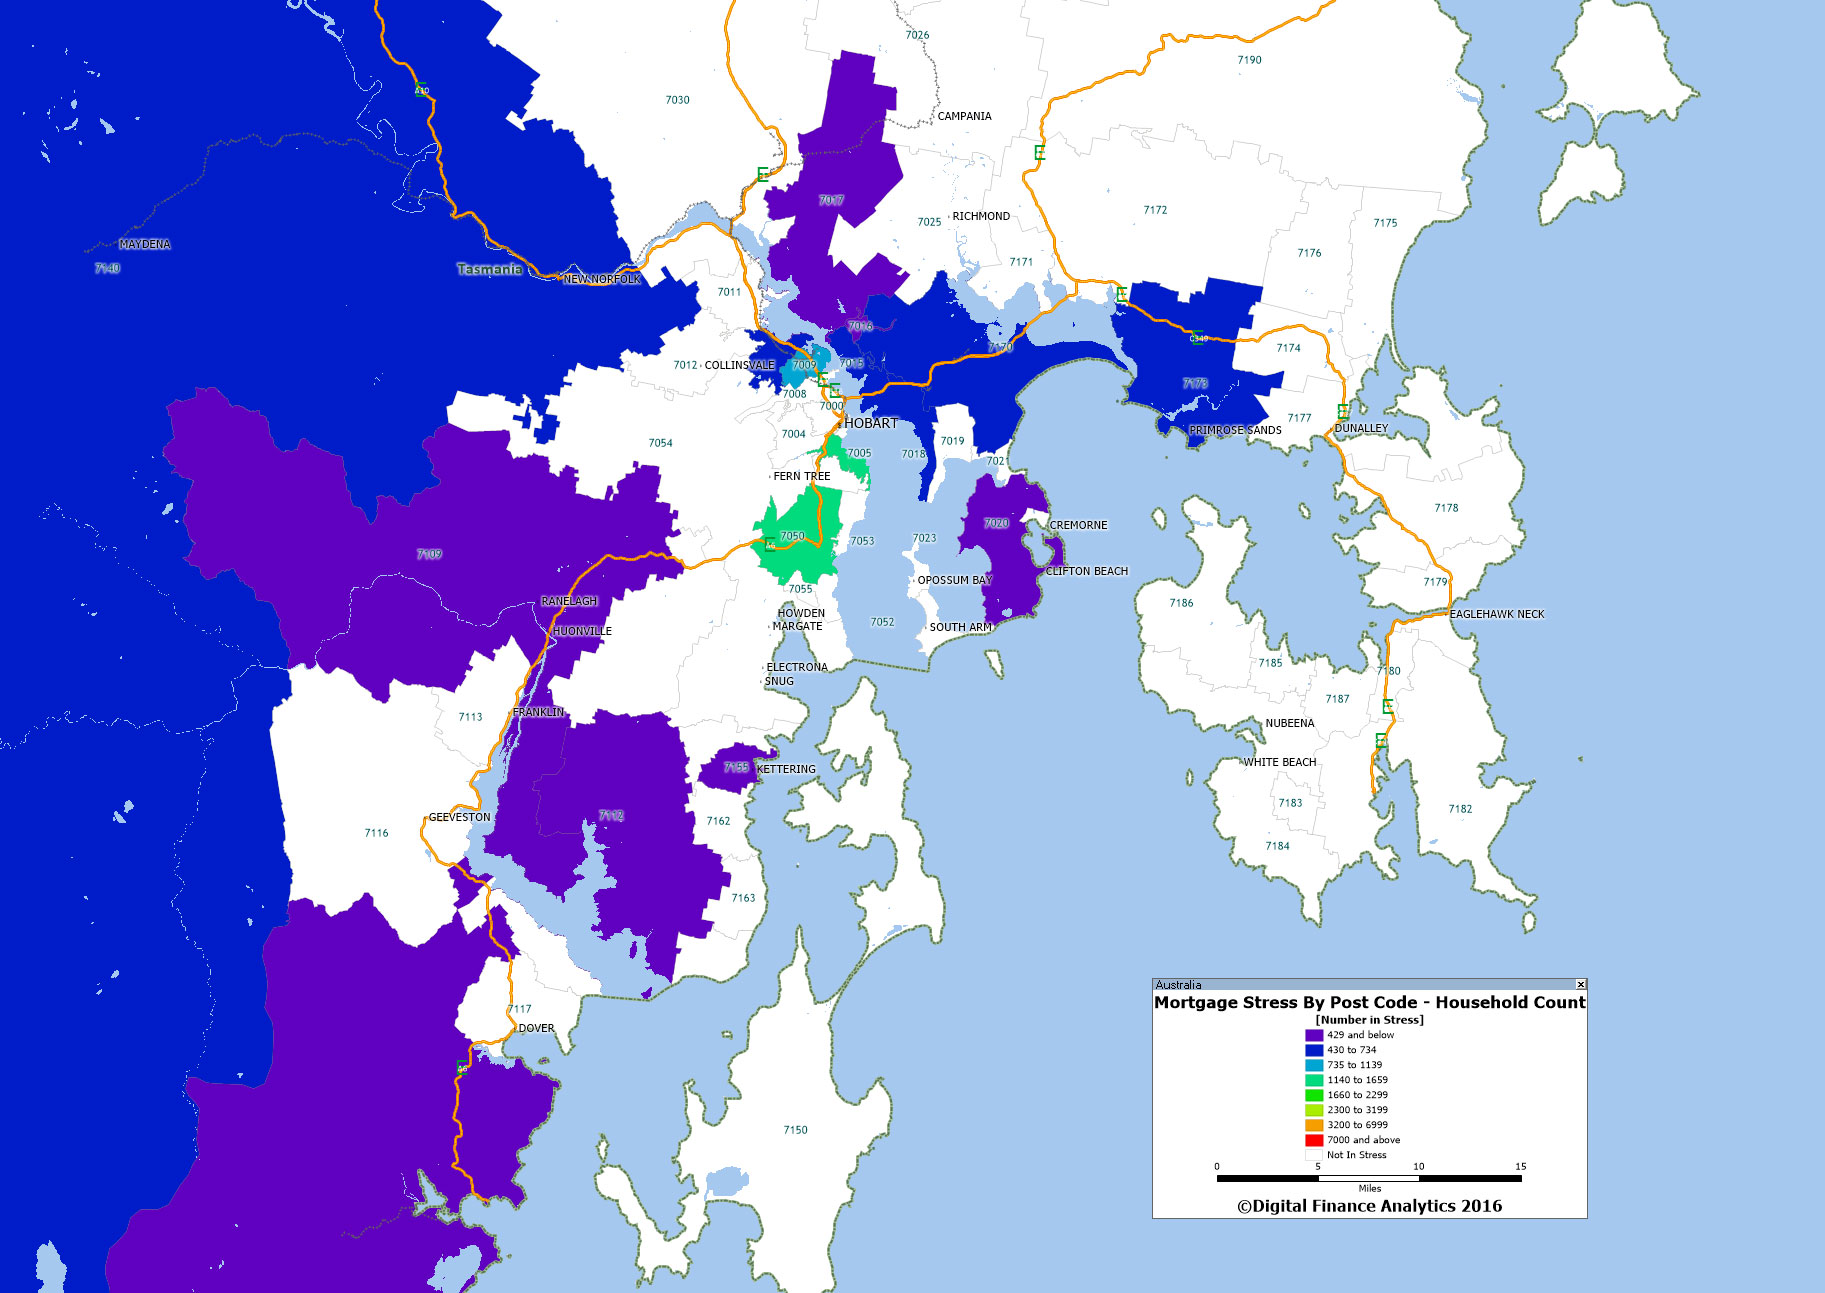 Looking at the top 10 in TAS, Riverside 7250 contains the largest number in stress.
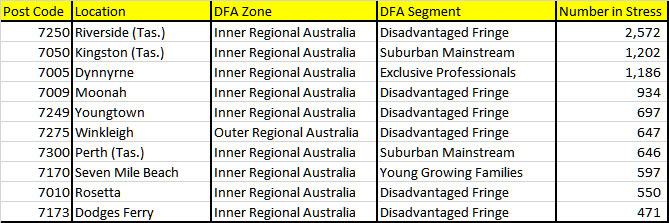 Riverside is a suburb of Tasmania, about 164 kms from Hobart to the north west. The average age of the people in Riverside is 40 years of age and the average income $1,110. The average mortgage is below $100,000.