Brokers key to success for new market in 2016

From Australian Broker.

Mortgage refinancing will drive the market in 2016, according to a new report, and brokers are in the prime position to capitalise.

According to the J.P. Morgan Australian Mortgage Industry Report (Vol 22), produced in collaboration with Digital Finance Analytics, there has been a noticeable change in who has been transacting, with a clear switch from investors to refinancers.

Investor demand has been reducing driven by lower expectations of house price appreciation and a tougher regulatory outlook. Investors have seen the sharpest reduction in intention to transact, reducing from around 50% to 40% for solo investors and around 75% to 60% for portfolio investors in 2015.

However, with interest rates still at record lows, the number of borrowers intending to refinance has been continuously increasing. Those looking to refinance has risen from 10% in early 2015 to 35%, according to the report, as they look to establish better terms on their mortgage or release equity for other investments as house prices have risen.

J.P. Morgan banking analyst Scott Manning says brokers will be key to success in capturing the surge of refinancing activity this year, with around 75% of refinancers expecting to use brokers versus other channels.

According to Manning, we are already starting to see the major banks adapt. For example, ANZ has been increasing its broker usage while simultaneously decreasing its branch footprint – a trend which he says will continue across the banking landscape over the next five years.

“Certainly brokers are not only a high proportion of flow but they are a significantly higher proportion of that of new bank business. They are very important for banks to try and grow their book basically. So I think [brokers] are here to stay and I think that proportion will continue to improve over time,” Manning told Australian Broker at the release of the report.

“If you look at what the banks of doing, they are reducing the size of the footprint in terms of square metres by moving banks. They are using smart ATMs where you can bank cash and bank deposits without going into a branch. They have kiosks with after-hours access where you can get coin change for SMEs.

“They are migrating their footprint off branches already. I think ANZ has just been a bit more aggressive on that path… We can see that in Westpac as well. Their branches were down last year in particular and they have renegotiated the new deal with Australia Post to do more of the day-to-day banking in remote areas through the post office.”

Joint DFA and JP Morgan Mortgage Industry Report 22 Released Mar 2016

The March 2016 edition of our joint mortgage industry report used data from the Digital Finance Analytics household surveys to discuss the  evolution of the home loan market.

jpm-mar-2016Specifically, volume 22 focuses on three important issues

  1. Building A Picture Of Credit Demand – We consider the changing inputs into housing credit growth over time, initially through a model of household gearing tolerance, and more recently through the transition from heightened investor activity towards increased owner occupied re-financing.
  2. Taking A Closer Look At Investors – Given that the investor market (largely centered around Sydney and Melbourne) has been a key area of focus of banks, regulators and politicians, we assess four areas of potential risk in greater detail.
  3. Implications For Australian Banks – It is clear that Australian banks will need to target re-financers going forward as a key area of focus – not only to maintain market share, but also to offset the ongoing amortisation headwind from lower rates. Accordingly, target market identification and distribution strategies will hold even greater importance.

Note that due to regulatory compliance, the full report is only available from JP Morgan. However, the underlying survey data and analysis is available on request from DFA via the Property Imperative. This publication contains considerably more detailed information than was used in the final joint report.

Property Investors Are Still In The Game

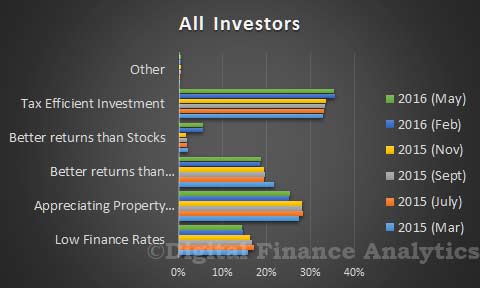
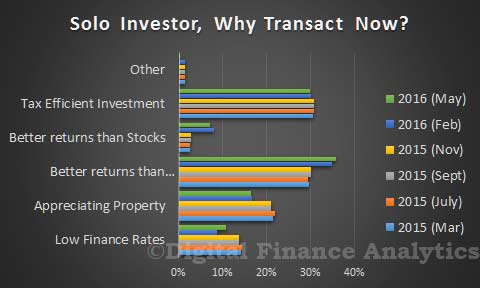
Today we continue to feature research published in the latest edition of The Property Imperative, The full report is available on request.  We look across the property investment sector, which remains strong despite lower growth in investment lending. We continue to see that tax benefits and the prospects of better gains than deposit accounts or shares drives the market. This despite the fact that some investors have a negative net yield, thanks to low rental growth.

Solo Investors.

About 992,000 households only hold investment property, 2.5% of which are held within superannuation. Households in this segment will often own one or two properties, but do not consider they are building an investment portfolio.

Solo-Feb-2016Around 68% of households expect prices to rise in the next 12 months, 38% of households expect to transact within the next year, 53% will need to borrow more, and 37% will consider the use of a mortgage broker.

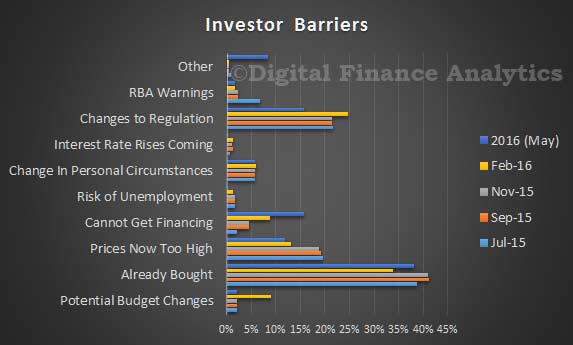
Investor-Barriers-Feb-2016There are a number of barriers to investment, which our surveys identified. Many investors had already bought, so were not in the market (34%). More than 26% of potential investors were concerned by possibly adverse change to regulation – negative gearing or capital gains and 9% specifically referred to risks in the May budget. Some (12%) said they felt property prices were now too high.

Portfolio Investors

Households who are portfolio investors maintain a basket of investment properties. There are 191,000 households in this group. The median number of properties held by these households is eight. Most households expect that house prices will rise in the next 12 months (70%), and 64% said they will transact in the next 12 months. Many will borrow more to facilitate the transaction (90%), and 52% will use a mortgage broker. Significantly we now see about 23% of portfolio investors looking to their property investments as the main source of income, it has in effect become their full time job. A significant characteristic is the cross leverage from one property to the next.

AllInvestors-Feb-2016

Super Investment Property

Throughout the survey we noted an interest in investing in residential property via a self-managed superannuation funds (SMSFs). It is feasible to invest if the property meets certain specific criteria.

Overall our survey showed that around 3.75% of households were holding residential property in SMSF, and a further 3.5% were actively considering it.

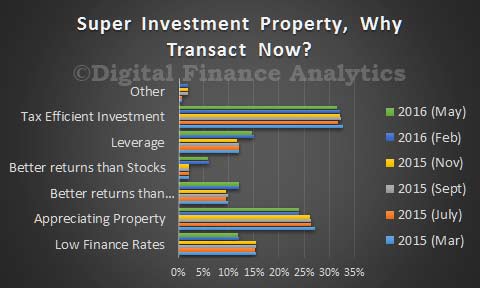
SuperTransact-Feb-2016Of these, 33% were motivated by the tax efficient nature of the investment, others were attracted by the prospect of appreciating prices (24%), the attractive finance offers available (12%), the potential for leverage (15%) and the prospect of better returns than from bank deposits (12%).

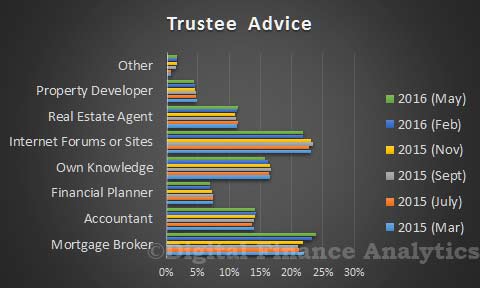
We explored where SMSF Trustees sourced advice to invest in property, 23% used a mortgage broker, 22% online information, 11% a Real Estate Agent, 14% Accountant, and 7% a Financial Planner. Financial Planners are significantly out of favour in the light of recent bank disclosures publicity on poor advice.

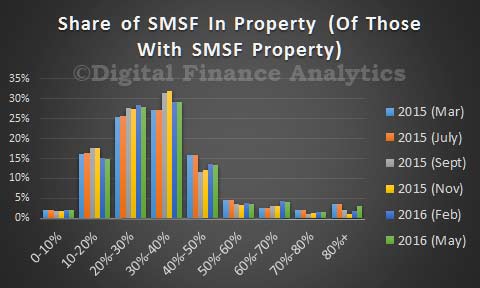
TrusteeAdvice-Feb-2016The proportion of SMSF in property was on average 34%.

SMSFSharePty-Feb-2016According to the fund level performance from APRA to December 2015, and DFA’s own research, Superannuation has become big business, with total assets now worth over $2 trillion (compare this with the $5.5 trillion in residential property in Australia), an increase of 6.1 % from last year.

APRA reports that Self-Managed Superannuation funds held assets were $594.6 billion at December 2015, a rise from $578.9 billion in Sept 2015.

Refinance, The Way to Go

We just released the latest edition of “The Property Imperative”, which is available free on request. This provides access to our latest household survey results. One key segment is the refinance sector and we feature our survey analysis on this segment today.  This segment has become the new battleground for mortgage sector growth. Indeed there are deals below 4% currently to be had, including for 3 years or more fixed. Remarkably low rates.

There are around 695,000 households considering a refinance of an existing loan of which 78% relate to an owner occupied property, and 22% to an investment property. To assist in the refinance, 76% of households will consider using a mortgage broker.

Refinance-Feb-2016Households are looking to refinance for a number of reasons, including reducing monthly repayment (39%), to lock in a fixed rate (15%), because of a loan rollover (13%), in reaction to poor lender service (10%), for a better rate (10%) or to facilitate a capital withdrawal (11%). In the next 12 months, 34% of these households are likely to transact (a rise from 29% last time), whilst 47% expect house prices to rise in the next 12 months.

Refinance-Loan-Size-Feb-2016   The growth in refinancing can be expected to continue as the focus turns from investment lending to owner occupied new and refinance loans. There are a number of discounted offers for refinancing currently available. We note that a higher proportion are refinancing to a fixed rate.

Refinance-Drivers-Feb-2016The most likely loan size to refinance is $250-500k. The refinance drivers vary across the loan size bands. The largest loans are more associated with releasing cash, whereas smaller loans are more associated with reducing monthly payments, or resetting an existing term loan. We also note brokers are more associated with the refinance of larger loans.

Refinance-Type-Feb-2016The larger the loan, the more likely it is that the refinance will be to a fixed rate loan and to an interest only loan.

New Edition of “The Property Imperative” Just Released

The updated edition of “The Property Imperative”, our flagship report on the residential housing sector, which includes survey data to March 2016 is now available free on request.

From the introduction:

The Property Imperative is published twice each year, drawing data from our ongoing consumer surveys, research and blog. This edition dates from March 2016 and offers our latest perspectives on the ever-changing residential property sector.

As usual, we begin by describing the current state of the market by looking at the activities of different household groups using our recent primary research and other available data.

In this edition, we also look at rental yields, household interest rate sensitivity and the role of mortgage brokers, plus data on negative gearing.

Residential property remains in the cross-hairs of many players who wish to influence the economic, fiscal and social outcomes of Australia. In policy terms, debates around negative gearing and capital gains tax breaks for investment properties have hotted up.

By way of context, the Australian residential property market of 9.53 million dwellings is currently valued at over $5.86 trillion and includes houses, semi-detached dwellings, townhouses, terrace houses, flats, units and apartments. In the past 10 years the total value has more than doubled. It is one of the most significant elements driving the economy, and as a result it is influenced by state and federal policy makers, the Reserve Bank (RBA), banking competition and regulation and other factors. Indeed, the RBA is “banking” on property as a critical element in the current economic transition.

According to the RBA, as at January 2016, total housing loans were a record $1.53 trillion. There are more than 5.4 million housing loans outstanding with an average balance of about $249,000. Approximately 64% of total loan stock is for owner occupied housing, while 36% is for investment purposes. In recent months there has been a restatement of the mix between owner occupied and investment loans, and as a result the true blend is hard to decipher.

The RBA continues to highlight their concerns about potential excesses in the housing market. In addition, Australian Prudential Regulation Authority (APRA) has been tightening regulation of the banks, in terms of supervision of lending standards, the imposition of speed limits on investment lending and has raised capital requirements for some bank. The latest RBA minutes indicates their view is these regulatory changes are slowing investment lending somewhat, though we observe that demand remains, and in absolute terms, borrowing interest rates are low.

As a result, momentum in the market has changed, with growth in investment lending relatively static, but counterpointed by a massive focus on owner occupied refinancing and the rise of differential pricing. In addition, 37% of new loans issued were interest-only loans, a drop from 46% last year as the regulators have been bearing down on the banks’ lending standards.

The story of residential property is far from over!

Request a copy of the report here. Please note this is an archived edition now, so if you are after this version – volume 6 please specify so in the comment section of the request form. Otherwise you will receive the latest edition.


Latest Survey Shows First Time Buyer Aspirations Remain High

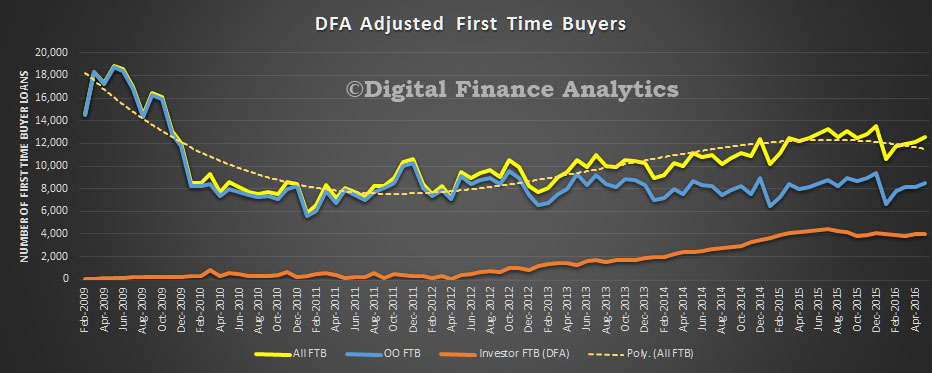
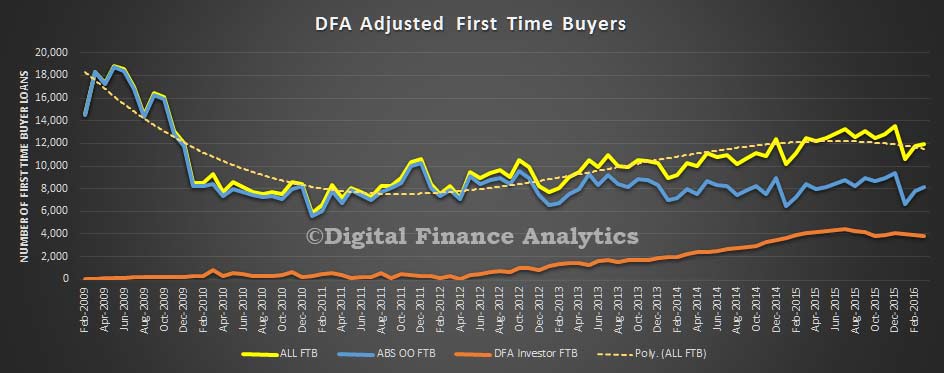
Continuing our series on the results from our latest household surveys, today we look at first time buyers.  Data from our surveys, combined with recently released ABS data, highlights that first time buyers are more active now compared with last year. Whilst many first time buyers are seeking to buy a place to call home, an increasing number are looking to go direct to the investment sector to buy a cheaper place as a means of getting on the property ladder, assisted by tax breaks and negative gearing. This trend continues to build.

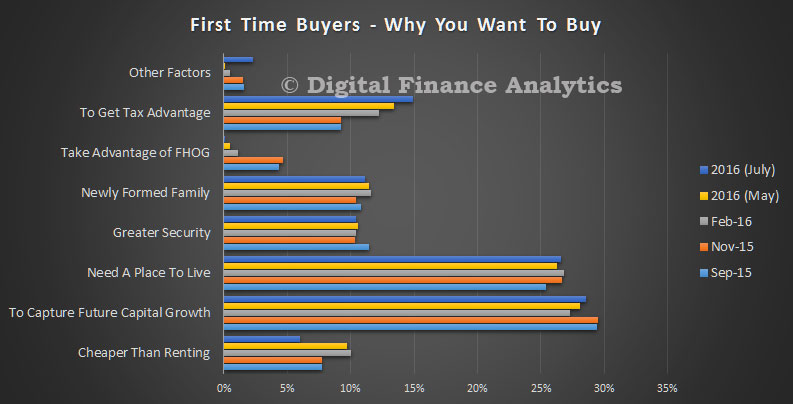
FTB-All-Dec-2015So, looking at first time buyer motivations, we find that prospective capital growth is the strongest driver (27%), compared with needing a place to live (26%). Significantly, tax advantage figures as a decision driver (12%), up from 9% last year. This is worth noting in the context of the current quasi-discussion about negative gearing! The fact that buying is cheaper than renting (10%), up from 8% last year influences the decision, as does forming a family (12%). The potential to access first home owner grants (FHOG) has reduced in importance as their availability has diminished (and that is a good think, because FHOG’s simply are another market distortion).

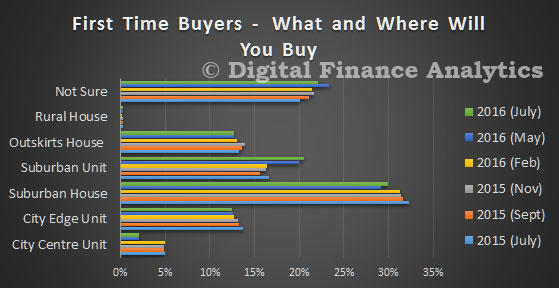
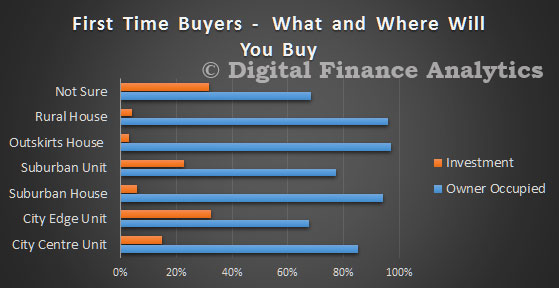
FTB-Drivers-Feb-2016Many first time buyers are not all that sure where to buy, with a high 21% saying there is no simple choice. A significant proportion (33%) will look for a unit whilst nearly 60% still want to buy a house.

FTB-Where-Feb-2016Most prospective first time buyers going direct to the investment sector are seeking to buy a unit, as the purchase price will be significantly lower. Purchasing preference is spread from CBD (12%), city fringe (35%) and suburban outskirts/regional centres  (23%). Underlying this is a strong motivation to get onto the housing escalator anyway they can. We also noted that around 35% of prospective first time buyers were expecting to get help from the wider family to assist in the purchase, so the “bank of mum and dad” remains an important factor in the first time buyer equation. Yesterday we highlighted that more than half of prospective first time buyers believe house prices will continue to rise – so they wish to transact to avoid seeing prices move further against them and to enjoy capital appreciation at a time when interest rates are really low. Property purchase is hard wired into the Australian psyche.

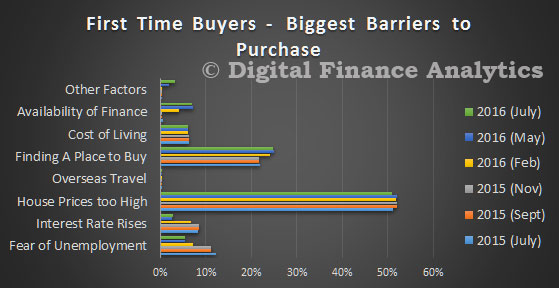
FTB-What-Feb-2016Finally, there are a number of barriers first time buyers are encountering. More than half think property prices are too high (this has been pretty constant in recent surveys), 22% said they were having difficulty finding a place to buy (lack of supply, and competition with investors – both local and overseas) and around 5% said that they are finding it difficult to get finance. This reflects tightening lending criteria and flat incomes in real terms and is a marked change from last year. More than 60% of first time buyers will be consulting a mortgage broker to assist with finding a loan.

FTB-Barriers-Feb-2016 Next time we will do a deep dive on the refinancing sector.

Our Latest Survey Shows Property Siren Still Sounding Loud

The latest results from the Digital Finance Analytic Household Surveys are in, and demand has recovered somewhat after the wobble late last year. Worth also remembering that Sirens were dangerous yet beautiful creatures, who lured nearby sailors with their enchanting music and voices to shipwreck on the rocky coast of their island! Over the next few days we will present the summary results, using our household segmentation, and examine why property remains so alluring despite being in bubble territory.

By way of background, we are using data from our rolling 26,000 household data set, the most recent data is up to 20th February 2016, so this captures the state of play after the recent stock market and resource sector ructions. Today we will overview some of the main cross-segment data, and in later posts dive into more detailed analysis of specific segment behaviour. These results will then flow into the next edition of the Property Imperative – the last edition is still available from September 2015, and the new edition will be out in March.

We start with transaction intentions. The most significant move is the rise in those expecting to refinance their existing mortgage, from 29% last time to 34% now. This despite record refinance volumes which have already been written. We found that many households were reacting to the strong discounts available for existing borrowers, especially with loan-to-value ratios below 80%. Three quarters of these households will use a broker, so no surprise we see brokers volumes on the rise. First time buyers are still in the market, from 8.2% to 8.9% this time. Property investors, whether holding a portfolio of properties, or just one, are still in the market, despite the rise in interest rates for investment loans, and tighter lending criteria. Portfolio investors moved form 63% to 64% this time, whilst solo investors moved from 37% to 38%. Up traders and down traders are a little less inclined to transact, whilst those wanting to buy, but who cannot, remain on the sidelines.

Transact-Feb-2016House price rise expectations are still quite strong, though lower than at their peak last year. More than half of property investors still think the market will go higher in the next 12 months. Down traders are the least optimistic with only 20% expecting further price hikes. First time buyers are still bullish, with 53% expecting a rise, though a fall from 67% last year.

Prices-Feb-2016Savings behaviour has not changed that much, with first time buyers still saving the hardest. Some of those wanting to buy are also saving, but it continues to sit at around 20%.

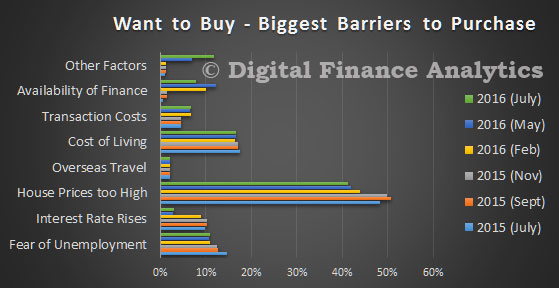
Saving-Feb-2016Of note is the significant rise in households who say that availability of finance is now a barrier to transacting, with nearly 10% saying finding a loan is now a problem compared with just 1.5% last year. Of course house prices remains high, so 43% say this is a barrier to transacting, down from 49% last year. On the other hand, unemployment fears are down compared with last year, down from 15% to 11%.

Barriers-Feb-2016Prospective purchasers are still looking for finance, with investors and first time buyers seeking to borrow more. Around 15% of those refinancing will look to increase the size of their loan, which explains some of the ongoing loan portfolio growth noted in recent statistics.

Borrow-Feb-2016Finally, in this over view, we note the importance of mortgage brokers as noted in the recent APRA data, with first time buyers and those seeking to refinance the most likely to consult a broker. Investors are also still broker aligned, especially portfolio investors.

Broker-Feb-2016So, the expectations are for ongoing demand for property still to be strong, and refinance volumes will remain elevated. Banks are competing hard to offer deep discounts for owner occupied loans. Next time we will look in more detail at first time buyers, and then those seeking to refinance.

Fact Check On Negative Gearing, Using DFA Data

Labor have announced proposals to change the negative gearing and capital gains tax rules relating to property investments. In an interview today on ABC Insiders, Chris Bowen, Shadow Treasurer said that negative gearing would potentially only be available on new property in 2017 , currently half of the benefit goes to top income earners, and proposes changes to CGT concessions, referring to the Murray FSI recommendations. 70% of benefit he says goes to top income earners. What “top” means was not defined.

Expect to see more tax reform shots exchanged as we progress through the year.

We decided to pull data from the DFA household surveys, to examine the distribution of negative gearing. Our segmented surveys, show some of the nuances in behaviour. We start with age distribution. We find that households of all ages may use negative gearing, but more than a quarter are aged 50-59.  We see the DFA household segmentation in evidence, with a number of young affluent households active aged 20-29, especially using an investment property as an alternative to buying their own place to live. We discussed this before. As we progress up the age bands, we see a strong representation by the more affluent segments, including mature stable families and exclusive professionals. In later life, wealth seniors are also active, especially in the 60-69 year bands. So negative gearing is being used by households across all age groups.

Age-GearingThen we looked at distribution, by segment, across the income bands. The horizontal scale shows the upper cut-off in each band, for example, the first is up to $24,000.  Wealth seniors, with lower incomes are well represented in the lower income bands, but as income rises, we see a mix of households using negative gearing. What is true, is that there is a greater proportion of households in the $100-$200k band. Above that, there is a fall in all households represented, but we see those with very large incomes still represented to some extent. Again we see our segments highlighting the strong presence of exclusive professionals and mature stable families.

Income-Dist-GearingIf we then look specifically at borrowing households using negative gearing, as compared to all households in the segments, the picture is quite striking. In our most affluent segment – exclusive professionals, nearly half are using negative gearing for property investment. Wealth seniors and mature steady state families are also well represented. But the most striking observation is that among young affluent households more than half are geared. Other segments are less represented.

Negative-GearingThe final picture is all household, compared with those negatively geared. We see a concentration in the more affluent segments, and other segments where negative gearing hardly exists.

All-Household-Negative-Gearing So, our survey suggests that negative gearing, whilst it is spread across the income bands, is indeed concentrated among more affluent households. Four segments, exclusive professionals, mature steady state, wealthy seniors and young affluent households contain the lions share of negative geared investment property. These segments are at different life stages, have different income profiles, and different strategies. For example the young affluent are often using investment property as a potential on-ramp to later owner occupied purchase, whereas wealthy seniors are all about income, and the others more wealth creation.

This analysis shows how complex the true situation is. Prospective changes are likely to impact different segments in diverse ways and there is plenty potential for spill-over impacts and unintended consequences. But the truth is, most negative gearing resides among more affluent households. The current settings are not correct.

In the RBA’s submission to the Inquiry on Home Ownership, they argue that negative gearing for investment property should be reviewed, because it has the potential to raise risks in the market, lift prices and distort the market.

The UK has just reduced the opportunity for negative gearing, there, and the Grattan Institute also makes a strong case for change.

DFA Analysis Of Highly Leveraged Households Featured In Nine News Segment

Nine News tonight, using data from the DFA household research programme, highlighted the highly leveraged status of many households who have bought into the property market in the past couple of years.

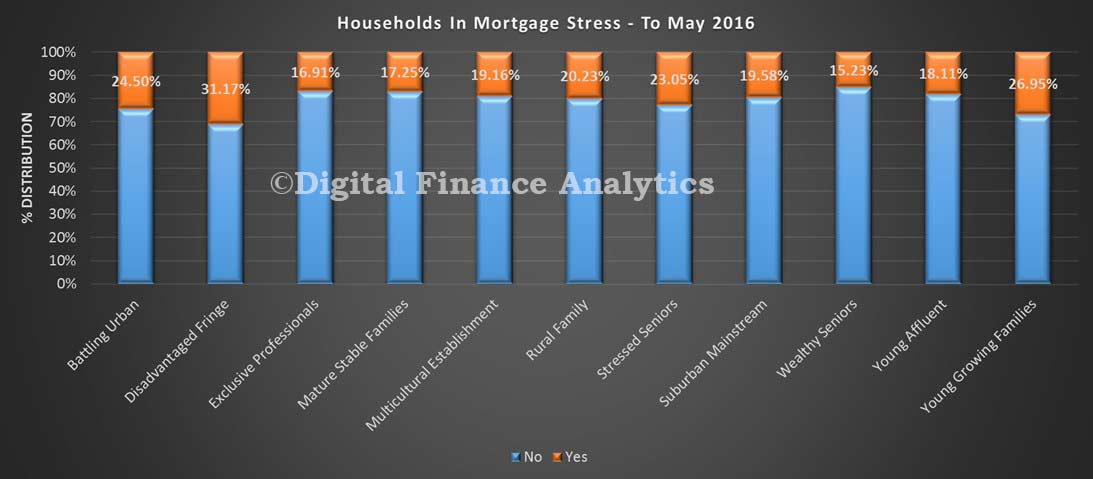
Our research has shown that in some eastern suburbs within the Sydney area for example, many households would find even a small rise in mortgage interest rates would create significant financial headaches. The most exposed suburbs nationally are listed below.

Affluent-STressThe analysis is based on responses to our survey which asks whether households feel they could cope with covering the costs of an additional 1% on their mortgage. Given that many have mortgages of more than $500,000, even a small rise is enough to create problems, especially given static income. Note also that more affluent segments are more at risk.

Read more about our research in our recent blog posts.

Household Finance Confidence Takes A Dive

In the latest edition of the DFA Household Finance Confidence Index, to end January 2016, we see a marked fall in overall confidence, down from 91.46 to 89.24. This reverses the improvement we saw in the last quarter of 2015. Households with investment property and stock market investments registered the strongest declines. Those in WA and SA also showed greater concerns about future job prospects compared with eastern states. Confidence continues to languish below the neutral setting of 100.

FCI-Jan-2016-SummaryThe results are derived from our household surveys, averaged across Australia. We have 26,000 households in our sample at any one time. We include detailed questions covering various aspects of a household’s financial footprint. The index measures how households are feeling about their financial health. To calculate the index we ask questions which cover a number of different dimensions. We start by asking households how confident they are feeling about their job security, whether their real income has risen or fallen in the past year, their view on their costs of living over the same period, whether they have increased their loans and other outstanding debts including credit cards and whether they are saving more than last year. Finally we ask about their overall change in net worth over the past 12 months – by net worth we mean net assets less outstanding debts.

Looking specifically at our property segmentation, we see a significant decline in confidence among property investors. There are two factors driving this, first rental income is constrained, and second prospective future capital growth is uncertain. In addition, concerns about potential adverse changes to negative gearing are also having an impact. Owner occupied property holders remain relatively more positive, thanks to continued low interest rates, and with little expectation of any rise in rates anytime soon.

FCI-Jan-2016---PropertyLooking at the moving parts which drive the index, costs of living continue to rise in real-terms, with 38% saying costs have risen in the past year, (up 3% from last month), whilst 58% said there had been no overall change (falls in fuel costs netting off other elements).

FCI-Jan-2016-Costs-of-LivingTurning to income growth, 2.3% said, in real terms (after inflation) their incomes had risen in the past year, (down 2.4% from last month), whilst 55% said there had been no net change. 41% said their income had fallen, thanks to lower investment returns, reduced overtime, and less available work. The figures varied across the states, but we won’t discuss that here.

FCI-Jan-2016-IncomeTurning to debt levels (and household debt has never been higher), 11% of household were more comfortable than a year ago (down 2% from last month), 25% were less comfortable, and 63% were about the same. Continuing low interest rates are helping to make large loans manageable.

FCI-Jan-2016-DebtNext we look at savings. 13% of households were more comfortable with their savings than a year ago, (down 1% from last month), whilst 32% were less comfortable, mainly due to their inability to save, or for those who can, the low returns currently on offer.

FCI-Jan-2016-SavingsJob security varied across the states, but at an aggregated level, 14% felt more secure than a year ago, 54% felt about the same, and 32% felt less secure (up 2.5% from last month). Those in resources, and manufacturing were on average less comfortable, compared with those in the service sectors. Continued drought conditions in some areas also had an adverse impact.

FCI-Jan-2016-JobFinally, we look at net worth. Here 61% of households said their net worth was higher than a year ago (down 1% from last month), whilst 26% said there was no change, and 13% said their net worth was lower. Those with property assets are protected by the rapid rises in the past year, even if future growth is less certain. Those with stock market investments are more concerned by recent falls.

FCI-Jan-2016-Net-WorthSo, overall households remain concerned, and this will translate into cautious spending patterns in coming months. Given continued uncertainly on global markets, property price dynamics, and the upcoming budget in May, we do not expect much of a recovery in confidence in the short term.