First Time Buyers Get The Investment Bug – Big Time

The most recent ABS data continues to underscore the fact that Owner Occupied First Time Buyers are sitting out of the market. In original terms, the number of first home buyer commitments as a percentage of total owner occupied housing finance commitments fell to 11.8% in August 2014 from 12.2% in July 2014.

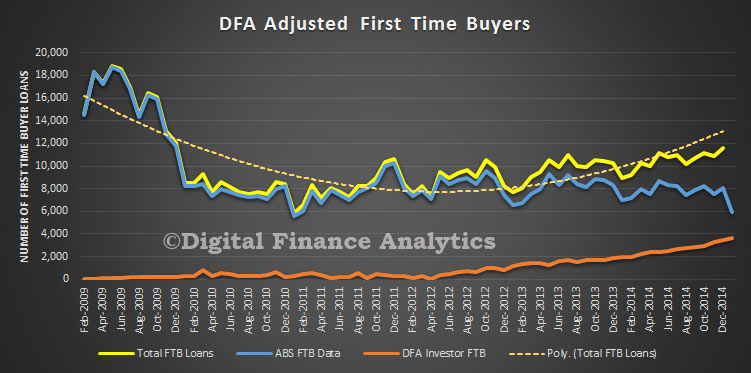
However, this is not telling us the full story. We have been tracking the rise and rise of first time buyers who are going direct to investment property.  The chart below shows the state of play, and the significant rise in the number of first time buyers going to the investment sector, especially in Sydney and Melbourne.

First-Time-Buyer-Oct-2014Another way to look at the data is the percentage of FTB who went for investment housing. In the latest data we estimate that around 30% of potential first time buyers went for the investment option. These are not identified in the official figures. I would also add that the small sample sizes prior to 2012 may impact the trend data, but the DFA samples, into 2013 and beyond are large enough to be meaningful and significant.

First-Time-Buyer-PC-Oct-2014From our surveys, we found that:

1. Most first time buyers were unable to afford to purchase a property to live in, in an area that made sense to them and were being priced out of the market.

2. However, many were anxious they were missing out on recent property gains, so decided to buy a less expensive property (often a unit) as an investment, thanks to negative gearing, they could afford it. They often continue to live at home meantime, hoping that the growth in capital could later be converted into a deposit for their own home – in other words, the investment property is an interim hedge into property, not a long term play. Some are also teaming up with friends to jointly purchase an investment, so spreading the costs.

3. About one third who purchased were assisted by the Bank of Mum and Dad, see our earlier post. More would consider an investment property by accessing their superannuation for property investment purposes, a bad idea in our view.

Given the heady state of property prices at the moment, this growth in investment property by prospective first time buyers is on one hand logical, on the other quite concerning.  We would also warn against increasing first time buyer incentives, as we discussed before.

Our analysis also highlights a deficiency in the ABS reporting, who are currently investigating the first time buyer statistics (because in some banks, first time buyers are identified by their application for a first owner grant alone). They should be tracking all first time buyer activity, not just those in the owner occupation category.


Household Ratios By Segment

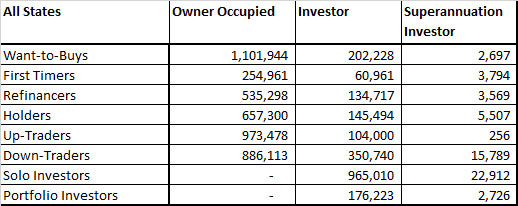
Yesterday DFA posted the most recent RBA household ratios showing that overall debt for households is higher than its ever been. Today we take the argument further, with detailed analysis across our segmentation, looking at loan to income ratios. The DFA segmentation positions households on a multi-factorial basis, including demographics, wealth and life-stage. The data here is the average across Australia by segment, there are significant state variations, which we won’t cover today. We see that the average is around 137. However, first time buyers have a more adverse ratio well above 200, and young families, just below 200. On the other hand, suburban families have a ratio around 100, and down traders are even lower. So my point is (once again) that averages can hide a world of differences. It is also worth noting that different household segments tend to live in different suburbs, so the net economic impact on an area will be different. One final point, the incomes are current ones (to take account of falling incomes in real terms) for our segments.

HouseholdRatiosSegmented

SMSF Property Investment Continues – DFA Survey

We updated our household surveys with the September data. Today we focus in on SMSF property transactions, which is a small, but rising factor in the market. We start by looking at the reason why trustees for SMSF’s are considering retail property. The strongest incentives are the tax efficient nature of the investment, and appreciating property values. Low rates also have  part to play. I have excluded commercial property from the analysis.

SMSFPropertyTransactSept2014We also asked where the trustees were getting advice from regarding retail property investment. Most interesting is a fall in advice from financial planners (maybe a reaction to FOFA, CBA etc?), and a rise in advice from real estate agents. Mortgage brokers also figure in the mix, alongside internet sources and own knowledge. We wonder how well qualified these sources are to provide the right advice, bearing in mind the long term nature of super.

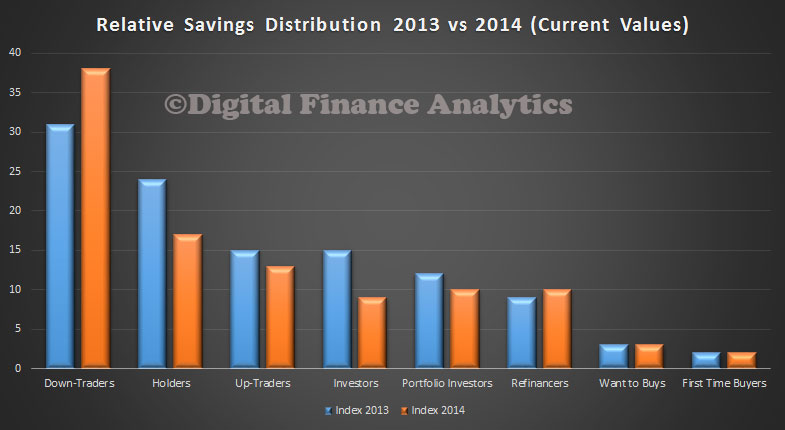
SMSFAdvisorSept2014Finally, we looked at changes in relative distribution of property in super funds, and of those who were investing in property (about 3% of all funds are investing in retail property, and another 3% are considering it). We see retail property making up quite a significant share of superannuation savings for some. The blue bar is last year, the orange bar is to September 2014.SMSFPropertySept2014Others can decide if this a good or bad thing, but it does highlight the linkages between property and super, and demonstrates that if house prices fall, then some super funds will be impacted, just at the time house valves are also falling. The impact of the double whammy is potentially significant and concerning.

RBA Comments On Housing Have Impact – DFA Survey

We have updated our household surveys with the results for September. This forward-looking research revealed some significant changes in sentiment amongst households thinking of transacting, and many of these changes can be traced to recent comments made by the RBA in respect of investment housing. Our approach to household segmentation and our surveys is described in an earlier post.  Today we will discuss some of the most important recent findings, which updates the results from our Property Imperative report.

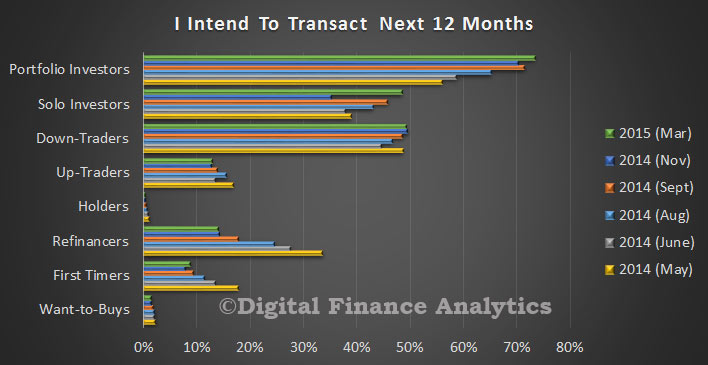
So first we look at which segments are most likely to transact in the next 12 months. The changes over time are significant, with first time buyer ever less likely to purchase whilst investors, especially portfolio investors, more likely to buy. The impact of down-traders (remember there are more than one million households in this category) are also significant.

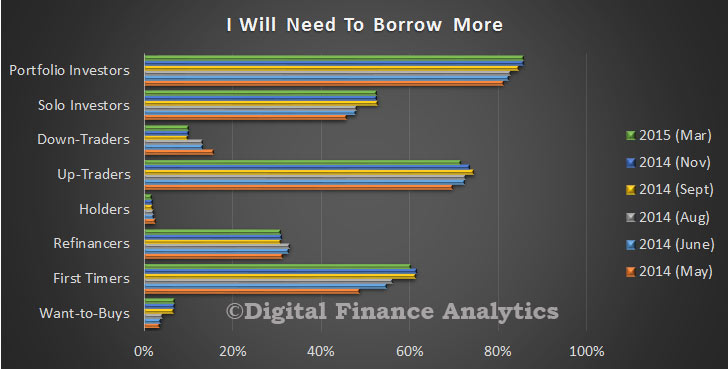
Transact12MonthsSept2014Demand for mortgage funding sits firmly with certain segments, especially investors, first time buyers and up-traders. Note that the bulk of down-traders do not need to borrow. This goes some way to explaining why house prices are moving faster than loan growth, and why investment loans are making up a large proportion of lending, especially in Sydney.

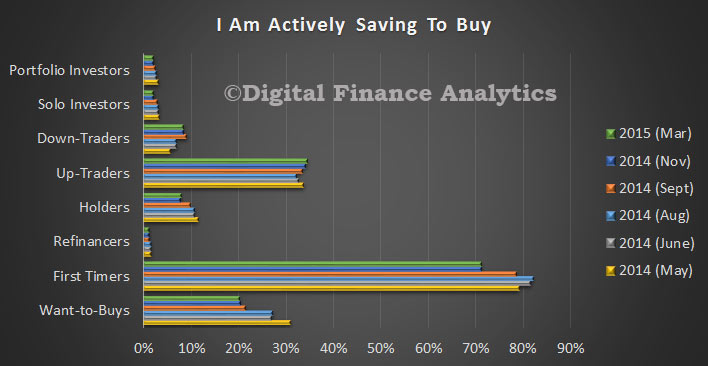
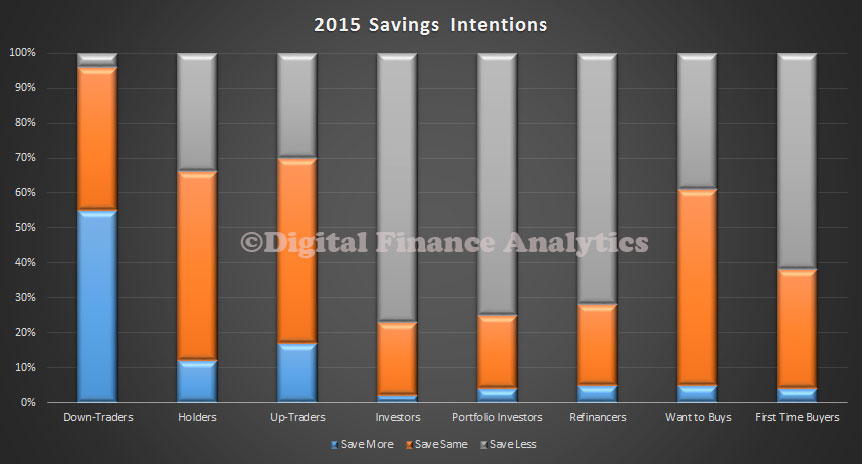
BorrowMoreSept2014We found that first time buyers are still saving hard, though chasing ever higher prices, want-to-buys are saving less now, seeing the aspiration of owning a property evaporating fast.

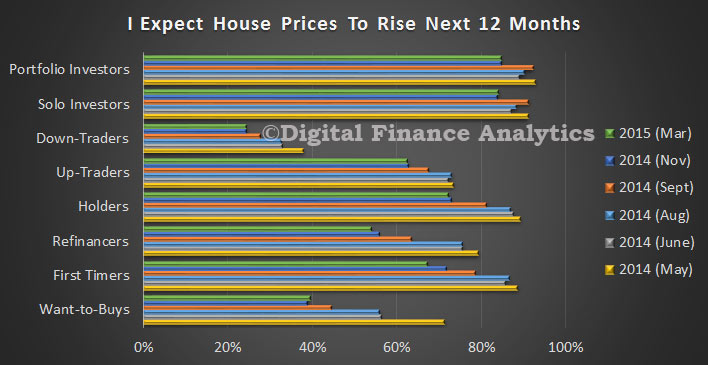
SeekingtoBuySept2014We found that across the board, there was a little less certainty on house prices growth, though generally investors remain more bullish.

HousePriceRisesSept2014The want-to-buys find the biggest barrier relates to the high price of housing. No change here.

WantToBuysSept2014This barrier is also echoed in the first time buyer segment, with 50% seeing price as the main issue, the highest result in recent times.

FTBuyersSept2014Many refinancers will have now locked in at low rates, as the main reason is to reduce monthly outgoings. The proportion locking in at fixed rates is down a little.

RefinanceSept2014We found that up-traders are still active, and there was an increase in those in this segment who are motivated by the prospect of capital appreciation, which is now running ahead, just, of buying to get more space. As shown above, the proportion of up-traders ready to transact is down a little.

UptradersSept2014Down-traders continue to seek to sell and buy smaller, driven by a quest to release capital for retirement, and for increased convenience. They were slightly more likely to incorporate an investment property in their strategy. We think the impact of down-traders on the market is understated by many observers, but the continuing release of capital from larger property, and buying smaller, plus investment, aligns with the growth in investment property demand, and yet lower rates of financing elsewhere.

DownTradersSept2014Looking at investors, we see continued interest, driven by the tax-efficient nature of investment lending (a.k.a negative gearing, and SMSF investing). They remain confident about capital appreciation into the future, though less strongly than previously.

InvestorsSept2014Finally, we looked at the potential barriers to investors, and we see a significant change. We ask about a range of barriers. One related to RBA warning, which this month have reach a new, high pitch. Investors are responding, and a proportion are concerned about potential regulatory changes. We also saw a tick up in the concerns about interest rates rising in coming months.

InvestorBarriersSept2014Overall then we still see demand strong, and focused in particular segments, especially investors and down-traders. However, the RBA warning are having an impact, even before they actually do anything to intervene further in the market. We do not believe that words alone will address the underlying systemic issues, but they can have a short term impact on sentiment, and may make some prospective purchasers think again – we therefore expect to see some small slowdown in coming weeks. That said, the market remains hot, and stoked by investors, and we believe there is a case for more direct intervention by the regulators. We also expect the RBA to keep up the verbal barrage.

Household Incomes And Property Segmentation

In the current discussions about macroprudential, stimulated by the RBA comments last week and likely to be stoked further as the RBA appears before the Senate Banking Committee on Thursday, many are claiming that household balance sheets and incomes are supporting the growth in house prices, and so no intervention is needed. The chair of the Banking Committee Sam Dastyari is “concerned about the unanticipated consequences of the Reserve Banks’s view-change on the sustainability of the housing boom and whether it needed to interfere with bank lending”.

The debate has shifted to first time buyers, and not wishing to put further barriers in the way of the small number able to enter the market at prices which are already too high. They may be missing the point. First, the increase in household wealth is directly linked to the rise in house prices (a weird piece of feedback here, as prices rise, households are more wealthy, so can accommodate higher prices – spot the chicken and egg problem?). In addition, wealth is growing thanks to stock market movements (though down recently) driven partly by the US and European low rates and printing money strategies. This will reverse as rates are moved to more normal levels later. Superannuation, the third element is of course savings for retirement, so cannot be touched normally (there are exceptions, and no, first time buyers should not be allowed to use their super to get into the property market). More first time buyer incentives won’t help.

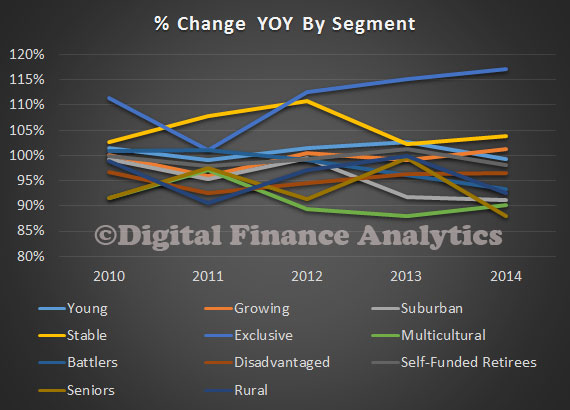
But, we have been looking at household incomes, after inflation, at a segment level. We segment based on property ownership, and you can read about the DFA segments here. On average, across all households, income growth is falling behind inflation. This is the ABS data from June 2014. In the past few months, real income is going backwards, before we consider rising costs of living.

AdjustedIncomeGrowthAllHowever, at a segment level, the situation is even more interesting, and diverse. Those wanting to buy, but unable to enter the market are seeing their incomes falling sharply, inflation adjusted, making the prospect of buying a house more unlikely. We are seeing the number of households in this group rising steadily, see our Property Imperative Report.

AdjustedIncomeGrowthWantToBuysFirst time buyers, those who have, or are purchasing for the first time, are also seeing income falling in real terms, more sharply than the average. This is why we are predicting a higher proportion of first time buyers will get into mortgage stress, especially if interest rates are increased. This is one reason why loan to income ratios for this group are high.

AdjustedIncomeGrowthFirstTimeBuyersThen looking at holders, their incomes are moving closer to the average. Holders have no plans to change their property, many have mortgages.

AdjustedIncomeGrowthHoldersRefinancers, are hoping to lock in lower rates, though we note the forward rates are now higher than they were, which may suggest the lowest deals are evaporating. One of the prime motivations for switching in this segment is to reduce outgoings, not surprising when we see incomes falling faster than the average in real terms.

AdjustedIncomeGrowthRefinanceNow, looking at Up Traders, we find their incomes are rising more quickly than the average. Up Traders have been active recently. They have the capacity to service larger loans. They will be purchasing primarily for owner occupation.

AdjustedIncomeGrowthTradingUpDown Traders have incomes rising more quickly, thanks to investment income, and there still about one million households looking to sell and move into a smaller property, releasing capital in the process. They are also active property investors, directing some of their released capital in this direction, either direct, or via super funds.

AdjustedIncomeGrowthDownTradersInvestors also have incomes which are rising faster than the average, so no surprise they are active in the market, seeking yields higher than deposits, and taking advantage of negative gearing. We continue to see a small but growing number of investors using super funds for the transaction.

AdjustedIncomeGrowthInvestorsSo, the segmental analysis highlights how complex the market is, and that there are no easy fixes. Any rise in interest rates would hit first time buyers very hard. Demand from investors (the foreign investment discussions is only a sideshow in my view) will be sustained, with the current policy settings. Raising interest rates will not help much on this front, because interest will be set against income. So macroprudential controls on investment loans makes more sense.

One option would be to differentially increase the capital buffers the banks hold for investment loans, making their pricing less aggressive, and the banks more willing to lend to suitable owner occupiers and businesses, which is what we need. Trimming demand for investment properties may help to control prices.

The bottom line though is that many years of poor policy are coming home to roost, on both the supply and demand side. A number of settings need to be changed, as discussed before.

Property Investors Get A Second Wind – Latest DFA Survey

The latest DFA Survey results indicate that momentum in the property investor segment is set for an upswing, as we move into the spring season. When we last reported on our survey results, there was a dip in intentions, quite strongly linked to budget uncertainly. This has largely evaporate now other than continuing concerns about potential benefit cuts. Today we summarise some of the recent results which points in this direction.

First we look at prospective purchasing intentions across our segments. We see first time buyers still languishing, whereas solo investors, portfolio investors and uptraders are showing an increase in momentum compared with results from June.

SegmentIntentionsAug2014House price expectations are pretty similar to earlier in the year, more are thinking prices are set to continue to rise, than fall.

SegmentPriceExpectationsAug2014Sole investors are being motivated by the prospect of appreciating property values, and better returns than deposits. They also continue to be attracted by tax breaks associated with investment purchases.

SoleInvestmentAugust2014Superannuation investors are still in the market attracted by the tax efficient nature of this investment class, and backed by expectations of rising prices. They are also responding to lower deposit rates.

SuperIvnestmentAugust2014Looking that those SMSF funds with property, we see that most have 30-40% of their super aligned to property, but there is a wide spread. Absolute numbers of SMSF’s with property remain quite low, but it is growing.

SMSFPropertyDistributionAugust2014So what is driving the resurgence of investors? We see that that overhand from the budget has mostly gone now, and funding is readily available. We also see that those who already bought, are coming back for more.

InvestmentBarriersAugust2014Finally, when we look at the budget factors in particular, we see that the high income levy still has an impact, whereas fears of changes to negative gearing has fallen, along with fears of changes to superannuation rules. We note though that concerns about reductions in benefits remains.BudgetInvestorsImpactAugust2014So, putting that all together, we think that investment lending will continue to outstrip owner occupied lending, and reach new records in coming months. We will incorporate this latest data into our models, and plan to publish an updated edition of the Property Imperative later in the year.

The Loan To Income Mess

Some time back we reported on the results of our household surveys, looking especially at the loan to income (LTI) data. This was prompted by the Bank of England’s move to limit banks abilities there to lend higher LTI loans. At the time we showed that at an aggregate level, LTI’s in Australia were higher than in the UK, yet despite this, there was no evidence of any local move to curb higher LTI borrowings, other than vague warnings from the regulators more recently. There is little relevant data published by the regulators on this important metric.

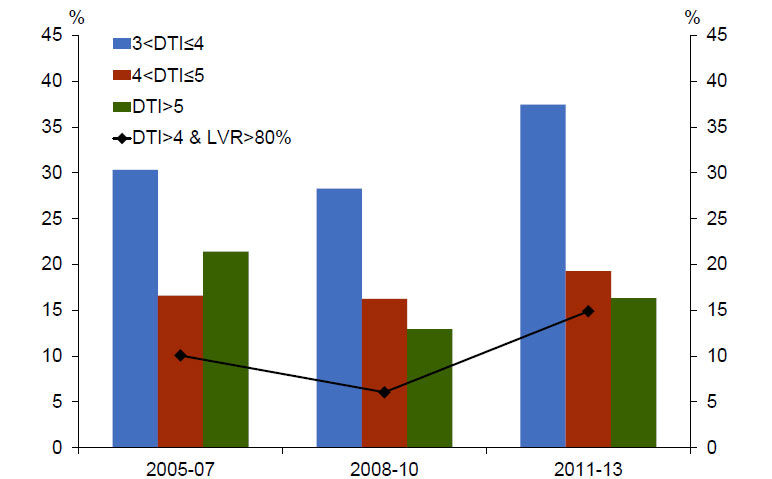
Today we delve into to the LTI data series in more detail.  Interestingly the control of LTI’s was the preferred macroprudential tool of choice by BIS and others. The UK recommendation was to ensure that mortgage lenders do not extend more than 15% of their total number of new residential mortgages at Loan to Income ratios at or greater than 4.5 times.

In our surveys we ask about a households mortgage loan, and its total gross income. From this we can derive an LTI ratio.

So, to recap. this is the current picture of LTI, averaged across post codes for all household segments, and all states. There is a peak around 4.5 times, and a second peak above 6 times.

LTIAllStatesNow, we can break the data out by state, and household segment, using the DFA survey data. The state specific data for NSW largely mirrors the national average.

LTINSWHowever, looking at TAS, we see some interesting variations. There the LTI’s are higher, reflecting lower incomes relative to somewhat lower house prices. We have adjusted the sample to take account of the smaller populations.

LTITASWA again shows variation, with a significant spread of higher LTI loans than the average.

LTIWAQLD shows greater concentration at lower LTI’s but then a second smaller peak at the upper end.

LTIQLDSA has quite a spike around 4.5 times, and a second peak around 6.5, again reflecting lower income levels in that state.

LTISAIf we then start to look at segments, we find that affluent group, Exclusive Professionals, has a consistently lower LTI, compared with…

LTIAffluent… Battlers …

LTIBattlers… And the Young Growing Families. Many of the First Time Buyers are in this segment. Effective LTI’s above 7 times are significantly extended.

LTIYoung I won’t go through all the other segments now, but the analysis suggests to me that the LTI metric is significant, and a good leading indicator of risks in the system. Remember interest rates are at rock bottom at the moment, so households can keep their heads above water. But as we know rates may rise, and unforeseen events may change individual circumstances.   Households with such high LTI’s have very little wriggle room.  As the interim FSI report said “Since the Wallis Inquiry, the increase in housing debt and banks’ more concentrated exposure to mortgages mean that housing has become a significant source of systemic risk”. “Higher household indebtedness and the greater proportion of mortgages on bank balance sheets mean that an extreme event in the housing market would have significant implications for financial stability and economic growth”.


Australian Household Loan To Income Ratios Are Worse Than In The UK

As we highlighted recently, the Bank of England is supporting the imposition of loan to income (LTI) ratios on banks in the UK, as a way to manage risks in the housing sector. So today, we start to explore loan to income data in Australia, captured though our rolling programme of household surveys. We start with some average national data, then look at the NSW picture in more detail. The UK recommendation, was to ensure that mortgage lenders do not extend more than 15% of their total number of new residential mortgages at Loan to Income ratios at or greater than 4.5. This recommendation applies to all lenders which extend residential mortgage lending in excess of £100 million per annum.

So whats the Australian data? We start by looking at the average LTI by postcode. The histogram shows the average LTI by household, calculated at a postcode level, and including all households with a mortgage. Income means the gross annual income, before tax or other deductions. We see that the LTI varies between 2.25 and 8. This is the ratio of household income to the size of the mortgage. We see a peak around 4.25-4.5 times, and a second peak at 6.25. Newer loans are more represented in this second peak.

Loan to income is a good indicator, because it isolates movements in house prices altogether from the data. The rule of thumb when I was working in the bank as a lender was to take 3 times the first income, and add one times the second income as a measure of the loan which was available to a household. Although rough, it was not too bad. Since then, lending rules have changed and criteria stretched. This ability to lend more has in turn led to higher house price inflation, thanks to supply/demand dynamics.

Australia-LTI-Average The current data from the UK shows that LTI’s there are spread between 0 and 6. Interestingly, we see that in their forward scenarios they suggest an emerging second peak around an LTI of 5 times. So LTI’s in Australia are more stretched than in the UK. The regulators here do not report LTI data regularly. This is a significant gap. LTI2We can map relative LTI average to post code. Here is the Sydney example, which highlights that there is a significant geographic concentration of high LTI loans in the western suburbs of Sydney.

Sydney-LTIThere is, further, a correlation between higher LTI loans and Mortgage Stress. Here is the stress data for Sydney.

NSW-Mortgage-StressThese are concerning indicators. In addition as we dig into the data we find that the second peak in the LTI data relates to younger buyers, often first time purchasers. They are highly leveraged into the property market, and are surviving thanks to the very low interest rates available today. If rates rise, this could be a problem. This suggests that the loan to income situation in Australia is more adverse than the UK scene. Whilst we note the UK regulator is acting, there is no macro-prudential intervention in Australia.  There should be.

Later we will present additional data across the other major centres, and examine in more detail those who are recent purchasers.

Investors Still Good To Go – Tax Breaks Ahoy!

Today we look at property investor trends in our household surveys series. We have been following the strong growth in investment lending, so was interested to see what property investors were thinking. Their appetite to invest appears to be slowing as we showed in our earlier post. Looking at those who are thinking about transacting, we find they are still attracted by the potential appreciation of property values, and the tax efficient nature of these investments. Low finance rates are a little less important, whilst getting returns better than deposits was up.

InvestorTransactDFAJun14Turning to the SMSF property investment area, the drivers are quite similar, although the potential for tax efficient investments is significant. They are also attracted by the leverage they can obtain.

InvestorSMSFTransactDFAJun14We have seen some interesting shifts relating to where potential SMSF property investors are getting their advice. The role of real estate agents has diminished in recent months (perhaps in reaction to the strong warnings from ASIC?) whilst mortgage brokers and internet forums and other sites have become more significant. We also see increasing personal knowledge guiding the trustees.

InvestorSMSFAdvisortDFAJun14Our last data point relates to the proportion of superannuation which is aligned to residential or commercial property. The most significant move was in the 10-20% range.

InvestorSMSFDistDFAJun14

How Household Property Buying Intentions Have Changed Since 1995

Today we continue our series on the latest results from our households surveys. Following our recent posts, we had several people ask about trends around some of the metrics we use. We have been running these surveys since 1995. So in this post we present a summary of trends from 1995 onwards. It provides an interesting perspective on how households have changed their behaviour in recent years.

IntentionsDFAJun14To explain the data, the bars show the rising trend in those households who are property inactive (inactive because they do not own property, and do not intend to in the foreseeable future). We show the percentage as a raw split, and also an adjusted split, to take account of population growth across states. The ratio of active to inactive households varies across individual states, and across geographic bands within states.

We also show the proportion of households who said they intended to transact in the next 12 months, and also their expectations, at the time, of house price movements for the next 12 months. Intention to transact was sitting at around 15% of households, until it fell as a result of the GFC. Since that time, it has powered ahead, and is significantly above long term trend – though note the recent fall. Turning to the proportion of households expecting property prices will rise in the coming 12 months, this is more variable, although the long term average prior to the GFC was close to 50%. If fell significantly in 2008 and 2009, before recovering, and reaching a high of 80% in 2013. It is still above long term trend, though falling slightly.

This data highlights the significant demand pressures on the property market, and helps to explain the high prices being achieved, although our interpretation is that the peak is now passed.

Next time we will consider households considering investment property.