Uncertainty, Complex Forces Weigh on Global Growth

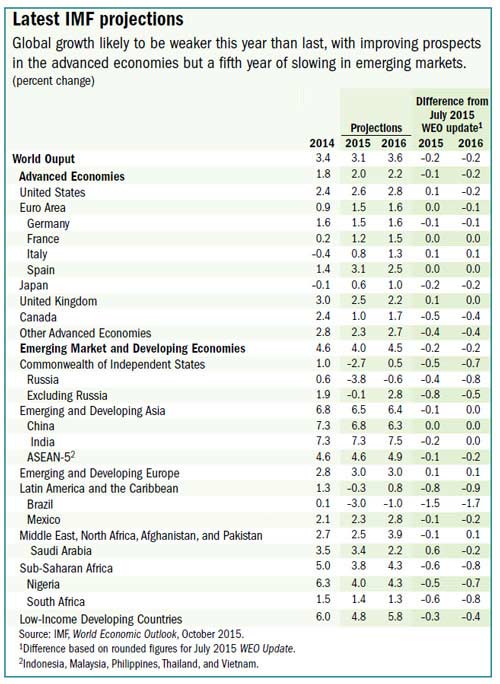
The IMF’s latest World Economic Outlook (WEO) makes 230 pages of sober reading. Global growth for 2015 is projected at 3.1 percent, 0.3 percentage point lower than in 2014, and 0.2 percentage point below the forecasts in the July 2015 World Economic Outlook (WEO) Update.

They list a litany of potential down-side risks to growth, including China’s economic transformation—away from export- and investment-led growth and manufacturing, in favor of a greater focus on consumption and services; the related fall in commodity prices; and the impending increase in U.S. interest rates, which can have global repercussions and add to current uncertainties. They foresee lower global growth compared to last year, with only modest pickup in advanced economies and a slowing in emerging markets, primarily reflecting weakness in some large emerging economies and oil-exporting countries.

Whilst global real GDP grew at 3.4 percent last year, and is forecast to grow at only 3.1 percent this year, growth is expected to rebound to 3.6 percent next year. However, we note that expected future growth is consistently being moved into the future.

“Six years after the world economy emerged from its broadest and deepest postwar recession, the holy grail of robust and synchronized global expansion remains elusive,” said Maurice Obstfeld, the IMF Economic Counsellor and Director of the Research Department. “Despite considerable differences in country-specific outlooks, the new forecasts mark down expected near-term growth marginally but nearly across the board. Moreover, downside risks to the world economy appear more pronounced than they did just a few months ago”.

IMF-Oct-2015

In this global environment, with the risk of low growth for a long time, the WEO underlines the need for policymakers to raise actual and potential growth.

Recovery in advanced economies on course

Growth in advanced economies is projected to increase modestly to 2 percent this year and 2.2 percent next. This year’s pickup reflects primarily a strengthening of the modest recovery in the euro area and a return to positive growth in Japan, supported by declining oil prices, accommodative monetary policy, and improved financial conditions, and in some cases, currency depreciation.

While growth is expected to increase in 2016, especially in North America, medium-term prospects remain subdued, reflecting a combination of lower investment, unfavorable demographics, and weak productivity growth.

Slower growth in emerging and developing economies

Growth prospects in emerging markets and developing economies vary across countries and regions. But the outlook in 2015 is generally weakening, with growth for these economies as a group projected to decline from 4.6 percent in 2014 to 4.0 percent in 2015.

The fifth straight year of slowing growth reflects a combination of factors: weaker growth in oil exporters, a slowdown in China with less reliance on commodity-intensive investment, adjustment in the aftermath of credit and investment booms, and a weaker outlook for exporters of other commodities, including in Latin America, following declines in their export prices. In addition, geopolitical tensions and domestic strife in a number of countries remain high, with immense economic and social costs.

External conditions are becoming more difficult for most emerging economies. The prospect of rising U.S. interest rates and a stronger dollar has already contributed to higher financing costs for some borrowers, including emerging and developing economies. And while the growth slowdown in China is so far in line with forecasts, its cross-border repercussions appear larger than previously envisaged, including through weaker commodity prices and reduced imports.

The projected rebound in growth in emerging market and developing economies in 2016 therefore reflects not a general recovery, but mostly a less deep recession or a partial normalization of conditions in countries in economic distress in 2015 (including Brazil, Russia, and some countries in Latin America and in the Middle East), spillovers from the stronger pickup in activity in advanced economies, and the easing of sanctions on the Islamic Republic of Iran.

Growth in low-income developing economies is expected to slow to 4.8 percent in 2015, from 6 percent in 2014, in large part due to weak commodity prices and the prospect of tighter global financial conditions. Some countries (e.g., Kyrgyz Republic, Mozambique) have been running large current account deficits, benefiting from easy access to foreign savings and abundant foreign direct investment, especially in resource-rich countries, and hence are particularly vulnerable to external financial shocks.

Downside risks more significant

Given the distribution of risks to the near-term outlook, global growth is more likely to fall short of expectations than to surprise on the upside. The WEO report outlines important shifts that could stall global recovery. These include:

Lower oil and other commodity prices, which although benefiting commodity importers, complicate the outlook for commodity exporters, some of whom already face strained initial conditions (e.g., Russia, Venezuela, Nigeria).

A sharper-than-expected slowdown in China, if the expected rebalancing toward a more market-based and consumption-driven growth proves more challenging than expected.

Disruptive asset price shifts and a further increase in financial market volatility could involve a reversal of capital flows in emerging market economies. Further, renewed concerns about China’s growth potential, Greece’s future in the euro area, the impact of sharply lower oil prices, and contagion effects could be sparks for market volatility.

• A further appreciation of the U.S. dollar could pose balance sheet and funding risks for dollar debtors, especially in some emerging market economies, where foreign–currency corporate debt has increased substantially over the past few years.

Increased geopolitical tensions in Ukraine, the Middle East, or parts of Africa could take a toll on confidence.

Policy upgrades to avoid low-growth traps

The report underscores that raising actual and potential output must remain the policy priority. This will require a combination of demand support and structural reforms.

In advanced economies, accommodative monetary policy continues to be essential, alongside macroprudential tools to contain financial sector risks, the report notes. On the fiscal side, countries with room for fiscal stimulus, such as Germany, should use it to boost public investment, especially in quality infrastructure.

Structural reforms are, of course, country specific. But the main planks include measures to strengthen labor force participation, facilitate labor market adjustment, tackle legacy debt overhang, and lower barriers to entry in product markets, especially in services.

Many emerging markets have increased their resilience to external shocks. Thanks to increased exchange rate flexibility, higher foreign exchange reserves, increased reliance on foreign direct investment flows and domestic-currency external financing, and generally stronger policy frameworks, many countries are now in a stronger position to manage heightened volatility.

Nevertheless, in a more complex external environment, emerging market and developing economies face a difficult trade-off between supporting demand amid slowing actual and potential growth and reducing vulnerabilities. The scope for policy easing varies considerably across countries, depending on macroeconomic conditions and sensitivity to commodity price shocks, as well as external, financial, and fiscal vulnerabilities.

For example, commodity exporters have to adjust to lower commodities-related revenue—gradually if fiscal buffers were built during the commodity boom, and more rapidly otherwise. In commodity-exporting countries with flexible exchange rate regimes, currency depreciation can help offset the demand impact of terms-of-trade losses. Yet, sharp exchange rate changes can also exacerbate vulnerabilities associated with high corporate leverage and foreign currency exposure. Therefore, exchange rate policy should not lose sight of financial stability considerations. At the same time, countries need to diversify their economies. Targeted structural reforms to raise productivity and remove bottlenecks to production can help countries to diversify their export bases.

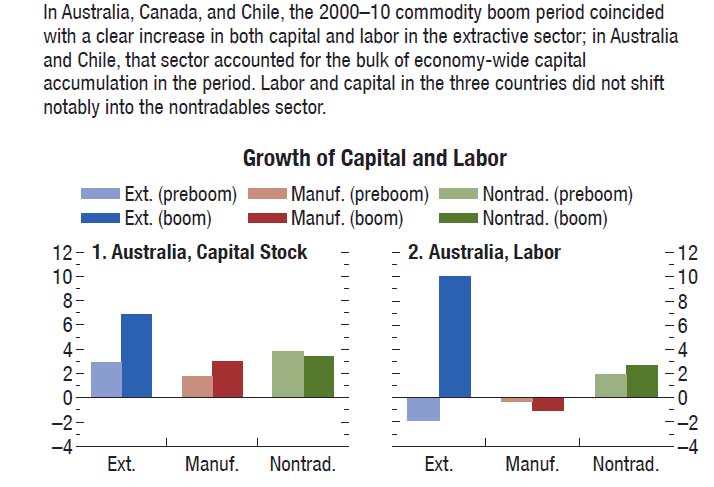
In their analysis of commodity trade-exposed countries, like Australia, they highlight the fact that investment in the resources sector did not translate into broader economic development.

IMF-Oct-2015-01

How the NBN could boost Australia’s GDP by 2%

From The Conversation.

The National Broadband Network (NBN) can boost Australia’s Gross Domestic Product (GDP) by about 2% in the long term and, more importantly, add to our national welfare by improving real household consumption by 1.4%.

These results, based on our recent research on the NBN’s economic benefit, mean the NBN will produce a step-change in Australia’ economic activity. If the future that we have modelled comes to pass, Australia will be better off with the NBN than it would have been without it.

With the NBN, valuable services are potentially more widely available than they would be without the NBN. We have been careful to attribute to the NBN only the value of increased availability of online services.

The services we have considered are ones that have documented evidence of their economic benefit. The six service categories included in our study were: cloud computing for small business; electronic commerce for small business and government; a hybrid form of online higher education; several forms of telehealth practice; teleworking; and entertainment services. Of these, telehealth and teleworking stand out as the most valuable contributors to the Australian economy with the NBN.

There is much uncertainty over what network capabilities are truly required to deliver the expected benefits from these services. We have therefore modelled two scenarios: one in which the services exploit advanced broadband capabilities; and one in which only modest capabilities are needed.

The difference between modest and fast

In the first scenario, we have assumed that most services require 10-25 Mbps downstream access speeds, with higher education and telehealth requiring only 2.5-10 Mbps. (The NBN was originally planned to provide 25 Mbps downstream.) The required upstream access speeds for most services were assumed to be at least 2.5 Mbps. This scenario produces a step-change in GDP in the long term – after the NBN is deployed – of 1.8%. Real household consumption increases by 2.0%, but this is reduced to 1.4% when the necessity of paying off the cost of the NBN is taken into account.

The second scenario is based on today’s applications and considering the low end of the possible range of access speeds. We have assumed relatively modest 2.5 Mbps downstream and 256 Kbps (0.256 Mbps) upstream access speeds are needed in most cases, with 10-25 Mbps downstream required to support streaming video and entertainment services. In this case, there is a modest rise in GDP (less than 0.2%) but real household consumption falls by about 0.4%. This clearly shows that an NBN built solely for entertainment is not economically worthwhile.

For our model of the Australian economy, we have used TERM, The Enormous Regional Model, from the Centre of Policy Studies at Victoria University. TERM has been used previously for studies related to environmental economics and other matters. We have modified it to include the NBN and to take account of the cost of building the network. We have assumed that the cost of the NBN is ultimately reflected in greater foreign debt, which must be paid for through higher export volumes.

We have been careful to compare like with like when we consider Australia with and without the NBN. In particular, we have assumed that without the NBN there would still be improvement in network access speeds. The primary delivery mechanism for broadband today is DSL, Digital Subscriber Line. We have assumed that all current and currently planned DSL deployments would be upgraded to ADSL2+, the highest speed variant available today. We have not assumed any expansion in Fibre to the Premises or HFC (Hybrid Fibre Coax) footprint.

For the NBN itself, we have used the technologies described in the NBN Strategic Review in December 2013. After this review, currently planned deployments of fibre-to-the-premises will continue – we have used the published plans from nbn co.

The existing HFC networks will be used with some fill-in of blackspots – in these circumstances we have mapped the existing HFC networks and modelled the effect of adding 900,000 premises to the HFC footprint. Fixed wireless will be deployed in less densely populated areas – in these areas we have used the published plans. We have assumed that the remainder of the NBN fixed-line footprint, after these other technologies have been taken into account, will be covered with fibre-to-the-node. Actual plans for fibre-to-the-node have not yet been published.

For the NBN capabilities, we have assumed that the network will deliver what has been foreshadowed. Specifically, this means downstream and upstream speeds of 25-100 Mbps for fibre-to-the-premises and HFC; 25-100 Mbps downstream and 2.5-10 Mbps (nominally 5 Mbps) upstream for fibre-to-the-node; and 10-25 Mbps downstream and 2.5-10 Mbps (nominally 4 Mbps) upstream for fixed wireless. We have excluded the satellite footprint from our study.

Our estimated benefits to the Australian economy are clearly conservative. They show the potential of the NBN but will only be realised if Australians and Australian industry embrace the opportunities provided by the NBN.


Authors: Leith Campbel, Honorary Fellow, Melbourne School of Engineering, University of Melbourne; Sascha Suessspec, Economist and Ph.D. Electronic and Electrical Engineering student, University of Melbourne.


OECD’s new tax proposals won’t stop companies shifting profits to tax havens

From The Conversation.

The news has been full of stories about how companies such as Amazon, Apple, Google, Microsoft, Starbucks and others are able to shift their profits to low or no-tax jurisdictions by using novel, legally permitted corporate structures and complex internal transactions (known as transfer pricing schemes). Companies are able to do so because they are generally taxed at the place of their residence rather than where the underlying economic activity takes place.

The European Union is estimated to be losing about one trillion euros each year due to a combination of tax avoidance, evasion and arrears. This is bigger than the combined gross domestic product (GDP) of Norway and Sweden and requires political action.

Against the above background, in 2013, the governments of G20 nations asked the Organisation for Economic Cooperation and Development (OECD) to develop proposals for dealing with Base Erosion and Profit Shifting (BEPS).

As part of the BEPS project, the OECD has now completed the first phase consisting of 15 possible actions. These form part of its final reports which exceed 1,000 pages and a summary is available here. There is much to digest and the OECD does offer some ways of tackling BEPS, but ultimately the project is unlikely to make a significant dent in organised corporate tax avoidance.

Profit Shifting

Transnational corporate groups have been very adept at engineering inter-group loans. Under this, one subsidiary borrows from another and pays interest. No cash effectively leaves the group and the interest paid by the paying subsidiary attracts tax relief while the receiving company, often located in low or no-tax jurisdiction, pays no tax on its income. So the OECD suggestion that the tax relief on such interest payments be restricted may dissuade some from opting to adopt these ingenious and complex financial arrangements.

Where does a company like Starbucks make its money? Reuters/Chris Helgren

The OECD has supported calls for country-by-country reporting (CBCR). This requires companies to show the profit they make in each country together with sales, employment and other relevant information. This information can help to illustrate the mismatch between economic activity and profits booked in each country.

But the OECD only recommends that this disclosure be made by each multinational corporation to the tax authority in its home country. To secure this information, governments of other countries will need to enter into numerous treaties. Poorer countries will hardly be in a position to leverage negotiations with more powerful countries. A more efficient solution would be for companies to publish the required information as part of their annual accounts – something the European Parliament has called for.

Out of date

The current corporate tax system was designed nearly a century ago when the contemporary form of transnational corporation, direct corporate investment in foreign operations and the internet did not exist. The OECD has failed to address the three biggest fault lines in the current system. First, under various international treaties, companies are taxed at their place of residence rather than the place of their economic activity. The OECD reforms do not make any significant change.

Second, modern corporations, such as Starbucks and Google, are integrated entities. They coordinate the economic activities of hundreds of subsidiaries to achieve economies of scale, market domination and profits, but for tax purposes are assumed to be separate economic activities. So a single group of companies with 500 subsidiaries is assumed to consist of 500 independent taxable entities in diverse locations. This leaves plenty of scope of profit shifting and tax games.

Third, the profits of a group of companies are allocated to each country by using a system known as transfer pricing. This requires arm’s-length or independent market prices to calculate the price of intra-group inputs and value of outputs to estimate taxable profits. In the era of global corporations, independent prices can’t easily be estimated. For example, as I found in an investigation in 2011, just ten corporations control 55% of the global trade in pharmaceuticals, 67% of the trade in seeds and fertilisers and 66% of the global biotechnology industry.

The way forward

The OECD recognises the problem but does not offer any way forward. Instead, it seeks to repair the current broken system through improved documentation for transfer pricing and international treaties. An alternative approach known as unitary taxation can address the above shortcomings. It treats each group of companies as a single unified economic entity. It recognises that there can be no sale, cost or profit until the company transacts with an external party. Thus, all intragroup profit shifting is negated.

The global profit of an entity is allocated to each country in accordance with key variables, such as sales, employees and assets – and each country can then tax the resulting profit at any rate that it wishes. A system of unitary taxation has been operated within the US since the 1930s to negate the impact of domestic tax havens (for example Delaware) and profit shifting. The OECD could have studied this but chose not to.

The BEPS project is unlikely to be the last word on corporate tax avoidance.

Author: Prem Sikka, Professor of Accounting, Essex Business School, University of Essex

Market jitters and weak global outlook means rates should hold

From The Conversation.

A weakening outlook for the global economy and jittery financial markets do not portend well for the Australian economy. With latest estimates of inflation at 1.5%, below the Reserve Bank of Australia’s target band of 2-3%, and delayed action in raising interest rates by the US Federal Reserve, the CAMA RBA Shadow Board on balance prefers to keep the cash rate on hold, attaching a 72% probability to this being the appropriate policy setting. The confidence attached to a required rate cut equals 14%, up five percentage points from the previous month, while the confidence in a required rate hike is unchanged at 14%.

Australia’s unemployment rate edged down to 6.2% in August, according to the Australian Bureau of Statistics, although the increase in monthly employment fell by more than half compared to July and the participation rate fell to a modest 65%. No new data on wage growth was released.

The Australian dollar’s decline continued to just below US70¢, making Australia’s exports even more competitive. Yields on Australian 10-year government bonds have fallen further to 2.62%, which is very low by historical standards.

The Australian property market is still looking strong, with the construction PMI surging to 53.8 in August, from 47.1 in July. However, in the same month building permits have fallen by nearly 7%. The local stock market has been suffering considerable losses, the S&P/ASX200 closing below 5000 earlier this week. With heightened uncertainty affecting global capital markets, it is unlikely domestic share prices will rebound significantly.

Data on the international economy has weakened. The US Federal Reserve has delayed the highly anticipated increase in the federal funds rate, citing low inflationary pressure and fragile capital markets. Delayed action by the Federal Reserve is likely to reduce the pressure to increase the domestic cash rate. In Europe, attention has shifted from the Greek debt crisis to the unabating refugee crisis. China’s economy continues to slow, with its manufacturing sector contracting for the second month in a row.

Many experts are now expecting China’s GDP growth to fall to 6%. Global capital markets continue to pose threats. According to the Institute for International Finance, net capital outflows for the world’s emerging markets will be negative this year, the first time since 1988, pointing to weak growth in the region. Commodity prices remain subdued.

Consumer and producer sentiment measures paint a motley picture. The Westpac/Melbourne Institute Consumer Sentiment Index fell back to 93.9 in September, from 99.5 in August. Business confidence, according to the NAB business survey slid further, from 10 in July to 4 in August and now 1, at the same time as the AIG manufacturing and services indices, both considered leading economic indicators, continued to improve slightly.

What the CAMA Shadow Board believes

The Shadow Board’s confidence that the cash rate should remain at its current level of 2% equals 72% (down from 77% in September). The confidence that a rate cut is appropriate has edged up a further five percentage points from the previous month, to 14%; conversely, the confidence that a rate increase, to 2.25% or higher, is called for is unchanged at 14%.

The probabilities at longer horizons are as follows: six months out, the estimated probability that the cash rate should remain at 2% equals 25% (27% in September). The estimated need for an interest rate increase lies at 62% (65% in September), while the need for a rate decrease is estimated at 13% (8% in September). A year out, the Shadow Board members’ confidence in a required cash rate increase equals 68% (six percentage points down from September), in a required cash rate decrease 14% (9% in September) and in a required hold of the cash rate 18% (unchanged).

Author provided
Author provided
Author provided

Comments from Shadow Reserve bank members

Paul Bloxham, Professor of Economics at Australian National University:

“Economic activity is gaining momentum.”

Author provided
Author provided
Author provided

The fall in the Australian dollar in recent months means that financial conditions have loosened noticeably. There is increasing evidence that the lower currency is working to support growth. Services exports are picking up, which combined with the ongoing upswing in housing activity, is lifting business conditions and jobs growth. Although GDP is growing at a below trend pace, the broader collection of activity indicators suggests that economic activity is gaining momentum, supported by very loose financial conditions. I recommend that the cash rate is left unchanged this month and expect that the cash rate is more likely to need to rise from here than fall, although not for some time yet.


Mark Crosby, Associate Professor, Melbourne Business School:

“Address weak economic fundamentals through reform rather than monetary policy.”

Author provided
Author provided
Author provided

Despite recent suggestions that the RBA should cut, it would appear unwise to do so in a world where the Fed is now very likely to raise at its next meeting. While Australia’s economic fundamentals are weak, issues are more properly addressed through tax, competitiveness and other reforms than through further loosening already loose monetary policy. Issues with excessive debt remain significant in many economies, and Australia ought not to exacerbate potential problems on that front through cutting rates. The medium term question is still how rates become normalised as at least some other advanced economies raise rates.


James Morley, Professor of Economics and Associate Dean (Research) at UNSW Australia Business School:

“The RBA can probably wait until US liftoff.”

Author provided
Author provided
Author provided

Despite the collapse of commodity prices and the effects of this on the stock market, the Australian economy has adjusted to the post-mining boom era reasonably well. This has been helped by the previous cuts in the policy rate and will continue to be supported by a weak Australian dollar. But the low interest rates also have risks in terms of large price swings in the housing market and excessive credit growth. Given all of this, the RBA should not lower the policy rate further. At the same time, the RBA can probably wait until US liftoff and more solid indications of inflationary pressures to start raising rates.


Jeffrey Sheen, Professor and Head of Department of Economics, Macquarie University, Editor, The Economic Record, CAMA:

“There is a significant risk of escalating market pessimism.”

Author provided
Author provided
Author provided

The US Federal Reserve did not change the target federal funds rate in September, given the sluggish world economy and fragile financial markets. These concerns will remain probably through to 2016. With input prices falling, inflation is unlikely to be an issue anywhere in the rich world for the forseeable future, and so there is no reason to act pre-emptively. Many central banks have cut interest rates in the last year including Australia, Canada, China, Denmark, Euro area, India, Israel, New Zealand, Norway, Russia, South Korea, Sweden and Switzerland. The time to change course is a way off, and in particular for Australia.

There are few indications of how potential GDP growth in Australia might go above the current 2%. A surge in China’s imports from Australia is unlikely. The new treasurer Scott Morrison appears likely to consolidate government expenditure. Business investment is still in retreat.

While some worry about a possible bubble in property prices, the September 2015 RBA Bulletin shows that there has been and remains significant structural excess demand for housing services in Australia, which is even more pronounced in NSW. The recent APRA-induced credit market tightening may have little effect on this structural excess demand, and may well dim one of the few bright lights in the economy – dwelling construction.

There is a significant risk of escalating market pessimism, which would be stoked by tightening monetary policy. For all these reasons, my recommendation has an increased weight on an interest rate cut, though no change still dominates for the October meeting.

Australians Are Data Hungry And More Connected Than Ever

The latest internet usage statistics from the ABS, released today, to June 2015 shows there were approximately 12.8 million internet subscribers in Australia at the end of June 2015. This is an increase of 2% from the end of June 2014. Our own surveys show that many households enjoy multiple internet connections, including a fixed line ADSL service, and mobile services, so subscriptions should not be equated with individual households (there are about 9 million separate households). This again highlights the digital disruption underway, which creates both opportunity and risk. The trends in our Quite Revolution Report on digital channels, if anything, understated the speed of change.

As at 30 June 2015, almost all (99%) internet connections were broadband. Fibre continues to be the fastest growing type of internet connection in both percentage terms and subscriber numbers. Internet subscriptions to a fibre connection increased by 107% (or 217,000 subscribers) from the end of June 2014 to the end of June 2015.

There are more mobile subscriptions than fixed subscriptions now, with 47% of subscriptions being for mobile services and 40% on ADSL services.

Net---Subscribers-June-2015The average speeds are increasing significantly, with more than 80% of subscribers now enjoying download rates of 8 Mbps more higher.

Net---Speeds-June-2015The volume of data being downloaded has risen significantly, especially via fixed line networks. Total volumes have more than doubled since 2012.

Net---VOlume-June-2015The average user on a mobile subscription downloads about 6 Gb of data, up from 4 Gb in 2010 per month. However the real growth has been in fixed line services, where the average user is now close to 200 Gb a month, compared with 45 Gb in 2010.

Net---Average-June-2015  The data volumes are likely to continue to grow, thanks to video on demand services, and more content rich sources, as well as cloud services. The nbn may not delivery sufficient capacity soon enough, and we are slipped behind other countries in terms of capacity and speed. Innovation and growth will likely be slowed as a result.

Job Ads Jump in September – ANZ

Further more postive economic indicators. According to ANZ Research, Job advertisements jumped 3.9% m/m in September in seasonally adjusted terms after rising by a solid 1.3% m/m in August. In trend terms, job ads were up 1.0% m/m and growth since mid year now appears a little stronger than previously. The number of internet job ads grew 4.0% m/m in September following an increase of 1.3% m/m in August. Internet job ads were 13.7% higher than a year earlier. The number of newspaper job ads (2% of total job ads) declined 2.7% m/m in September, after rising for two consecutive months.

ANZ-Job-Ads-Sept-2015

Why landmark OECD tax reform is doomed before it starts

From The Conversation.

The OECD’s final package of proposals for reforming the international system for taxing companies brings to an end the two-year BEPS project led by the OECD and other G20 countries which also included participation by representatives of developing countries, business, academia and NGOs.

Developing the BEPS, or Base Erosion and Profit Shifting reform package has been a remarkable endeavour involving thousands of hours of work and meetings – and thousands of pages of background work, interim proposals and commentary. All this has been in response to the undoubted need to reform a dysfunctional and ailing system.

It seems likely that, irrespective of the actual outcome, politicians will hail the BEPS project a success. Despite not having yet seen the final proposals we are prepared to disagree. The BEPS project may lead to some improvement but it will not lead to an international tax system fit for the 21st century. It might appear churlish to reach this conclusion before the final proposals have been published, so let us explain why.

In the February 2013 report that kicked off the project, the OECD made it clear that its aim was to close loopholes and tighten and extend existing rules to shore up the current system. It was equally clear that the fundamental framework underpinning the system was to remain in place. Subsequent BEPS documentation confirmed this.

However, the major problems afflicting the international tax system ultimately stem from flaws in the framework underpinning it. If that same framework remains in place, those problems cannot ultimately be resolved.

Double trouble

There are two major flaws. First, the current framework relies at its heart on concepts and distinctions that are not suited to the realities of a contemporary multinational enterprise operating in a global business environment.

Essentially, the international tax system addresses the possible double taxation of income arising from cross-border activity by allocating primary taxing rights between “residence” and “source” countries. In a “1920s compromise” in the League of Nations, source countries were allocated primary taxing rights to the “active” income of the business and residence countries the primary taxing rights to “passive” income, such as dividends, royalties and interest.

This might have been a sensible system in the 1920s but it is ill-suited to dealing with modern multinationals operating in a truly global business environment. Modern multinationals have shareholders scattered across the world, a parent company resident in one country, a potentially large number of affiliates undertaking an array of activities, such as research and development, production, marketing and finance that are located in many different countries, and consumers that could also be scattered across the world.

In such a scenario, there is no clear conceptual basis for identifying where profit is earned; all those locations may be considered to have some claim to taxing part of the company’s profit.

Best intentions? Reuters/Pool

Conceptually, the residence/source and active/passive distinctions do not offer much help. In practice, applying these distinctions in the context of intra-group transactions, where affiliated entities in different jurisdictions are assigned the status of “source” or “residence”, gives rise to extensive and significant problems, not least those relating to pricing transfers within the multinational group. Overall, they lead to a system which is easily manipulated, distortive, often incoherent and unprincipled.

Unhealthy competition

Second, the system invites governments to destabilise it by competing with each other for economic activity, tax revenue and possibly to try to advantage their own domestic companies. For at least 30 years this has led to gradual reductions in effective rates of taxation of profit. Governments around the world compete in this way while also demanding that companies should pay their “fair share” of tax, whatever that may be. This tension is particularly evident in the UK, where the goal of having the most competitive corporation tax regime in the G20 is held concomitantly with an active role in pushing forward the BEPS project.

Competition is not only on rates, but also on many aspects of the tax base. Over the years countries have introduced rules that enhance their competitive position or seek to give an advantage to domestic companies, but in practice facilitate the erosion of the tax base of both domestic and foreign jurisdictions and thus further destabilise an already fragile system. For example, as well as reducing tax rates, countries have introduced patent boxes with lower rates of tax on royalty income, and relaxed anti-avoidance measures intended to prevent international profit shifting.

These two flaws will continue to afflict the international tax system even if the proposals resulting from the BEPS project were to be implemented adequately by all states. For this reason, we do not believe it will lead to an international corporate tax system fit for the 21st century.


Authors: Michael Devereu, Professor of Business Taxation, University of Oxford, John Vell, Associate professor and Senior Research Fellow at the Oxford University Centre for Business Taxation (CBT), University of Oxford


Latest US Labor Data May Delay Fed Interest Rate Rise

Data from the US Bureau of Labor Statistics for September suggest that the Fed may delay their much anticipated, and continually postponed, interest rate rise. This is a reaction to slowing world trade, China, and financial market uncertainty, as well as as series of downward revisions to earlier months data.

Their September data showed that total nonfarm payroll employment increased by 142,000 in September, and the unemployment rate was unchanged at 5.1 percent. Job gains occurred in health care and information, while mining employment fell. Wage growth was zero.

In September, the unemployment rate held at 5.1 percent, and the number of unemployed persons (7.9 million) changed little. Over the year, the unemployment rate and the number of unemployed persons were down by 0.8 percentage point and 1.3 million, respectively.

The number of persons unemployed for less than 5 weeks increased by 268,000 to 2.4 million in September, partially offsetting a decline in August. The number of long-term unemployed (those jobless for 27 weeks or more) was little changed at 2.1 million in September and accounted for 26.6 percent of the unemployed.

The civilian labor force participation rate declined to 62.4 percent in September; the rate had been 62.6 percent for the prior 3 months. This level of participation has not been seen since the 1970’s. The employment-population ratio edged down to 59.2 percent in September, after showing little movement for the first 8 months of the year.

The number of persons employed part time for economic reasons (sometimes referred to as involuntary part-time workers) declined by 447,000 to 6.0 million in September. These individuals, who would have preferred full-time employment, were working part time because their hours had been cut back or because they were unable to find a full-time job. Over the past 12 months, the number of persons employed part time for economic reasons declined by 1.0 million.

In September, average hourly earnings for all employees on private nonfarm payrolls, at $25.09, changed little (-1 cent), following a 9-cent gain in August. Hourly earnings have risen by 2.2 percent over the year. Average hourly earnings of private-sector production and nonsupervisory employees were unchanged at $21.08 in September.

FactCheck Q&A: is Australia the most unequal it has been in 75 years?

The Conversation is fact-checking claims made on Q&A, broadcast Mondays on the ABC at 9:35pm. Thank you to everyone who sent us quotes for checking. Viewers can request statements to be FactChecked via Twitter using hashtags #FactCheck and #QandA, on Facebook or by email.

Excerpt from Q&A, September 21, 2015.

Australian statistics show that we are at the most unequal we’ve been in 75 years. – Leader of the Opposition, Bill Shorten, speaking on ABC TV’s Q&A program, September 21, 2015.

The complexity behind inequality is undeniable. Whole journals are dedicated to the topic and there are myriad ways of measuring it.

Members of the Opposition are fond of saying that inequality in Australia is at a 75-year high. That is, that inequality is worse now than it has been since about halfway through last century.

Is that statement supported by the research?

Checking the source

The source for Shorten’s stat is research by Shadow Assistant Treasurer Andrew Leigh, a former professor of economics at the Australian National University.

A spokesperson for Leigh directed The Conversation to the following graph, using data published in Leigh’s 2013 book, Battlers and Billionaires: The Story of Inequality in Australia.

Andrew Leigh, Battlers and Billionaires

The chart shows inequality since just after federation, defined as total income share held by the top earners. A higher figure is more unequal; lower means more equal, until one (when 1% hold 1% of total income).

Leigh says on his website that his analysis “is based on crunching tax data, national accounts figures, and population statistics.”

Leigh and fellow economist Tony Atkinson argued in a co-authored paper that inequality fell between the 1950s and the late 1970s. The same paper notes that for the top Australian earners:

There is a clear spike in 1950, mainly due to the peak wool prices which sheep farmers received in that year.

Commodity price anomalies aside, the overall trend in Leigh’s graph supports the narrative that income equality in Australia improved after the 1940s, began worsening in the 1980s, and is now back at levels not seen since the middle of last century.

So Shorten’s representation of Leigh’s data is perhaps a slight exaggeration but not a major one.

Technically, there was a spike in income inequality in 1950 so perhaps some sticklers will say Shorten should have said the most unequal in 65 years. Leigh’s data shows that apart from the spike, Australia is back to the level of top income shares of the 1940s (except for the war years 1944 and 1945).

What does other research say?

There is not much research on this issue going back as far as 75 years. Most other studies look at the last 20 years and most show that inequality is still a problem in Australia.

An Australia21 report released last year and launched by former politician John Hewson also warned of rising inequality. And a Parliamentary Committee recently reported Australia is more unequal.

Work by Professor Peter Whiteford, a researcher on inequality at the Australian National University, shows that higher average incomes do not benefit all Australians if gains are only held by the wealthy few.

And Whiteford wrote last year on The Conversation:

The most common measure of inequality is the Gini coefficient, which varies between zero and one. If everyone had exactly the same income then it would be zero (perfect equality). If one household had all the income then it would be one (complete inequality)… Research by economists David Johnson and Roger Wilkins found that the Gini coefficient increased from around 0.27 in 1981–82 to around 0.30 in 1997-98. Subsequently, the official ABS income statistics show that the Gini coefficient increased to 0.34 just before the global financial crisis in 2008, then fell to 0.32 in 2011-12.

Trends in income inequality (Gini coefficient) in Australia, 1981–82 to 2011-12. Author

The most recent income survey released by the ABS tracks, among other things, how Australia’s Gini coefficient has changed since the 1990s.

It shows that inequality peaked in 2007-08 and then fell, but in the most recent year went up again but not quite to the 2007-08 level. That suggests inequality was a little bit higher seven or eight years ago, compared to now.

A quick qualifier: tracking the Gini coefficient is valuable because it gives information on the bottom income earners as well as the top. However, the Gini can be constructed using broad or narrow income measures, different data sources, and can look at either household or individual incomes. So it is not a simple matter to compare Gini coefficient results. The ABS, in their Table 1.1 data release, urged caution in interpreting the recent changes in Gini coefficient results, saying:

Estimates presented for 2007–08 onwards are not directly comparable with estimates for previous cycles due to the improvements made to measuring income introduced in the 2007–08 cycle.

Much of the discussion of inequality is about the pattern of change over time – the trend, not the year-to-year differences. Many would argue insufficient consistent figures exist even since 2007-08 to identify a trend.

Finally, the ABS Gini estimate is based on surveys (which the tax based measure of the 1% share used by Leigh isn’t), with survey errors (see ABS explanatory note 78), and so each Gini is a mid-point and needs a window drawn around it, to reflect the possible range of the true value. This window might show that the very small differences in the estimates since 2007-8 actually aren’t statistically different.

We should be cautious not to draw conclusions from any sole figure; any single inequality measure provides only a partial picture. Looking at a broad range of inequality measures and trying to grasp the trend gives a better picture of inequality in Australia.

Verdict

It all depends on what figures you use.

Shorten’s representation of his ALP colleague Andrew Leigh’s data is perhaps slightly exaggerated but broadly correct – give or take a few years. There are not many inequality analyses going back as far as 75 years and most research supports the proposition that inequality has been rising in Australia.

There is data recently released by the ABS using the Gini coefficient that suggests inequality may have been a little bit higher seven or eight years ago than it is now. But there are strong doubts about whether this is true statistical difference or a trend. So it is too early to say whether inequality was stable or falling over the period from 2007-8 to now.


Review

The fact check is a good summary of the available data on income inequality and, importantly, the difficulty in measurement. The spike in the 1950s was probably due to one-off factors, so it is fair to discount it. What we should emphasise is that our choice of index matters. Different indices focus on different parts of the distribution. Do we care more about the middle compared to the bottom of the distribution, the top compare to the middle, or the very top of the distribution (the famous 1%)? Whatever index we use, it is reasonably clear that inequality is not falling over the long term in Australia, and is a key area of policy concern.

China Hard Landing Would Hit HK, Korea, Japan Hardest – Fitch

A Chinese “hard landing” would have a significant impact on global growth and economic stability, with economies in Asia and major emerging market commodities exporters among the hardest hit, says Fitch Ratings. Besides China itself, Hong Kong, Korea and Japan would be the most affected major economies in the event of a sharp slowdown in Chinese GDP growth.

Fitch’s base case forecasts China’s economy to expand by 6.8% and 6.3% in 2015 and 2016 respectively. But in the latest Global Economic Outlook report, Fitch assessed an alternative scenario in which China’s economic growth falls below 3% in 2016 driven by a collapse in public and private investment. Our assumptions in the shock scenario included a contraction in public investment of 4% in 2016 and deceleration in consumption growth to 5.6% in 2017 from 8.3% in 2014. This would result in asset-quality deterioration with a spike in the banking system NPL ratio to 8%, a cumulative 10% depreciation in CNY/USD, a double-digit percentage decrease in foreign direct investment and a peak to trough fall in home prices of over 4%.

According to the analysis, which used Oxford Economics’ global macroeconomic model, the impact would be greatest within Asia. The resulting decline in trade combined with the regional investment exposures to China would weigh most on the export-centred economies of Hong Kong and Korea, with the cumulative reduction in GDP from the 2017 baseline amounting to 4.5pp and 4.3pp respectively. Japan would enter a deep recession, with the economy contracting in both 2016 and 2017 and its GDP down by 3.6pp by 2017 versus our base case estimates. Taiwan and Singapore would also face significant slowdowns, though not as severe, with GDP falling by 3.3pp and 3.0pp from the baseline respectively.

GDP growth in the Association of Southeast Asian Nations (ASEAN) economies of Indonesia, Malaysia, Thailand and the Philippines would be less affected by the direct feedthroughs of a China hard landing, though they would still face a cumulative GDP effect of around -2pp.

Australia would be affected to a similar extent as the aforementioned ASEAN economies. Australia has large exposures through its direct trading relationship with China, but it would be able to offset some of the negative impact through counter-cyclical policy. As a ‘AAA’-rated developed economy, Australia benefits from sound fundamentals, which will help to stabilise the economy during a broader global downturn.

At the global level, a Chinese contraction would intensify deflation risks. This is especially the case for the euro zone, where demand has remained persistently weak and inflation low. That said, developed countries other than Japan would fare relatively better than their EM counterparts. Relative to the baseline, the cumulative effect on US and euro zone GDP would be -1.5pp and -1.7pp respectively, implying average annual growth rates of around 1.7% in the US and 0.8% in the euro zone for 2016-2017.

Major emerging markets outside Asia, especially the commodities exporters such as Brazil and Russia, would be doubly impacted by the effects on energy and materials prices and the risk premium shock that would raise borrowing costs and weigh on domestic demand. However, they would not be as heavily affected as the trade-reliant economies within Asia, with a Chinese hard landing likely to reduce GDP from the baseline by around 3pp for Brazil and 2.8pp for Russia.