When French academic and economist Thomas Piketty wrote a 700-page book about social inequality few would have expected it to become a bestseller.
Puzzled reviewers attempted to pin what merited the huge popularity it received. The popular Occupy movement? Moral support for improving human welfare? A gifted writer amongst academics?
Now, another inequality book, also with a red and black cover, has arrived in bookstores. At a much-shorter 384 pages, it’s written by economist Anthony Atkinson, who has been working on the topic of inequality for 50 years. Can lightning strike twice? Inequality, the sequel?
There is good news for those who liked Piketty’s book but didn’t manage to finish it. You can save yourself (and your summer reading list reputation) by just going to page 158 of Atkinson’s book where in one humble paragraph he gives you the answer at the end of Piketty’s universe: r > g.
More importantly, he translates it. The key mechanism governing the distribution of wealth is the difference between the rate of return on capital which is the r, and the rate of growth of the economy which is g. Even better news – you can buy the t-shirt.
Harvard University Press
Inequality: What can be done goes beyond Capital in the 21st Century by offering answers. Answers addressed hopefully to those who are minded to and can do something. A prescription for fixing the ailing patient.
Rather like the prosecution in a court action, the book starts by setting out the case exposing inequality: the evidence. The arguments that follow put aside reasons for action, and instead set out a factual “action to do list”.
The first answers are in part two. It turns out there are already common pills available that could just be done better, progressive taxes and transfers. He adds a call for smaller wage differentials within firms – yes, CEOs could give more back to their workers and slightly less to themselves.
Part three addresses the raised hackles part two always gets, the arguments against the excuses for inaction are given. This is a very valuable rebuttal primer for those that will need to make their case, again and again. Rather like Marie Antoinette, the cake often gets mentioned by opponents objecting dreadfully to the medicines Atkinson puts forward (they plead there will be a shrinking economic cake, but in this case the peasants don’t even get to eat it).
The best part is the eight-page climax: a concise bullet point list. Just right for action-minded readers.
But, what about Australian readers, do we need this medicine? Is Australia a fair society? Go to the index: Australia is listed. Spoiler alert: Australian inequality has risen since the 1980s.
My subtle gripe with the “what to do” answers: even if you get into government and do try to fix things by working through Atkinson’s list, you will need to read another book about “how to successfully do it”, especially if you try the transfers aspect. Something like “How to run a government so that citizens benefit and taxpayers don’t go crazy” by Michael Barber.
Playing devil’s advocate –- if these are the answers, then those minded to could use Atkinson’s list to deliver more inequality, by playing the record in reverse.
Because economics relies on a benevolent leader, the benevolent visible hand of government makes the economy fairer using policy that is in the public interest. A fly in the ointment is when public interest isn’t served, perhaps for re-election motives.
Helpfully, Atkinson’s list diagnoses their sound bytes and the inequality delivered.
Beware reductions of the top tax rate that deliver more inequality (but serve silver spoon lobbyists). Atkinson’s prognosis is progressive income tax rates with a marginal top rate of 65%, and broadening of the tax base.
Atkinson seems tuned in to the politics. “Heavy lifting” he says, falls to all levels of government, not just national!
Beware central bankers pleading efficiency (same old cake argument). Atkinson emphasises that distribution links GDP to citizens’ real life experiences.
Firstly, take action! Your choices can change things.
Atkinson’s manifesto argues countries still need investment in health, education and training. Explicit targets for unemployment reduction. A “Public Investment Authority” with a sovereign wealth fund that builds State net worth beyond taxes by investing in property and companies. A substantial child benefit amount paid to all children, but which can be taxed as income. “Social insurance”, with raised amounts and extended coverage – essentially a system of government transfers financed by contributions from employers, employees and government, protecting for economic hazards such unemployment, disability, injury and sickness, or old age.
Other suggestions include a capital endowment paid to all on adulthood (a grant of money that can be invested that gives a minimum inheritance to all). A progressive property tax based on regular valuations. Progressive lifetime capital taxes, with a progressive tax regime applied to inheritances and gifts received during a citizen’s life.
A cynical guess at what readers thought Piketty said that made a bestseller with new audiences? Capital (stocks, shares, real estate), will grow faster than income from earnings. An investment mantra on where your money will grow!
Author: Genevieve Knight, Senior Research Fellow, National Institute of Labour Studies at Flinders University
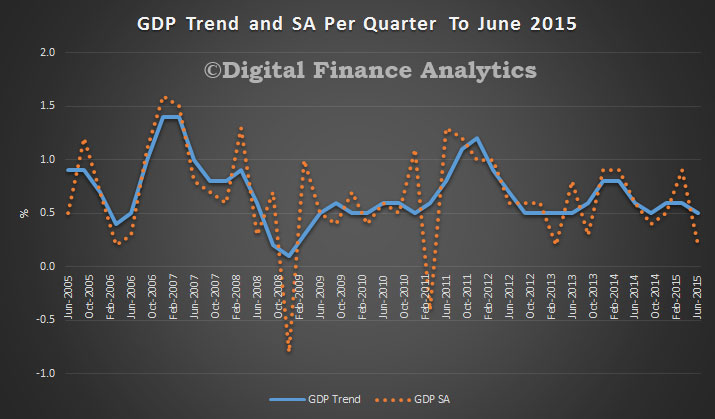
The ABS released their data today showing that in the June 2015 quarter national accounts, growth in the Australian economy slowing to 0.2% in seasonally adjusted chain volume terms and 2% over the past year. It was 0.5% in trend terms, our preferred measure (given recent statistical volatility), making an annual rate of 2.2%.
The ABS showed that reduced Mining and Construction activity, coupled with a decline in Exports were the main factors to the slowdown in economic growth. Positive contributions came from Domestic final demand, and the Financial, Transport and Health industries. Mining production fell significantly this quarter (-3.0%), although it is still positive through the year with growth at 2.1%. The decline in Mining production coincides with the fall in Exports. Net exports detracted 0.6 percentage points from GDP growth in the quarter, through the year they added 1.1 percentage points to GDP growth. This quarter continues to see the decline in mining related construction (Engineering construction -0.8%), which is reflected in the decline in Construction Gross value added (-0.6%).
There was positive growth in Domestic final demand with Household final consumption growing 0.5% this quarter and 2.5% through the year. Government final consumption had growth of 2.2% for the quarter and 4.0% through the year. Public gross fixed capital formation was up 4.0% for the June 2015 quarter, but remains subdued through the year with growth at 0.4%.
According to FitchRatings latest in their Global Perspectives series, policy responses to sharp corrections in financial markets should be expected as the Chinese government adheres to a core principle of maintaining stability.
Much Western criticism of Chinese policy responses to the equity market sell-off as clumsy and ineffective misreads critical points on China. Common views expressed are that Chinese officials don’t fully understand how markets operate, are manipulating the market, or have not yet developed policy channels and tools that are sufficiently sophisticated and adept to affect the market.
Stability a Higher Priority than Market Principle
The easiest misconception to take issue with is that intervention by Chinese policymakers confirms a lack of market insight. Even casual observers of China in recent decades would recognise the increased role of foreign firms and private innovation and the diminished role of the state. State enterprises retain a dominant role in critical areas of the economy, but private enterprise and market-based solutions have been vital to the country’s rapid industrialisation and development.
But the Chinese authorities’ deep aversion to instability – broadly defined, including financial instability – means there are limits to their embrace of market-based principles. Although the equity market is small from a macroeconomic perspective, a period of free-fall would sit uncomfortably with a government that does not hide its desire to retain and control the status quo in so many other areas.
In this context, recent equity market interventions were less about denying market principles than about confirming a stronger preference for stability, and for the state to have a primary role in providing it. The preference for stability would have been better placed had it come prior to the equity bubble inflating, but the government actually had an active role last year in encouraging investment in the market. This provided even stronger motivation to intervene during the market correction.
Collective Policymaking and Possibly More Debt
Even if public opinion could be swayed, creditors may take the view that there is still the need for significant policy change in Greece, and that debt relief would simply address the consequences of previous shortcomings, not the root causes. Greece still needs to undertake major reforms to deliver sustainable public finances and more robust economic growth, and creditors may be reluctant to surrender the ongoing conditionality provided by support programmes that could be discontinued if there were wholesale debt forgiveness. The risk would be that Greek imbalances re-emerge, eventually threatening the viability of the eurozone again.The various policy responses to the decline in the equity market have two familiar features – they involve a large number of participants and there is likely to be a resulting increase in debt.
The “national team” of public institutions involved in providing direct and indirect support to the equity markets has been portrayed by some observers as disjointed and ineffectual, primarily because there were several initiatives announced to which there was little or no market response. In addition, it has been argued that with so many institutions involved, including the Ministry of Finance and the People’s Bank of China (PBOC), none took a clear lead or stood out as having the credibility or authority to single-handedly sway the markets in the way that the Federal Reserve and European Central Bank were able to during episodes of stress in their markets.
But this misses the point that China’s patchwork of financial supervision and regulation is consistent with a deliberately diffused policy framework. This arrangement is in place not because a consensus-driven approach to decision-making is favoured – in fact, in some cases responsibilities are overlapping and initiatives at cross-purposes. Instead, policy diffusion is intended to ensure that state organisations operate collectively under the ultimate guidance of the country’s political leaders. As such, China’s authorities are unlikely to conclude from criticisms of the “national team” that they need a Greenspan or a Draghi to personify economic influence and authority. It is equally unlikely that there will be a regulatory overhaul to raise one institution to a coordinating “super-regulator”, as has been proposed by some foreign observers.
Just as the equity market was egged higher during its upswing in part by increases in debt – specifically via margin and peer-to-peer lending – elements of the policy responses to the downturn are also likely to raise debt levels. In July the China Securities Regulatory Commission (CSRC) relaxed some margin lending requirements of brokers, reversing a trend towards tightening earlier this year. The CSRC is also reported to have extended credit of RNB260bn to brokers, with funding from the bond market, banks and liquidity provided by the PBOC. Additionally, the China Banking Regulatory Commission has allowed banks to take a more flexible approach to corporate loans collateralised by equities, and has encouraged them to lend to listed companies engaged in stock buy-backs and to the CSRC.
The specific equity market initiatives that may increase debt should not be interpreted as a change in policy direction, as one of the authorities’ overriding objectives remains a reduction of indebtedness in the economy. The risks of potential solvency problems at current debt levels have been central to the acceptance and adoption of lower economic growth targets. But, as with other immediate policy challenges in China, the authorities see a further build-up in debt as a reliable – and presumably short-term – solution.
ANZ’s Stateometer, a new economic measure of Australia’s states and territories, showed economic growth in five Australian states was below trend in the year to June as Australian resource investment continues to decline. On the other hand, NSW and Victoria as the country’s top economic performers over the past year, led by strong residential investment, improving business and labour market conditions and pockets of strength in commercial property. Tasmania is close to its trend rate.
Tasmania and Queensland share similar characteristics to the stronger states including solid housing and private consumption and are also benefiting from the depreciating Australian dollar. ANZ says they expect their below-trend lower momentum position on the ANZ Stateometer will change as these drivers lead to recovery rather than further deterioration.
Western Australia (WA) and SA are experiencing downward momentum caused by WA’s ongoing mining consolidation and SA’s weakening industrial sector.
Economic activity increased in the Northern Territory due to recent improvements in its labour market. However it is expected to remain well below its growth trend rate due to a likely ongoing decline in overall business investment.
The ACT increased its momentum significantly but its performance has been well below its trend rate since Commonwealth budget tightening began around 2011.
They conclude that with strong inter-linkages between NSW and Victoria and the rest of the country, the weight of the resources downturn does present a downside risks to these economies. The backdrop of falling commodity prices and unsettled financial markets are also downside risks.
Wild swings in global stock markets have made investors edgy, the economic news coming out of China is not favourable and domestic private investment has plummeted. On the other hand, US growth surged to 3.7% annually and fears of a debt crisis in the Euro zone have abated. Latest estimates still put inflation at 1.5%, below the Reserve Bank of Australia’s target band of 2-3%.
The Shadow Board’s confidence that the cash rate should remain at its current level of 2% equals 77% (up from 68% in August). The confidence that a rate cut is appropriate has edged up three percentage points, to 9%; conversely, the confidence that a rate increase, to 2.25% or higher, is called for, has decreased considerably for the third time in a row, from 35% in July and 25% in August to 14%.
Latest figures show that Australia’s unemployment rate increased to 6.3% in July, according to the Australian Bureau of Statistics, even though total employment rose by nearly 40,000 in July. Nominal wage growth remains muted at 2.3% and is forecast to remain low in the next quarter.
The Aussie dollar depreciated further against major currencies. It now fetches less than 72 US¢. Yields on Australian 10-year government bonds remain low at 2.71%.
As already pointed out in last month’s statement, the Australian property market appears to be cooling and the local sharemarket is retreating further from its highs earlier this year.
The elephant about to enter the room is the dramatic fall in new private capital expenditure, equalling a sizable 4.0% in the June quarter, bringing the annual decline to 10.5%, the largest drop since the last recession in 1992. The large drop is largely attributable to the contraction of the mining sector; however, firms in other sectors are also planning to cut spending, posing a serious threat to the Australian economy.
The recent gyrations in worldwide stock markets have highlighted the frothiness in global asset prices. To what extent volatility and uncertainty in asset markets spills over into the real economy is, of course, unclear. However, few economists doubt that asset markets are relying on ultra-low interest rates to persist. Concerns about any debt crisis in the Euro zone have waned since the recent 80 billion Euro credit extended to Greece.
As in previous months, the deteriorating outlook for the Chinese economy pose the biggest immediate threat to Australia’s export markets and thus to Australia’s GDP. US growth, on the other hand, has been revised up to 3.7% (annualized) for the second quarter 2015, presenting a dilemma for the Federal Reserve Bank: the strong economic performance suggests an increase in the federal funds rate is around the corner but if volatility in stock markets persists, signalling heightened uncertainty about the future, the Fed may be tempted to postpone the interest rate increase. Commodity prices have continued to fall, with crude oil dipping below $40 a barrel.
Also of concern is the sizable contraction of world trade in the first half of this year. The volume of global trade shrank by 0.5% in the June quarter, while the figures for the March quarter were revised to a 1.5% contraction, indicating that world trade recorded its largest contraction since the 2008 global financial crisis.
Consumer and producer sentiment measures paint a motley picture. The Westpac/Melbourne Institute Consumer Sentiment Index jumped from 92.3 in July to 99.5 in August. Business confidence, according to the NAB business survey slumped from 10 in July to 4 in August, at the same time as the AIG manufacturing and services indices, both considered leading economic indicators, recorded notable improvements.
What the Shadow Board believes
The probabilities at longer horizons are as follows: 6 months out, the estimated probability that the cash rate should remain at 2% equals 27% (23% in August). The estimated need for an interest rate increase lies at 65% (73% in August), while the need for a rate decrease is estimated at 8% (4% in August).
A year out, the Shadow Board members’ confidence in a required cash rate increase equals 72% (six percentage down from August), in a required cash rate decrease 9% (7% in August) and in a required hold of the cash rate 18% (up from 15% in August).
Comments from Shadow Reserve bank members
Mark Crosby, Associate Professor, Melbourne Business School:
“The longer term outlook is still uncertain.”
Recent global gyrations should make the RBA hold rates this month, and with a recovery in equity markets outside of China there seems little reason to cut rates. The longer term outlook is still uncertain, with global trade falls the most recent worrying data in the global economy and far more consequential than falls in Chinese equity markets.
“International interest rates are likely to rise.”
International interest rates are likely to rise, as growth and employment in the US appear to be stabilising at normal rates. While Australian asset markets are expected to continue to be volatile, the exchange rate is expected to remain low. Keeping the official rate steady at 2% would help offset some of the negative effects of uncertainty in the international environment on the domestic economy – as well keep the policy rate well above the zero lower bound.
James Morley, Professor of Economics and Associate Dean (Research) at UNSW Australia Business School:
“The RBA should not provide a ‘Greenspan put’.”
Given the recent turbulence in financial markets and underlying inflation being at the low end of the target range, the RBA should hold its policy rate steady rather than raise it. But with a stable real economy, an overheated housing market, and a low dollar stimulating the foreign sector, the RBA should not provide a “Greenspan put” by cutting rates in response to the stock market. Instead, it should carefully monitor conditions to determine when it will need to start raising the policy rate back towards its neutral level.
Jeffrey Sheen, Professor and Head of Department of Economics, Macquarie University, Editor, The Economic Record, CAMA:
“Monetary policy needs to avoid reversing recent currency falls.”
The current fragility in global stock markets appears to be more of a dash to liquidity than to value. It is likely an over-reaction to expected future interest rate increases, beginning with the federal funds rate perhaps this year. Nevertheless some downward adjustment was probably necessary because the boom in global stock prices generally did not mirror the sluggish recovery in the global real economy.
The trade-weighted Australian dollar has fallen about 15% in the last year, and fortunately has not risen with the recent competitive depreciations across Asia. Monetary policy needs to avoid reversing this contributor to Australia’s improved export competitiveness. In the current volatile financial environment, the RBA should maintain the current cash rate in September, though I have modestly increased the probability of a desirable cut.
Author: Timo Henckel, Research Associate, Centre for Applied Macroeconomic Analysis at Australian National University
Back in 2001, former Goldman Sachs chief economist Jim O’Neill coined the acronym BRIC to highlight the immense economic potential of the emerging markets of Brazil, Russia, India and China in the decades to come. They would be the economic engines of tomorrow, he wrote.
The BRICs, which cover a quarter of the world’s landmass and contain 40% of its population, had a combined GDP of US$20 trillion back in 2001. Today these increasingly market-oriented economies boast a GDP of $30 trillion (or 20% of global GDP), a figure forecast to reach $120 trillion by 2050. Together, they control more than 43% of the world’s currency reserves and 20% of its trade.
But times have changed. Every BRIC country is struggling, and the group’s growing footprint means their problems are bad news for the global economy. That’s especially true for the troubles of China, where recent economic gloom triggered a rout in stock markets around the world. All but India’s is now in bear market territory – a decline of at least 20% from its peak.
Does this suggest the nascent age of the BRICs is already over – even before it really began – and if so, what does this mean for the rest of us? And what does it mean for companies in the US, Europe and elsewhere that have been increasingly targeting the BRICs for future growth?
These are the kinds of questions we ponder at Michigan State University’s International Business Center, which I’ve directed for the past 17 years. To help shine some light on them, I’m focusing on one issue that each of the BRIC nations is facing. How each country’s leaders choose to tackle them may well determine where they go from here. And in this analysis, I’m sticking to the original BRIC members: that is, excluding South Africa, which joined the group in 2010.
Past promise
When I first wrote about the BRICs in 2009, the political leadership in Brazil, Russia, India and China were beginning to demonstrate their collective economic and political potential by joining in a loosely defined partnership.
To them, the 2008 financial crisis exposed the weakness of the so-called advanced economies, and these four emerging markets saw themselves at the center of a new world order that would supplant the one led by the US, Europe and Japan. It was in their political and economic interest to join forces.
It was never about forming a union akin to Europe’s or even North America’s. The BRIC partnership was formed to coordinate the four countries’ efforts globally, formulate common views of global economic problems, reform the world financial system and become a major factor of multilateral diplomacy.
While O’Neill probably chose the order of the acronym – B, R, I, C – for the way it sounded rather than relative significance, the true ranking today is pretty clear: it’s not BRIC, it’s really ICRB.
India is doing the best economically; China follows (even with its recent troubles). The laggards are Russia, with its petroleum-dependent economy, and Brazil, which is suffering a crisis of confidence as a result of significant financial, economic and political turmoil.
Indian Prime Minister Narendra Modi must find a way to keep rising US interest rates from curbing his economy’s growth.Reuters
India plays lead in ‘Chindia’ as Fed rate hike looms
At the outset, India leads the BRIC pack, a sentiment displayed by its stock market, which hasn’t tanked nearly as much as its peers during the recent China-led sell-off.
Some argue India is in the best shape to handle China’s economic slowdown because of its political system and the economic freedoms that go along with it. While China maintains a top-down economy plagued by political interference and corruption, India has a vibrant private sector and more competitive freedom.
But an imminent hike in US interest rates is the biggest risk on the horizon and could hammer India. The country has attracted a flood of US cash in recent years thanks to the greater yields on offer, but higher rates in the US could reverse the tide. That in turn would cause India’s stock market to slump and currency to slide. Taken together with deep problems at its public sector banks, a sudden drop in the rupee would be potentially disastrous and could shatter consumer confidence.
Increased exports could offset some of the pain, but what India really needs to do is privatize its banking system to make it robust and better able to handle fluctuations in the global financial system such as a rise in US rates. That would help ensure India is able to keep its top spot on Asia’s dream team.
China’s slowdown may be President Xi Jinping’s biggest test.Reuters
China’s hubris
China, meanwhile, is learning its ability to control has its limits.
The People’s Bank of China, the country’s central bank, earlier this month decided to change its formula for calculating the reference rate of the yuan, prompting its currency to fall to a four-year low. Just a few days later, China reversed course to keep it from falling any further. In a rare public move, the central bank’s chief economist said that China is “fully capable” of intervening in the global currency market as it see fit.
Hubris comes to mind. China can certainly affect things, but not as much as it thinks – and this note can be applied to its handling of the economy and stock market as well, which it has been actively working to jack up.
With the stock market down more than 40% from its peak and economic growth slowing, China’s leaders must learn a tough lesson: they can’t control the market, economy and currency like play toys. If China truly wants to be the major player in the global marketplace that it thinks it already is, then the country has to give up some control and let market forces, internally and externally, play the dynamic role that they do in developed nations.
Russia’s Vladimir Putin has long promised economic reforms, to little avail.Reuters
Russia’s commodity curse
Russia, with its diverse population spanning 11 time zones, might make you think the country’s economy would be just as diverse. But despite paying some lip service to reform, the country remains highly dependent on oil to keep it going. And that’s very bad news because the price of oil is hovering near six-year lows.
Very few companies, let alone countries, can achieve sustainable success by focusing on commodities. With little upward movement in oil prices expected and the ongoing sanctions taking a toll, there is little hope that Russia will come out of its full-blown recession any time soon. The massive devaluation of the ruble vis-à-vis international benchmark currencies has helped exports, but not anywhere near enough.
What does Russia need to do? President Vladimir Putin has been promising reforms since taking the presidency at the end of 1999. Apart from an unlikely rebound in the oil market, Russia will have to follow through on those long-promised reforms or something better. The key is to move the economy away from commodities in order for the country to achieve the potential prophesied in 2001.
Brazilian President Dilma Rousseff suffers from single-digit approval ratings, making it harder to turn her economy around.Reuters
Brazil’s lack of confidence
Of the BRICs, Brazil seems the furthest from reclaiming its role as a future powerhouse. Record-low consumer confidence has curbed consumption, industrial production is contracting, and the economy appears to be in a recession. At the same time, the president’s approval rating is in the single digits thanks to an ongoing corruption scandal.
So it’s pretty clear that Brazilians are in a sour mood, and their economy continues to disappoint. Can the 2016 Olympics turn that around? If it’s anything like the 2014 World Cup, it doesn’t seem likely.
But nonetheless, the Olympic Games present an opportunity to showcase Brazil around the world and offset the problem of its currency and the accompanying dearth of tourists. Big stadiums, fancy parties and lavish spending on everything but the Brazilians themselves won’t cut it.
Leveraging the Olympics better than the World Cup, in a way that really gets the economy moving again and benefits citizens by spending on infrastructure like transportation, is a must for the country (though perhaps a lot of medals in the Olympics will be necessary to erase the memory of Brazil’s losses during the World Cup).
End of an age? Not just yet
The BRIC economies may be stumbling, but it’s far too soon to declare their era over, the current market rout not withstanding. Stumbling doesn’t signify crumbling, and each of the BRICs could easily rebound tomorrow (well, in a few years), depending on whether their leaders follow smart policies that begin to fix the disparate problems that plague their economies.
The year 2050 remains a long way off, leaving plenty of time for the current $120 trillion prediction to come true. The problem for the BRICs, though, is that the economic prediction for 2050 (and beyond) is a moving target. The fluidity of moving targets require savvy political and business leaders, sound decision-making, market forces, strategic thinking and building on industry globalization drivers.
To concretely realize the 2050 forecast, Russia has to become less oil-dependent and commodity-based; China has to build stronger trust in the global money and banking community; Brazil has to succeed economically in the 2016 Olympics and, most importantly, elevate consumer confidence; and India has to privatize some of its banks to offset the impending US rate hike.
Despite these troubles, the BRICs remain sound investment areas for companies and cannot be ignored. The size of the countries’ populations alone is enough to warrant strong attention (India and China have more than a third of the world’s population).
Just keep that less catchy acronym in mind: ICBR.
Author: Tomas Hult, Byington Endowed Chair and Professor of International Business at Michigan State University
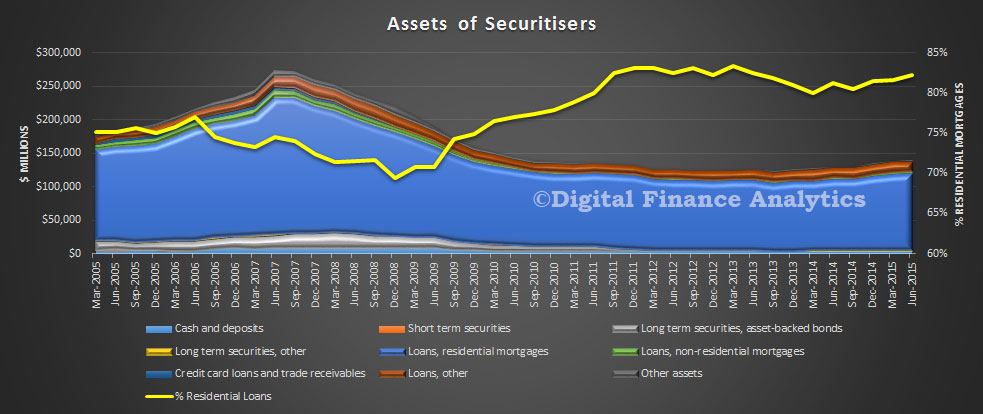
Data from the ABS shows that in the quarter to June 2015, balances with Securitisers grew. At 30 June 2015, total assets of Australian Securitisers were $140.4b, up $0.5b (0.3%) on 31 March 2015. During the June quarter 2015, the rise in total assets was due to an increase in residential mortgage assets (up $1.3b, 1.2%) and cash deposits (up $0.4b, 11.3%). This was partially offset by decreases in other loans (down $1.0b, 5.6%). Residential and non–residential mortgage assets accounted for 83.8% of total assets, were $117.6b at 30 June 2015, an increase of $1.3b (1.1%) during the quarter.
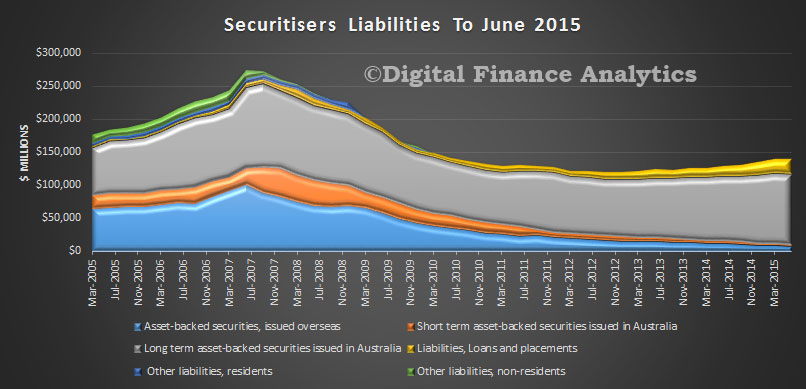
At 30 June 2015, total liabilities of Australian securitisers were $140.4b, up $0.5b (0.3%) on 31 March 2015. The rise in total liabilities was due to the increase in loans and placements (up $2.3b, 11.6%). This was partially offset by a decrease in long term asset backed securities issued in Australia (down $0.9b, 0.9%) and asset backed securities issued overseas (down $0.9b, 9.8%). At 30 June 2015, asset backed securities issued overseas as a proportion of total liabilities decreased to 5.9%, down 0.7% on the March quarter 2015 proportion of 6.6%. Asset backed securities issued in Australia as a proportion of total liabilities decreased to 77.1%, down 1.1% on the March quarter 2015 proportion of 78.2%.
We would expect to see further growth, because non-banks are likely to get more business as the majors dial back their investment lending, and because the securitisation market pricing has normalised from their heights of the GFC. That said, they are of course exposed to the global financial markets and events such as volatility in China are tending to lift rates a little. This may slow growth.
As another corporate reporting season in Australia draws to a close, the broad trend has been moderately underwhelming earnings results, combined with a rise in the earnings repaid to shareholders in the form of a dividend.
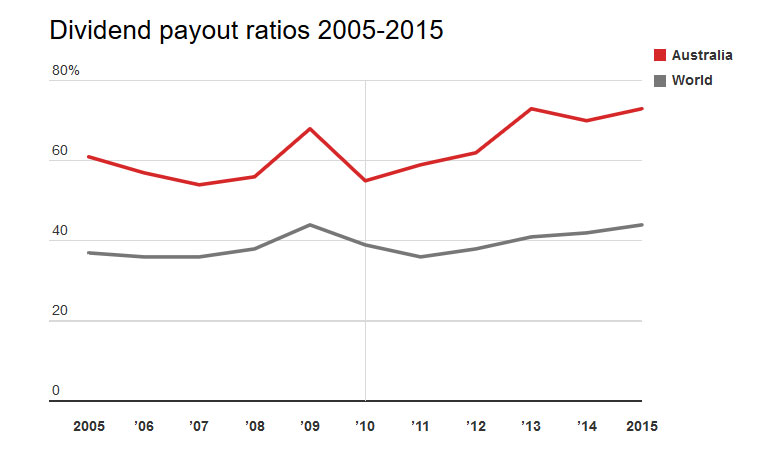
During this recent reporting period Australian firms returned, on average, 73% of their profits to shareholders as a dividend. This leaves only 27% of profits available to be retained in the firm to fund future growth.
As shown in the chart below, the ratio of profits paid out as dividends has increased in Australia from approximately 60% in 2005 to the current value of 73%. This result mirrors a recent international trend, however Australian firms continue to have high dividend payout ratios by international standards. The average firm around the world currently only returns 44% of profits to shareholders.
While many retail investors enjoy the regular revenue stream provided by the high yielding Australian equity market, this increasing trend in dividend payout ratios implies that dividends have consistently been growing at a faster rate than earnings; a phenomena that is not sustainable in the long-run and comes at the cost of economic growth.
A taxing issue
The large proportion of profits paid by Australian firms can largely be attributed to the imputation tax system, which was introduced in 1987 as a means of removing the double taxation of dividends. It allows companies to provide investors with a rebate for company tax that has been paid in the form of a franking credit attached to dividends.
Dividend imputation has achieved its intended aim of reducing the leverage of Australian firms. It’s an incentive for the use of equity rather than debt finance. Under the previous tax system, debt was more attractive than equity finance, resulting in the Australian economy having a large exposure to financial risk given the highly levered nature of many firms.
However, this reduction in financial risk has come at the cost of significant under-investment in the non-mining sectors of the Australian economy. The increased demand for dividends within an imputation tax system restricts firms’ access to their preferred source of financing: retained earnings.
The reinvestment of retained earnings creates multiplier effects that have a greater positive impact on the economy compared with dividends in the hands of individual shareholders. By retaining less of their earnings and under-investing compared with international counterparts, Australian firms run the risk of lagging behind.
Time for a policy fix?
Given the Australian government is currently focused on driving investment and growth in the non-mining sectors as the key mechanism for improving the current fiscal imbalance, consideration may have to be given to the future efficacy of the imputation tax system and the incentives it creates for large dividend payouts.
The imputation tax system is less relevant today than it was in 1987, given the increased integration between global markets and the growing reliance on international funding. As the tax benefits of the imputation tax system can only be accessed by Australian taxpayers, it creates a bias in favour of domestic investors.
For domestic superannuation funds with a marginal tax rate close to zero, the imputation tax system means they pay little, if any, tax on dividends, creating a big incentive for over-exposure to domestic equities. Given the structural changes that have occurred since 1987, the recent Financial System Inquiry noted that “the case for retaining dividend imputation is less clear than in the past”.
An alternative tax system that does not impose double taxation on investors while potentially reducing the current handbrake on economic growth is Singapore’s one-tier tax system. Under this system, profits are only taxed once at the corporate level. In Singapore dividends and capital gains are tax exempt. This simplified tax system reduces compliance costs and would ease the domestic investors’ current demand for dividends, and their associated franking credits, to be paid out.
Regardless of any taxation reform, investors need to be mindful that they can’t have their cake and eat it too with respect to dividends. The current trend of increasing the proportion of profits paid as dividends is not sustainable and has the potential to impede Australia’s long-run economic growth.
Author: Paul Docherty, Senior Lecturer, Newcastle Business School at University of Newcastle
In an address by Christopher Kent, RBA Assistant Governor (Economic), he looks at changes in the labour market and concludes that as population growth is slower than expected, effective employment utilisation is higher. Significantly, also, more Australians are now employed in the service sector.
The change in population growth rates is significant, and relevant to future demand for housing, and GDP estimates.
Official data suggested that the working-age population had been growing by about 1.7 per cent per annum, and it was expected to continue at about that rate in the foreseeable future. However, the most recent data from the ABS suggest that total population growth had dropped quite noticeably over the past year or so, from 1.8 per cent over 2012 to 1.4 per cent over 2014. Estimates of the working-age population are expected to be revised down accordingly in coming months.
The decline in population growth was mainly the result of a decline in net immigration. This appears to be related to the weakening in Australia’s labour market conditions relative to those of other countries. Of course, people on temporary skilled-work visas (so-called ‘457s’) leave for home when their jobs end. But there has also been a large decline in net immigration from New Zealand. Labour market conditions in New Zealand tightened at the same time that spare capacity in the Australian labour market increased. The reconstruction activity in Christchurch took off around the time that construction in Australia’s resource sector was winding down. Indeed, the key mining states of Queensland and Western Australia have seen the largest declines in net immigration. It also appears that Australia’s intake of international students has not picked up to the extent previously anticipated.
The unexpected slowdown in population growth implies somewhat less rapid growth of our labour force than otherwise. This means that the GDP growth that we have recorded may have been closer to the recent growth in the economy’s productive capacity than previously thought. If so, that would have left the economy with a little less spare capacity (a lower unemployment rate) than had been expected.
In an opinion piece in The Australian on Monday, Treasurer Hockey suggested that Australia collects too large a proportion of its public revenue through income tax.
He wrote: “The problem is we have an over-reliance on personal income tax to support our revenue base. Our largest source of tax revenue is personal income tax.”
And he went on to say: “When personal income tax is calculated as a proportion of total tax revenue, Australia’s taxation level is the second highest among OECD countries.”
At first sight, his assertion certainly checks out. Initial analysis of the OECD statistical database reveals that of the OECD countries, only Denmark collects more of its revenue through taxes on individuals. On average personal income tax comprises about a quarter of public revenue in OECD countries, while in Australia it is closer to 40%. A comparison across OECD countries is shown in Figure 1 below.
http://stats.oecd.org/
But this finding needs to be seen in context. While there is a widespread public perception that Australia is a high-taxation country, the reality is that Australia is one of the more lightly taxed of all developed countries. In 2013 (the latest year for which comparative data is available), Australian taxes across all tiers of government were 27% of GDP, compared with the OECD average of 34%. Of the tax we do collect a large proportion is in the form of personal income tax, but because our total collection is low, income tax forms a large proportion of that amount.
When we re-analyse the same data to consider income taxes as a proportion of GDP a different picture emerges, as shown in Figure 2. At 11% of GDP, our dependence on income tax is above the OECD average of 9%, but it is significantly lower than in many other OECD countries.
http://stats.oecd.org/
What is notable from Figure 2 is that more prosperous countries in general tend to be reliant on income taxes. While the OECD is traditionally seen as a “rich countries’ club”, expansions of its membership over recent years have brought that generalisation into question. It now includes Chile and Mexico, many eastern European countries re-establishing their economic bases after decades of central planning, and the struggling Mediterranean countries.
When analysis is restricted to a high-income OECD countries – those countries with per-capita incomes above $US36,000 – a different picture emerges, as is shown in Table 1. At 10.7% of GDP, Australia’s income tax revenue is about on the average of these countries (10.5% of GDP).
It is understandable that prosperous developed countries rely comparatively heavily on personal income taxes. They generally have a significant middle class, they have taxation authorities with the capacity to ensure a high degree of compliance, and their wealthier citizens aren’t about to emigrate to find better places to live.
This brief analysis is a reminder that we need to be wary of politicians’ broad statements on taxes. There is a political temptation to set the scene for income tax cuts in a pre-election budget, but, given Australia’s general low level of taxes and high fiscal deficit, the more compelling question should be about improving our public revenue.
Author: Ian McAuley, Lecturer, Public Sector Finance at University of Canberra