The seasonally adjusted Wage Price Index (WPI) rose 0.6 per cent in the June quarter 2015 and 2.3 per cent over the last year, according to figures released today by the Australian Bureau of Statistics (ABS).
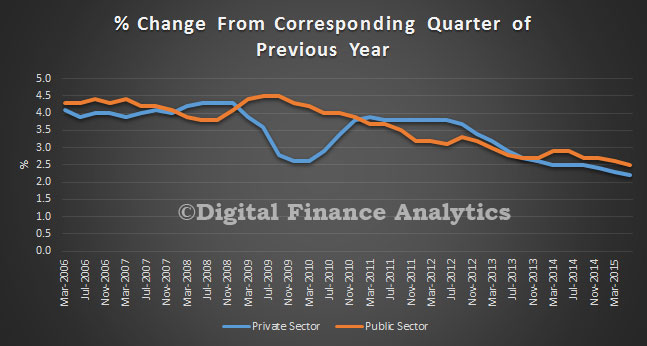
In the June quarter 2015, Private sector wages grew 0.5 per cent and Public sector wages grew 0.7 per cent (seasonally adjusted).
Private sector seasonally adjusted wage growth of 2.2 per cent over the last year is the lowest rate of wages growth since the start of the WPI series. The through-the-year series was first published in September quarter 1998. In the Public sector, wages grew 2.5 per cent over the last year.
In the June quarter, the largest rise of all industries (original series) is 0.8 per cent in Financial and insurance services. Rental, hiring and real estate services had the smallest rise of 0.1 per cent.
The latest ABS data shows that Australia’s estimated seasonally adjusted unemployment rate for July 2015 was 6.3 per cent, an increase of 0.3 percentage points (based on unrounded estimates) from a revised 6.1 per cent for June 2015. The trend (which smooths out the monthly variations to provide a more reliable view), was unchanged at 6.1 per cent. We continue to see monthly gyrations in the underlying data which makes it hard to draw any definitive conclusions. However, the headline jump will, I am sure, garner significant comment.
However, the seasonally adjusted labour force participation rate increased 0.3 percentage points to 65.1 per cent in July 2015. The number of jobs rose, mostly part-time positions, but also more people are seeking work. The ABS reported the number of people employed increased by 38,500 to 11,810,700 in July 2015 (seasonally adjusted). The increase in employment was driven by increases in both full-time and part-time employment, with the largest increase seen in part-time employment for males (up 20,400).
The ABS seasonally adjusted monthly hours worked in all jobs series decreased in July 2015, down 3.4 million hours (0.2 per cent) to 1,633.2 million hours.
The seasonally adjusted number of people unemployed increased by 40,100 to 800,700 in July 2015. This was driven by females who looked for both full-time work (up 18,200) and part-time work (up 14,600).
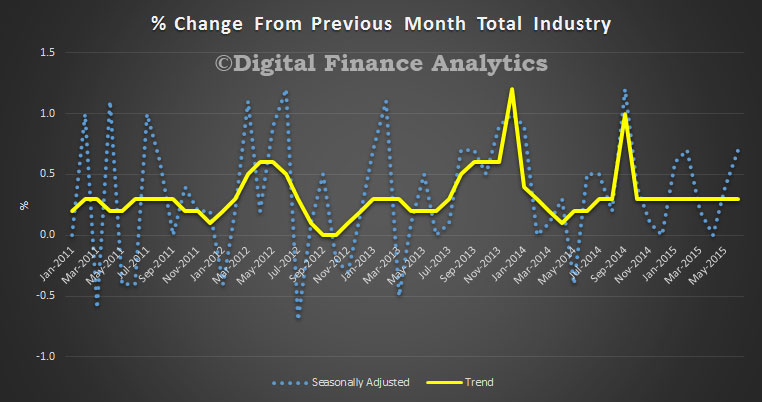
The monthly trend estimate for Australian retail turnover rose 0.3 per cent in June 2015 following a 0.3 per cent rise in May 2015. The trend estimate rose 4.7 per cent compared to June 2014.
In seasonally adjusted terms, there were rises in household goods retailing (2.2 per cent), other retailing (2.0 per cent) and cafes, restaurants and takeaway food services (1.2 per cent). There were falls in clothing, footwear and personal accessory retailing (-1.4 per cent), food retailing (-0.1 per cent) and department stores (-0.1 per cent).
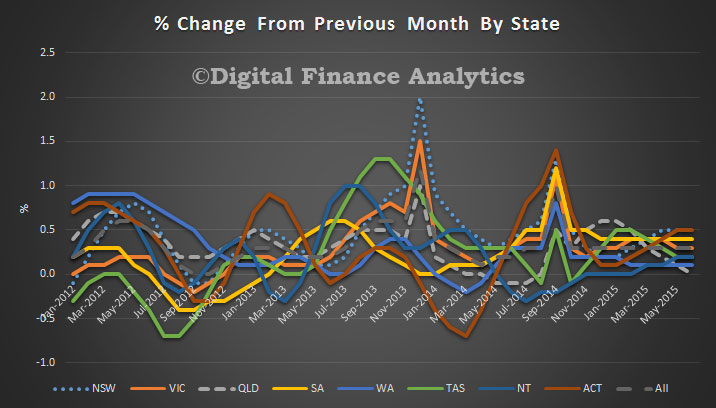
In seasonally adjusted terms there were rises in New South Wales (1.0 per cent), Victoria (0.8 per cent), South Australia (0.8 per cent), Queensland (0.2 per cent), Western Australia (0.2 per cent), the Northern Territory (0.8 per cent) and the Australian Capital Territory (0.2 per cent). Tasmania (0.0 per cent) was relatively unchanged.
The trend data shows a clearer pattern, with turnover in QLD falling to zero, ACT and NSW at the top rising, and the other states in between.
In seasonally adjusted volume terms, turnover rose 0.8 per cent in the June quarter 2015, following a rise of 0.6 per cent in the March quarter 2015.
Online retail turnover contributed 3.3 per cent to total retail turnover in original terms.
Agreement on the controversial Trans-Pacific Partnership could come as early as this week, with negotiations now focused on “the last few issues,” according to Trade Minister Andrew Robb.
Movement towards finalising the TPP comes as unions step up a campaign supported by Opposition Leader Bill Shorten against what is seen as anti-labour provisions in the China-Australia Free Trade Agreement, taking political debate over free trade to a new level.
“Dry” economists on the right don’t like “trade distorting” bilateral agreements (they don’t even like calling them “free trade” agreements), while many on the left are concerned about trade agreements going too far, beyond reducing tariffs and quotas, and getting involved in social policy, labour standards and the provision of public goods.
But even beyond the political debate, there is the question of what Australian businesses want from public policy as they engage themselves in global markets.
The DHL Export Barometer gives us a pretty good handle on what exporters think. It surveys 600 Australian exporters annually, and has done since 2003.
For the most part, trade agreements have traditionally played a small part in impediments to exporting. Most businesses worry about the exchange rate – when it is too high their goods and services become expensive, when it’s too low their input costs soar (as 80% of exporters also import). They also worry about border regulations and business culture differences. For the most part they didn’t think about FTAs and certainly not the GATT or the WTO.
But in the DHL Export Barometer for 2015, there’s good news about free trade agreements, which will be music to the ears of Andrew Robb.
In surveying existing and new agreements there is evidence that exporters like Australia’s FTAs and that they actually work in a practical business sense despite the recent controversy.
According to the DHL Export Barometer, the USA FTA (AUSFTA) is at last helpful after a decade of implementation. Other agreements deemed helpful include those with New Zealand, Singapore and ASEAN. The survey finds AUSFTA is benefiting exporters, with increased sales and a larger proportion of exporters claiming the agreement has had a positive impact on their business (55%).
This occurred despite the USA hitting the sub-prime crisis just three years after the deal was forged in 2005. The US unemployment rate has now returned to pre-GFC levels, notwithstanding the commentators who predicted that the AUSFTA would “kill a country” (I assume they meant Australia).
The support for AUSFTA was followed by that for New Zealand (47%), AANZFTA – the agreement between Australia, New Zealand and ASEAN on 41% and Singapore on 38%.
The new “trifecta” of FTAs – Japan, South Korea and China – has got the endorsement of the Australian exporter community. In fact, Japan is more beneficial than expected and all FTAs to North East Asia are enticing new exporters. Some 61% of exporters think the China FTA will have a positive effect, 36% think South Korea will and 35% think Japan will deliver.
In terms of the Japan FTA, 59% thought the trade pact would increase exports to that destination, and 38% thought they would start exporting to Japan as a result of the FTA. Many also thought the FTA would help enhance an online presence and help develop new products and services for that destination.
In terms of future FTA destinations, exporters think that India, Indonesia, the Gulf Co-operation Council and Latin America should now be on Andrew Robb’s dance card. But of all the future pacts, India drew the most negative ratings, consistent with the view about increased competition from India.
Perceptions matter
But what about the controversial TPP? It received a positive response among exporters, with 69% saying they’d increase exports to TPP countries and 25% saying they’d start exporting to TPP countries as a result of the TPP.
But the TPP has some complications not always apparent in up and down trade deals, including the investor provisions that have been controversial in other jurisdictions. As Princeton economist Dani Rodrik pointed out in his book “Has Globalisation Gone too Far?”, when trade agreements stray onto the turf of the provision of public goods, or legislation like plain packaging for tobacco, they are likely to lose public support.
Even in the China FTA the labour market provisions have overshadowed the benefits the overall agreement would bring. And it is important to remember Rodrik’s finding that economies that are open to trade have well developed labour market institutions and social insurance.
This is reflected in my own research that showed that exporters, on average, paid 60% higher wages than non-exporters, provided better levels of occupational health and safety, more education and training, equal opportunity provisions and were more likely to be unionised.
The research has shown free trade can grow side by side with union support. An open economy is bolstered by improvements in productivity, efficiency and fairness in the labour market. These are important lessons to heed as we strive to benefit from the next round of FTAs.
Author: Tim Harcourt, J.W. Nevile Fellow in Economics at UNSW Australia
A timely working paper from the IMF. “Does A Regional Trade Agreement Lessen or Exacerbate Growth Volatility? An Empirical Investigation” by Kangni Kpodar and Patrick A. Imam. They suggest the benefits outweigh the costs and countries that are more prone to shocks are more likely to join a RTA.
The paper assesses how regional trade agreements (RTAs) impact growth volatility on a worldwide sample of 170 countries with data spanning the period 1978-2012. Notwithstanding concerns that trade openness through RTAs can heighten exposure to shocks, in particular when it leads to increased product specialization, RTAs through enhanced policy credibility, improved policy coordination, and reduced risk of conflicts can ease growth volatility. Empirical estimations suggest the benefits outweigh the costs as RTAs are consistently associated with lower growth volatility, after controlling for trade openness and other determinants of growth volatility. Furthermore, regression results also suggest that countries that are more prone to shocks are more likely to join a RTA, in particular with countries with relatively less volatile growth, additionally enhancing the stabilization effect.
Note: The views expressed in this Working Paper are those of the author(s) and do not necessarily represent those of the IMF or IMF policy. Working Papers describe research in progress by the author(s) and are published to elicit comments and to further debate.
The ostensible purpose of the 2015 Intergenerational Report is to ensure Australia’s future prosperity in the face of demographic ageing over the next 40 years. Its real purpose is different.
The Coalition won the 2013 election as the party of economic management, a party that would balance the books after years of Labor profligacy, hence the 2014-15 budget cuts. The report uses the alleged ageing crisis to legitimate these budget cuts, as well as a high rate of immigration-fuelled population growth.
Thus it focuses on the costs of ageing. But our new research shows it makes three claims which are overstated to the point of being deliberately misleading. This is important as the IGR is being used as a basis for far-reaching policy decisions.
First, on page 1, the IGR says labour force participation will fall because the number of people aged 15-64 for every person 65 plus will drop from 4.5 today to just 2.7 in 2055. This fall will reduce per capita economic growth.
Second, the cost of providing health care, pensions and aged care for an older population will balloon.
Third, because migrants tend to be young, Australia must maintain high immigration. The authors project annual net overseas migration (NOM) of 215,000 from 2018-19 to 2054-55. This is a large number; from 1990-91 to 2005-06 the annual average was 95,000.
Together with natural increase, it will inflate the population from 23.8 million today to 39.7 million, an increase of 15.9 million, or 66.8%.
Claim 1: ageing and Australians’ future prosperity
Per capita economic growth is the product of the population, participation and productivity. The report’s calculations of their respective contribution are set out in in Figure 1. The main driver is productivity, projected to contribute 1.5 percentage points each year.
Source: ABS cat. no. 5206.0, 6202.0 and Treasury projections
The chart shows a slight fall in per capita economic growth from declining labour force participation of 0.1 percentage points a year. This is a big surprise. Despite the up-front assertion about ageing’s negative impact on participation, the effect turns out to be minimal.
An even bigger surprise is that the chart shows a 0.1 percentage point annual increase in per capita economic growth from population. This is because the proportion who are children will fall relative to all those aged 15 plus.
This positive effect is astonishing. Treasury’s own modelling shows that the ‘population’ effect cancels out the small labour-force participation effect.
Claim 2: budget costs
The report projects a substantial increase in health expenditure. But most of this is due to rising costs in providing health care for everyone. The online chart data for chart 2.11 makes this clear; only 16% of the projected increase is due to ageing.
Scares about pension costs and aged-care funding are similarly exaggerated. Pension payments currently equal 2.9% of GDP. Depending on policies, this percentage may fall to 2.7 by 2054-55 or rise to 3.6 (p. 69). And government expenditure on aged care may rise from 0.9% of GDP in 2014-15 to just 1.7% in 2054-55 (p. 71).
These two sets of figures are hardly startling. Indeed Australia spends a much lower proportion of GDP on age pensions than most OECD countries; in 2007 the OECD average was 7% of GDP.
Claim 3: the economic gains from high net migration
The report asserts that high migration results in a younger population than would be the case without it (p. 11). To bolster this claim it presents an arresting bar chart.
Source: ABS cat. no. 3101.0 and 3412.0.
But oddly the authors don’t quantify the difference and its long-term effects.
To fill this gap we used two ABS projections (with slightly different assumptions to those of the report) and estimated the difference that a NOM of 200,000 p.a. makes to the median age in 2055. We found that it produces a median age of 41.4. By comparison, no net migration over the next 40 years results in a median age of 46.1.
(The two projection series used here are series 38 (NOM 200,000 p.a, TFR 2.0, high life expectancy) and series 56 (Nom 0, TFR 2.0, high life expectancy). See data published online with Population Projections, Australia, 2012.
This minor “younging” effect is assumed to increase participation (page 20). But our research (p. 6) shows the report’s own data shows that this has a negligible impact on per capita economic growth. For example, an extra 70,000 net migrants per year until 2055 adds four million people but only increases per capita economic growth by 0.06%.
But the report’s goal is an extra 15.9 million, not four million. What about the infrastructure costs? Here it makes the bizarre claim that infrastructure costs “are not linked explicitly to demographic factors” (page 57).
Two hidden agendas
Demographic ageing does not impose heavy costs. Rather, the phony scare campaign has been used to justify the Coalition’s budget cuts, while the high NOM assumptions help justify its current immigration policy.
The government is desperate to find a short-term solution to the problem of lower economic activity post the resources boom. Population growth boosts the housing and city-building industries and this may help, not with per capita economic growth but with aggregate economic growth.
The latter is the key driver of tax revenue and, in the case of business, of growth in sales. The report does not say much about it, except to provide the results of its modelling. Here aggregate GDP is projected to grow by 2.8% per annum to 2054-55. (Page 27.) The IGR’s data shows that, while gains in productivity will make a substantial contribution to this, crude population growth accounts for nearly half.
Why worry?
The IGR does devote a few pages (See page 38) to the environmental implications of its population growth, conceding that careful management will be required. But it finds no serious costs for the Commonwealth as the “level of Commonwealth Government spending on the environment is not directly linked with demographic factors” (page 40).
So Treasury is off the hook. But all Australians will suffer from the impact of massive population growth on the environment and the alienation of agricultural land. (See contributions from Rhondda Dickson, Michael Jeffrey and Gary Jones in Sustainable Futures: Linking population, resources and the environment].
The other pressing concern for voters is jobs and the economy. What are the newly arrived migrants going to do, apart from build houses for each other?
The supposed economic ill-effects of ageing are trivial. They should be easily managed by future generations themselves, provided they are not overwhelmed by the costs of bloated cities and environmental decay.
Authors: Katharine Bett, Adjunct Associate Professor of Sociology at Swinburne University of Technology; Bob Birrel, Researcher, Centre for Population and Urban Research at Monash University
The NZ Reserve Bank today reduced the Official Cash Rate (OCR) by 25 basis points to 3.0 percent.
Global economic growth remains moderate, with only a gradual pickup in activity forecast. Recent developments in China and Europe led to heightened uncertainty and increased financial market volatility. Particular uncertainty remains around the impact of the expected tightening in US monetary policy.
New Zealand’s economy is currently growing at an annual rate of around 2.5 percent, supported by low interest rates, construction activity, and high net immigration. However, the growth outlook is now softer than at the time of the June Statement. Rebuild activity in Canterbury appears to have peaked, and the world price for New Zealand’s dairy exports has fallen sharply.
Headline inflation is currently below the Bank’s 1 to 3 percent target range, due largely to previous strength in the New Zealand dollar and a large decline in world oil prices. Annual CPI inflation is expected to be close to the midpoint of the range in early 2016, due to recent exchange rate depreciation and as the decline in oil prices drops out of the annual figure. A key uncertainty is how quickly the exchange rate pass-through will occur.
House prices in Auckland continue to increase rapidly, but, outside Auckland, house price inflation generally remains low. Increased building activity is underway in the Auckland region, but it will take some time for the imbalances in the housing market to be corrected.
The New Zealand dollar has declined significantly since April and, along with lower interest rates, has led to an easing in monetary conditions. While the currency depreciation will provide support to the export and import competing sectors, further depreciation is necessary given the weakness in export commodity prices.
A reduction in the OCR is warranted by the softening in the economic outlook and low inflation. At this point, some further easing seems likely.
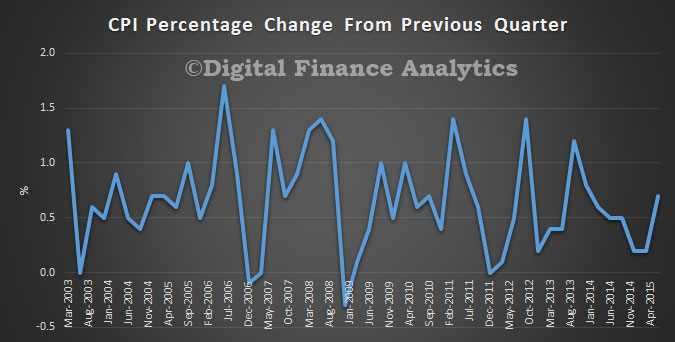
The ABS released the latest CPI data. The Consumer Price Index (CPI) rose 0.7 per cent in the June quarter 2015, following a rise of 0.2 per cent in the March quarter 2015.
This translates to an annual CPI of 1.5 per cent through the year to the June quarter 2015, following a rise of 1.3 per cent through the year to the March quarter 2015.
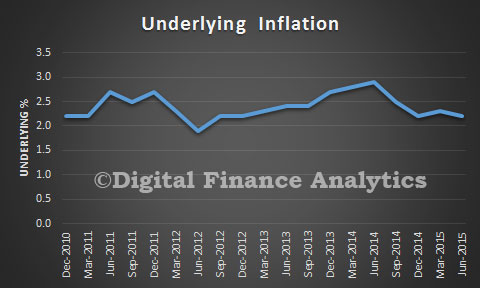
Underlying inflation is still in the 2-3% RBA target range, so there would be no impact of potential cash rate movements.
The most significant price rises this quarter were in automotive fuel (+12.2 per cent), medical and hospital services (+4.5 per cent) and new dwelling purchase by owner–occupiers (+1.5 per cent), These rises were partially offset by falls in domestic holiday travel and accommodation (–5.4 per cent) and pharmaceutical products (–1.8 per cent). The increase in fuel is registered in four of the five fuel types with the quarterly rise the largest since December 1990.
Even before the government’s options paper on tax reform is released later this year, many reforms have been taken off the table, at least before the next election. Here’s the expert view on six.
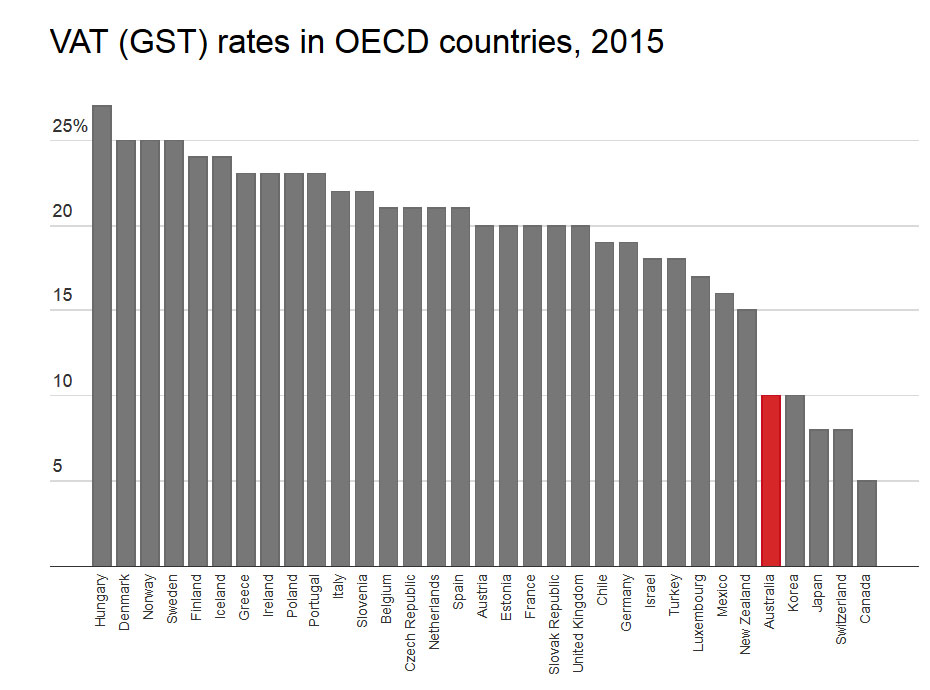
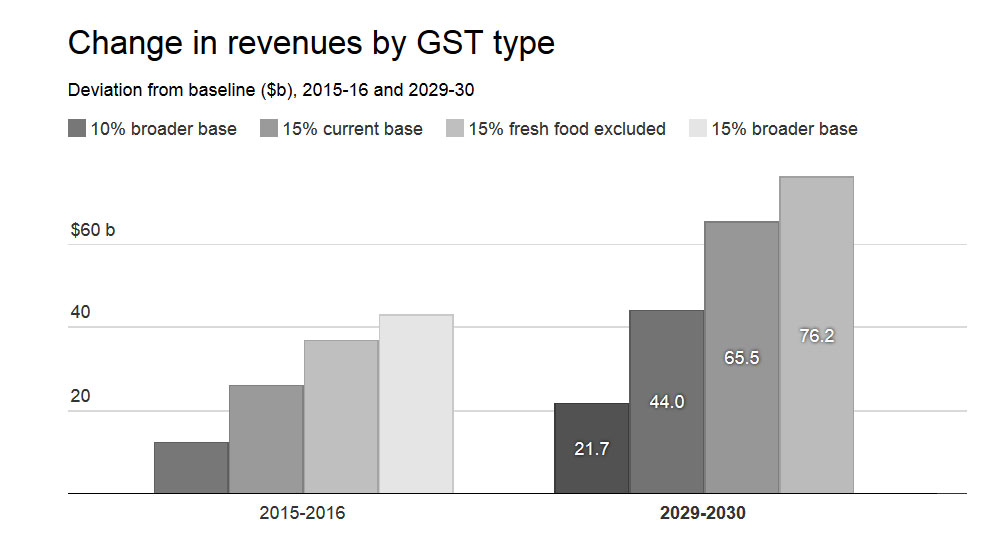
Broadening or increasing the GST
Some experts say expanding the GST, which is a regressive tax, would unfairly hit middle-income earners and women. Others say a broader base, not higher rate, would be the best approach.
If done as part of a package of tax reforms, John Freebairn argues increasing the GST could actually boost our standard of living.
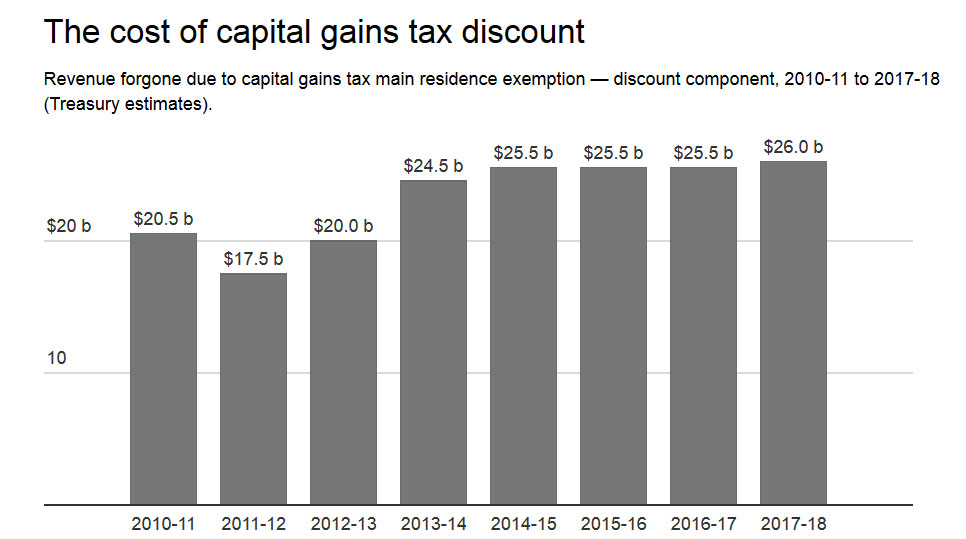
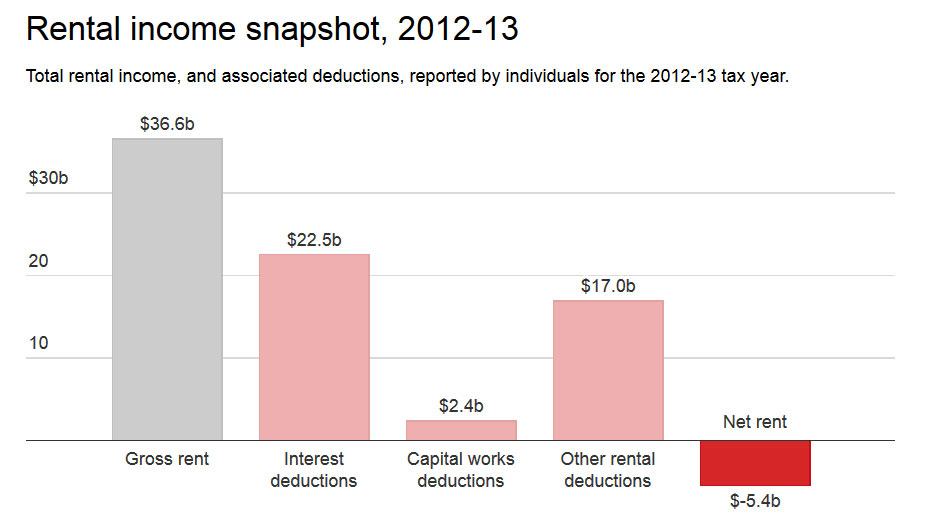
Fixing the asymmetry between negative gearing and capital gains tax
As Helen Hodgson has explained, negative gearing would be less attractive if the capital gain on the sale of an investment was taxed in full.
The Henry Review recommended reducing the benefit of negative gearing by allowing only a 40% capital gains discount, but this was rejected by then Prime Minister Kevin Rudd.
Antony Ting says negative gearing is not a fair tax policy – particularly when considering the way investment properties are treated.
Dale Boccabella says the best solution would be to quarantine negative gearing so that losses on investment properties couldn’t be used as deductions against other income. But he also thinks abolishing it is preferable.
Prime Minister Tony Abbott has ruled out any changes to negative gearing, arguing to do so would be akin to increasing taxes.
Adopting global measures to prevent tax avoidance by multinationals
When Australia hosted the G20 leaders summit in November last year, it agreed to a number of actions to ensure fairness in the international tax system. The OECD is leading global reforms, arguing unilateral action could harm the global agreement that is required to stop multinationals shifting profits to reduce their tax burden.
Since then, Treasurer Joe Hockey has announced new measures specifically designed to target multinationals using complex schemes to escape paying tax. Experts say the measures lack teeth since they only apply to foreign and not Australian multinationals.
The next set of OECD-led measures to address global tax avoidance are due to be released at this year’s G20 summit in Turkey. The OECD recommendations will be finalised by December.
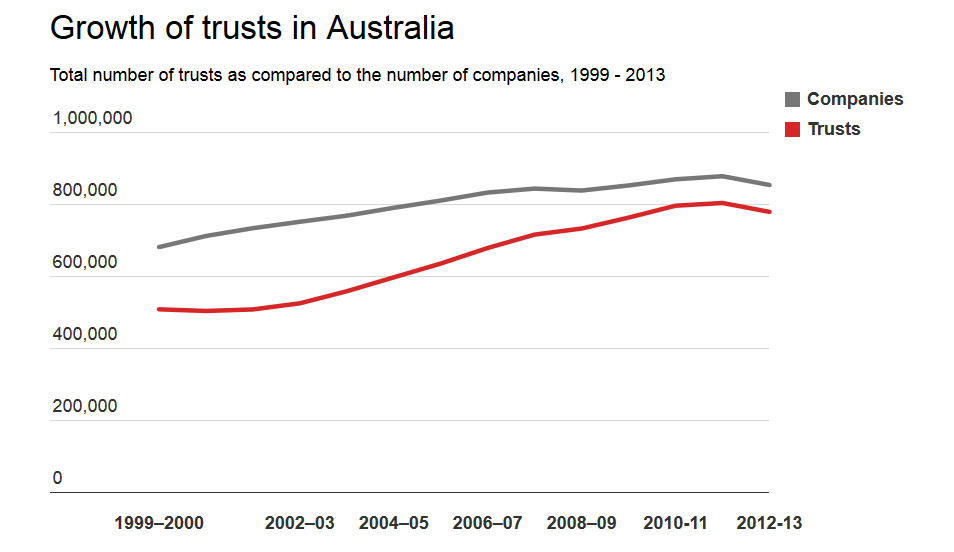
Taxing trusts as if they were companies
In 1999 the Ralph Review of Business Taxation recommended that trusts be taxed as companies, a move that originally got the support of Treasurer Peter Costello. Political pressure soon saw the government back away from this plan, and despite Joe Hockey showing support for the idea back in 2011, it is not one that has the support of the government.
Dale Boccabella says the taxing of trusts is another anomaly in Australia’s tax system that is unfair. Trusts are commonly used by families with a high income to distribute funds to low-earning family members in order to minimise tax.
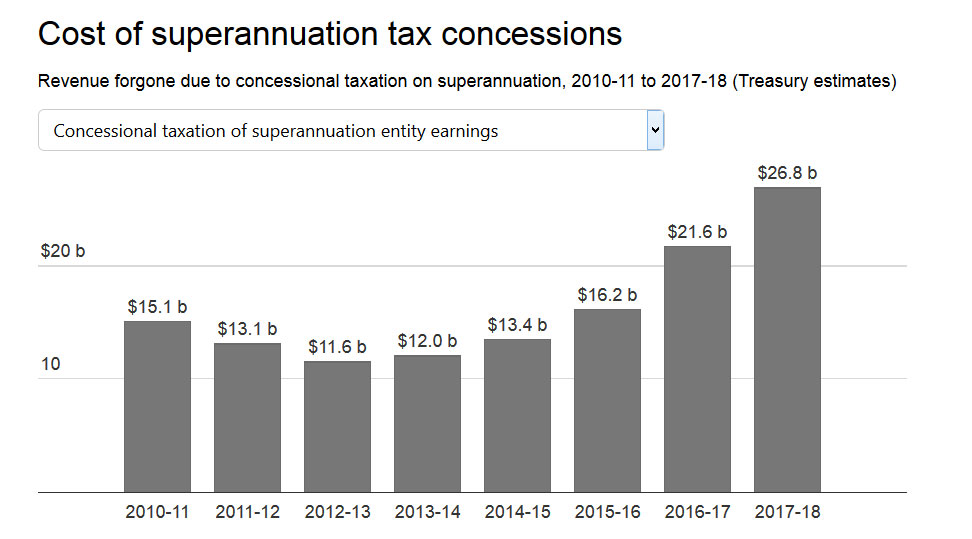
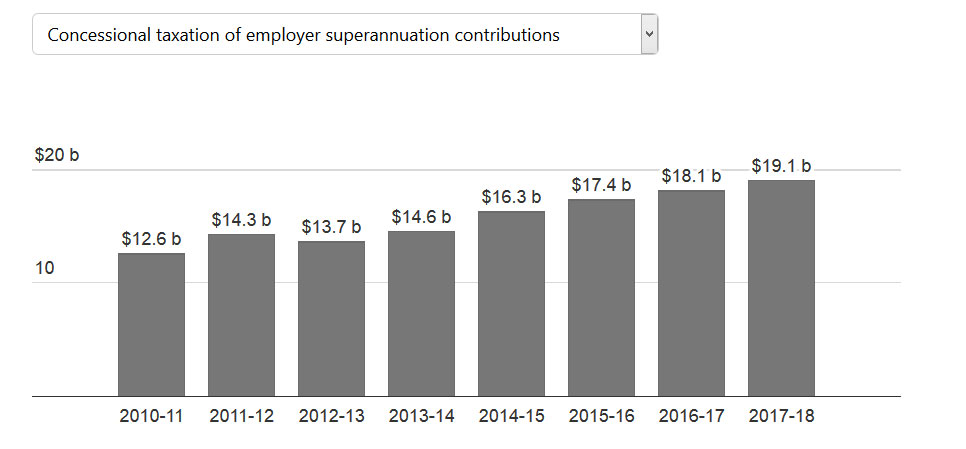
Removing concessions on the taxation of super
Most experts agree superannuation tax concessions are unevenly distributed and are in need of reform.
The Labor Party wants to remove the tax-free concession available to people with annual superannuation incomes from earnings of more than A$75,000, a move it says would raise more than $14 billion over 10 years.
Prime Minister Tony Abbott has ruled out any “adverse changes” to superannuation, including changes to super tax concessions.
Expanding land tax over stamp duty
The Henry tax review argued stamp duties are a highly inefficient tax on land, and that land tax could provide an alternative and more stable source of revenue for the states.
Miranda Stewart says stamp duty is volatile, feeds into house prices (contributing to lack of affordability) and taxes more heavily those people who purchase new housing more often, than those people who don’t.
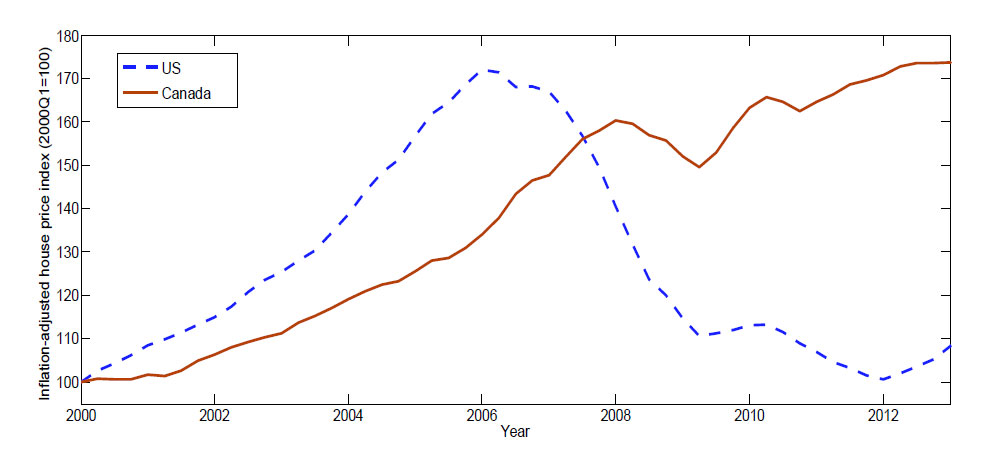
Just released is a Canadian Economic Analysis Department working paper “On the Welfare Cost of Rare Housing Disasters“, which shows that in a significant housing downturn the welfare costs are large and this risk varies considerably across age groups, with a welfare cost as high as 10 percent of annual nonhousing consumption for the old, but near zero for the young. Given the risks to the housing sector in Australia at the moment, this is potentially important and applicable research.
Since the early 2000s, house prices have increased significantly in Canada.This ongoing housing boom has become an important consideration for the conduct of monetary policy and financial regulation, since currently high levels of house prices are potentially increasing the risk of a large housing market correction, which could have an adverse effect on the economy. This paper investigates the likelihood and magnitude of housing market disasters, and the value of limiting this disaster risk for the Canadian economy.
The study will be useful for both economic researchers and policy-makers to better understand the macroeconomic implications of this important market risk. This paper estimates the unconditional probability and the size of housing market disasters using the cross-country housing market experiences of twenty OECD countries.
I find that in a given OECD country, housing market disasters – defined as cumulative peak-to-trough declines in real house prices of 20 percent or more – occur with a probability of 3 percent every year, corresponding to about one disaster occurring every 34 years. A housing disaster on average lasts about 6.4 years, and house price declines range from 25 to 68 percent, with an average decline of 34 percent.
This paper quantifies the welfare impact of the housing disaster risk in an overlapping generations general equilibrium housing model. The analysis yields the following two main findings. First, despite their statistical rarity, the aggregate welfare cost of housing disasters is large, since Canadian households would willingly give up around 5 percent of their non-housing consumption each year to eliminate the housing disaster risk. The sizable welfare cost is due to the large wealth loss during the long-lasting recessions triggered by housing disasters. Second, the welfare evaluation of this risk varies considerably across age groups, with a welfare cost as high as 10 percent of annual nonhousing consumption for the old, but near zero for the young. This asymmetry stems from the fact that, compared to the old, younger households suffer less from house price declines in disaster periods, due to smaller holdings of housing assets, and benefit from being able to buy homes at the resulting lower house prices in normal periods.
The main findings from the model are twofold. First, despite their rarity, the aggregate welfare cost of housing disasters is large, since Canadian households would be willing to give up around 5 percent of their non-housing consumption each year to eliminate the housing disaster risk. Compared to the no-disaster economy, the presence of this disaster risk has two opposite welfare effects on households. On the one hand, due to a wealth effect, a realized housing disaster leads to a long-lasting economic recession. The loss in housing wealth once a disaster occurs reduces the aggregate household savings and thus the capital supply. As a consequence, the interest rate goes up and the fi rm cuts back its investment, leading to declines in wages, output and consumption. On the other hand, due to a substitution effect, a non-trivial disaster probability results in risk-averse householdsresource reallocation from the housing sector to the production sector in normal periods. This lowers both house prices and the interest rate, with declining borrowing costs leading to higher investment, output and consumption. However, due to diminishing marginal utility of consumption, the welfare gain from this resource reallocation in normal periods is dominated by the welfare loss from large recessions triggered by housing disasters, explaining why the society is willing to devote a sizable amount of resources to eliminating this disaster risk.
The second major finding is that the welfare evaluation of the housing disaster risk differs considerably in magnitude across age groups, with a welfare cost as high as 10 percent of annual non-housing consumption for the old, but near zero for the young. This asymmetry is mainly due to the hump-shaped pro le of life-cycle housing consumption, with older households typically holding more housing assets than the young. In disaster periods, declines in house prices favor the young, who purchase houses at depressed prices, but hurt the old, who rely on house sales to finance non-housing consumption. In normal periods, younger households also benefit more than the old from purchasing houses at lower cost, thanks to the resource reallocation from the housing sector to the production sector as discussed above. Therefore, younger households are less averse to the presence of the housing disaster risk than the old.
Note: Bank of Canada working papers are theoretical or empirical works-in-progress on subjects in economics and finance. The views expressed in this paper are those of the author. No responsibility for them should be attributed to the Bank of Canada.

 In the June quarter, the largest rise of all industries (original series) is 0.8 per cent in Financial and insurance services. Rental, hiring and real estate services had the smallest rise of 0.1 per cent.