International Economic Conditions
Members noted that data released over the past month confirmed that growth of Australia’s major trading partners had eased a little in the March quarter and were consistent with around-average growth in the period ahead. Measures of global headline and core inflation rates had remained subdued in April.
Following a moderation in growth in the March quarter, some of the recent Chinese data had been more positive. Growth of industrial production and retail sales had picked up a little and conditions in the property market had improved somewhat, particularly in the larger cities. However, growth of fixed asset investment, particularly in the real estate sector, had eased further. While the production of steel had increased over recent months, its rate of growth remained significantly lower than earlier trends. The Chinese trade data had indicated weakness in both exports and imports in recent months, although imports of Australian iron ore had continued to rise. Members noted that the Chinese authorities had eased a number of policies and announced initiatives intended to support growth.
In Japan, national accounts data for the March quarter showed that economic activity had grown at a moderate pace. Wage growth had increased over the past year and the unemployment rate had declined to its lowest level in almost 20 years. For the remainder of east Asia, GDP had grown slightly below its average pace of recent years in the March quarter and both headline and core inflation had eased. In India, economic conditions had improved over the past year or so.
In the United States, indicators of activity had been mixed, though more positive than suggested by the weak March quarter GDP data, which had largely reflected temporary factors. Labour market conditions had continued to improve and consumption growth had remained relatively strong. Business activity indicators had generally remained positive, though they were a little weaker than late in the preceding year.
Economic conditions in the euro area had continued to improve, but the recovery remained modest and inflation continued to be well below the European Central Bank’s target.
Overall, commodity prices had been little changed since the previous meeting. The prices of coal and base metals had fallen, while the price of iron ore had increased.
Domestic Economic Conditions
Members noted that the March quarter national accounts would be released the day after the meeting. The data available prior to the meeting suggested that GDP growth had been close to average in the quarter, although below average on a year-ended basis. Growth in household consumption for the March quarter was expected to have been around average, while both dwelling investment and resource exports appeared to have been growing strongly. In contrast, business investment was likely to have contracted. There continued to be spare capacity in product and labour markets, despite some improvement in labour market conditions over the past six months or so.
Members observed that the Australian Government Budget for 2015/16 had outlined a number of years of slightly larger deficits than had been forecast in the Mid-Year Economic and Fiscal Outlook update in December 2014. This mainly reflected lower commodity prices and weaker-than-expected growth of incomes. Members were informed that the budget policies were little different from what had been assumed for the forecasts presented in the May Statement on Monetary Policy. Members discussed the importance of including the fiscal positions of the states and territories in any assessment of the effect of fiscal consolidation on the aggregate economy.
Growth of retail sales volumes had been around average in the March quarter. Measures of consumer sentiment had picked up noticeably in May to be a bit above average. Much of this had been attributed to the Australian Government Budget and, in particular, the announcement of tax concessions for small businesses. Liaison suggested that there had been little change in the year-ended growth of the value of retail sales in April and May.
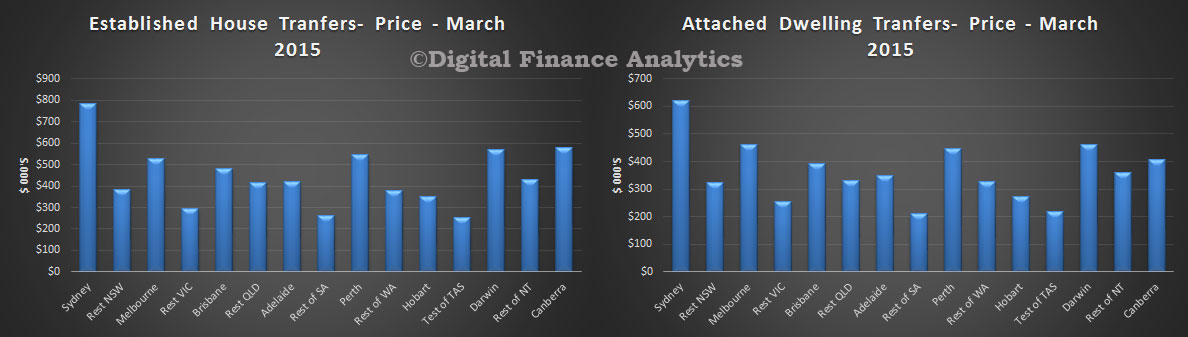
Dwelling investment looked to have grown strongly in the March quarter and forward-looking indicators of construction activity pointed to a further pick-up. Members noted that conditions in the established housing market had continued to vary across the country. Although housing price inflation had remained high in Sydney and, to a lesser extent, in Melbourne over recent months, there had been some divergence in price developments for different segments of these markets; price inflation of detached houses had increased, whereas price inflation for units had eased in both cities. Noting that housing price growth in other cities and regional areas had declined over recent months, members discussed the strength and composition of underlying supply and demand conditions in different parts of the housing market. They also observed that there was a relatively low stock of dwellings for sale in Sydney and Melbourne and that dwellings took only a short time to sell.
Members noted that housing credit growth overall had been broadly steady at around 7 per cent (on a six-month-ended annualised basis), though the latest data on loan approvals had showed a pick-up. Over the past six months or so, growth in investor credit had eased back to be running at an annualised pace of a bit above 10 per cent. However, over more recent months there had been solid increases in housing loan approvals to both owner-occupiers and investors, particularly in New South Wales, following earlier declines.
The available data suggested that private business investment had declined further in the March quarter, consistent with the forecast presented in the May Statement on Monetary Policy. Mining investment appeared to have fallen further, while non-mining investment looked to have been little changed over recent quarters. Members observed that there were diverging trends within the non-mining sector. Investment in some sectors, such as real estate and retail trade, had picked up in response to stronger growth in domestic demand, but investment had continued to fall in other sectors, such as manufacturing, where the rate of investment had been lower than the rate of depreciation in recent years. Members noted that a lower exchange rate would have an immediate beneficial effect on some sectors, such as tourism, but that it would need to be lower for a sustained period to have a significant effect on large investment decisions in other trade-exposed sectors.
Surveys of business conditions remained a bit above their long-run averages in April. In contrast, an economy-wide measure of business confidence had remained below its long-run average level, along with various measures of capacity utilisation. Also, the second reading from the ABS capital expenditure survey of businesses’ investment intentions for 2015/16 implied a fall in non-mining investment.
Trade data suggested that export volumes had increased strongly in the March quarter across most categories, including bulk commodities. Import volumes also appeared to have increased strongly, though capital imports had remained lower than their peak in 2012.
The labour force data continued to suggest that growth in employment and hours worked had been stronger over the past six months or so than the preceding period and the unemployment rate had been relatively stable at around 6¼ per cent. In April, employment had been little changed, the participation rate had ticked down and the unemployment rate had increased slightly to 6.2 per cent. Forward-looking indicators suggested that employment growth would be only modest in the coming months and most measures of job advertisements and vacancies were little changed since mid to late 2014.
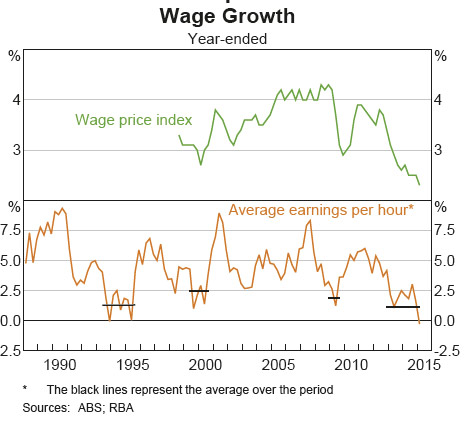
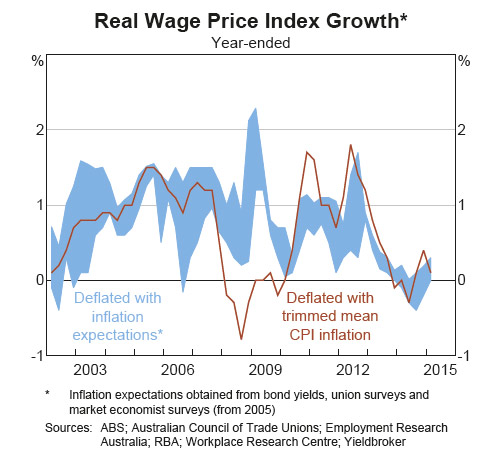
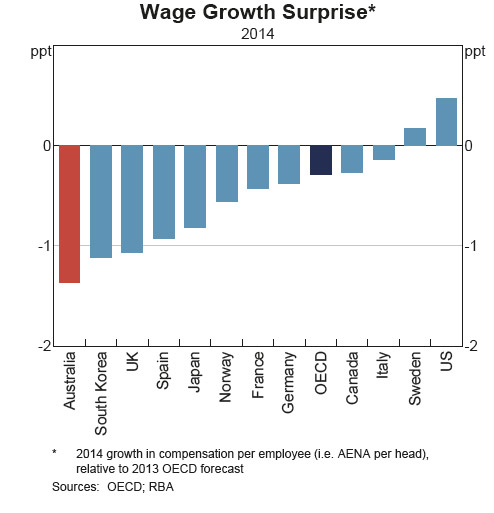
Wage growth had declined a little further in the March quarter and remained lower than suggested by the historical relationship between wage growth and the unemployment rate. The rise in the private sector component of the wage price index had been the lowest outcome for many years (with the exception of the September quarter 2009) and wage growth over the year to March was below its decade average in all industries. Wage growth in the public sector had also remained low, in part because of delayed negotiations over enterprise bargaining agreements. Members considered several possible explanations for the slow growth of wages, including a more flexible labour market, the relatively long period of gradually rising unemployment over recent years and below-average levels of inflation expectations generally.
Financial Markets
Financial markets continued to focus on the current negotiations between Greece and its official sector creditors and the likely timing of interest rate rises in the United States. A sharp rise in 10-year bond yields was the main development across the major financial markets over the past month.
Members noted that the global rise in sovereign bond yields had been led by longer-maturity German Bunds, with those yields rising by as much as 65 basis points after reaching a historic low in mid April. The rise in yields was viewed primarily as a correction from unduly low levels, rather than a reaction to economic developments, and the sell-off only returned yields to their still low levels of late last year.
Longer-term sovereign yields in most other developed countries, including Australia, also rose significantly, while increases in yields on emerging market sovereign debt were generally smaller. Following the release of the Australian Government Budget, the Australian Office of Financial Management announced updated financing requirements for 2015/16, with net issuance of Australian Government Securities expected to be around $40 billion and net debt peaking at around 18 per cent of GDP in 2016/17.
In relation to the continuing negotiations between Greece and its official sector creditors, members observed that sizeable differences remained regarding the most substantive issues, including pensions and labour market reforms. Greece had been able to meet its scheduled payments to the International Monetary Fund (IMF) in May, but Greek officials had cautioned that payments due to the IMF in June would be difficult to make without an agreement being reached with the official sector creditors. Members also noted that, consistent with reports of deposit outflows, Greek banks’ use of emergency liquidity assistance had increased further during April and May.
In the United States, expectations about the timing of the first increase in the federal funds rate had changed little over the past month, with market pricing suggesting it would happen around the end of 2015, even though comments from the Federal Reserve suggested that the first increase would occur a little sooner than that. The People’s Bank of China had moved to ease monetary policy further in May when it announced another reduction in both benchmark lending and deposit rates in response to low inflation and slower growth in economic activity.
Turning to foreign exchange markets, members noted that the US dollar had reversed its recent modest depreciation against most currencies, reaching its highest level against the yen since December 2002. The Chinese renminbi was little changed against the US dollar over the past month, although it had appreciated further on a trade-weighted basis and had been assessed by the IMF as being no longer undervalued. The Australian dollar had depreciated over May to be a little above its trough in early April on a trade-weighted basis.
Equity prices in the major markets had shown little net change since the previous meeting. The broad index for Chinese equities had increased by 2 per cent over the past month, although the index had been volatile. Members also noted the high-profile collapses in the prices of two Hong Kong-listed Chinese companies in mid May. Australian equity prices had underperformed the major markets over May.
Pass-through of the reduction in the Australian cash rate target in May to lending and deposit rates had varied across domestic financial institutions and products. At the same time, a number of banks were reported to have tightened conditions on new loans to property investors and imposed restrictions on the extent of interest rate discounts. Members noted that it would take some time for the full effects of such changes to be evident in the housing loan approvals and credit data.
Market pricing indicated that the cash rate target was expected to remain unchanged at the present meeting.
Considerations for Monetary Policy
Members noted that information becoming available over the past month had not led to any material change to the global outlook, which was for growth of Australia’s major trading partners to be around average over the period ahead. After somewhat weaker-than-expected economic conditions in China earlier in the year, the authorities had eased a range of policies and announced initiatives to support growth, and some of the recent data had been slightly more positive. The Federal Reserve was expected to begin the process of raising its policy interest rate later this year, but some other major central banks were continuing to ease policy. Commodity prices had been mixed over the month and little changed overall, and were significantly lower than a year earlier.
Domestically, the available data suggested that output growth had continued at a below-trend pace over the past year and would remain a little below trend in the period ahead before picking up to around trend in the latter part of 2016. The national accounts data for the March quarter were expected to show that the key forces operating on the economy were much as they had been for some time. After picking up late last year, growth of household expenditure was expected to have remained strong, supported by low interest rates and strong population growth. Conditions in the housing market in Sydney and parts of Melbourne had remained very strong, though trends were more mixed in other cities. Survey-based measures of business conditions had remained around average levels. There continued to be spare capacity in labour and product markets, although there had been some improvement in labour market conditions over the past six months or so. Inflationary pressures remained well contained and were likely to remain so in the period ahead.
The exchange rate was close to the lowest levels seen earlier in the year, but members noted that the current level of the exchange rate, particularly on a trade-weighted basis, continued to offer less assistance than would normally be expected in achieving balanced growth in the economy. A further depreciation therefore seemed both likely and necessary, particularly given the significant declines in commodity prices over the past year.
Overall, in assessing domestic conditions and the international environment, the Board’s assessment was that the stance of monetary policy should be accommodative. Having eased policy at the previous meeting, members judged that it was appropriate to leave the cash rate unchanged and to assess information on economic and financial conditions as it became available. These data would inform the Board’s assessment of the state of the economy and the outlook and hence whether the current stance of policy would most effectively foster sustainable growth and inflation consistent with the target.
The Decision
The Board decided to leave the cash rate unchanged at 2.0 per cent.

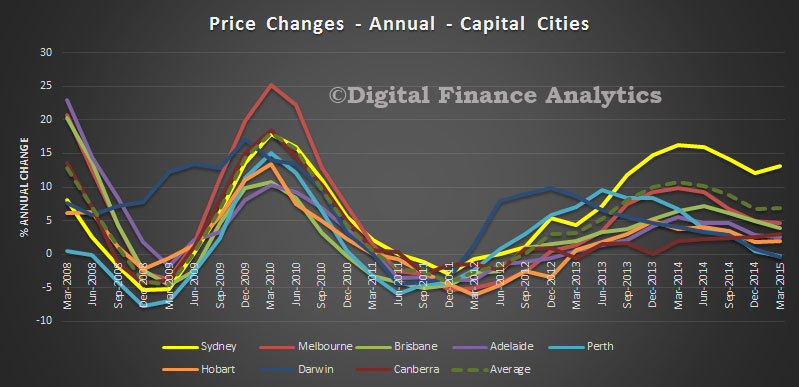 We see how Sydney steamed ahead of other states in the last quarter.
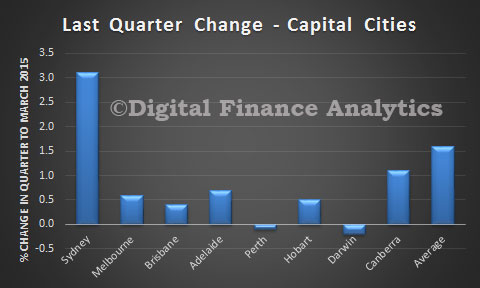 We also see significant differences between the relative price of established houses and attached dwellings in Sydney compared with other centres, the rest of the states outside the capital cities.