The GDP Per Capita Conundrum

We had the latest national accounts to end of December 2019 this week. The ABS advised that:

The Australian economy grew 0.5 per cent in seasonally adjusted chain volume terms in the December quarter 2019 and 2.2 per cent through the year, according to figures released by the Australian Bureau of Statistics (ABS).

Chief Economist for the ABS, Bruce Hockman, said: “The economy has continued to grow and picked up through the year, however the rate of growth remains below the long run average.”

Domestic demand remained subdued with 0.1 per cent growth in the December quarter. A pick up in household discretionary spending and continued increases in the provision of government services was dampened by falls in dwelling and private business investment.

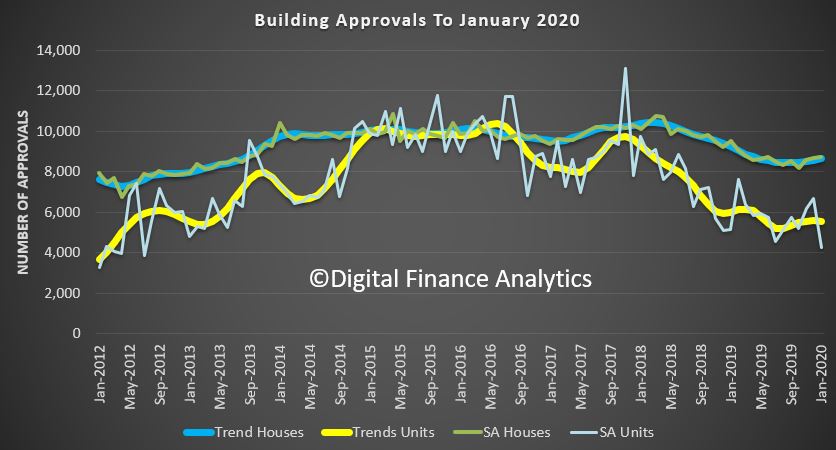
Falls in dwelling investment continued, declining 3.4 per cent during the quarter, the sixth consecutive fall. This fall was consistent with the decline in construction industry value added, falling 2.3 per cent. The housing market recovery is evident in the increase in ownership transfer costs, rising 12.3 per cent during the quarter to be up 6.5 per cent through the year.

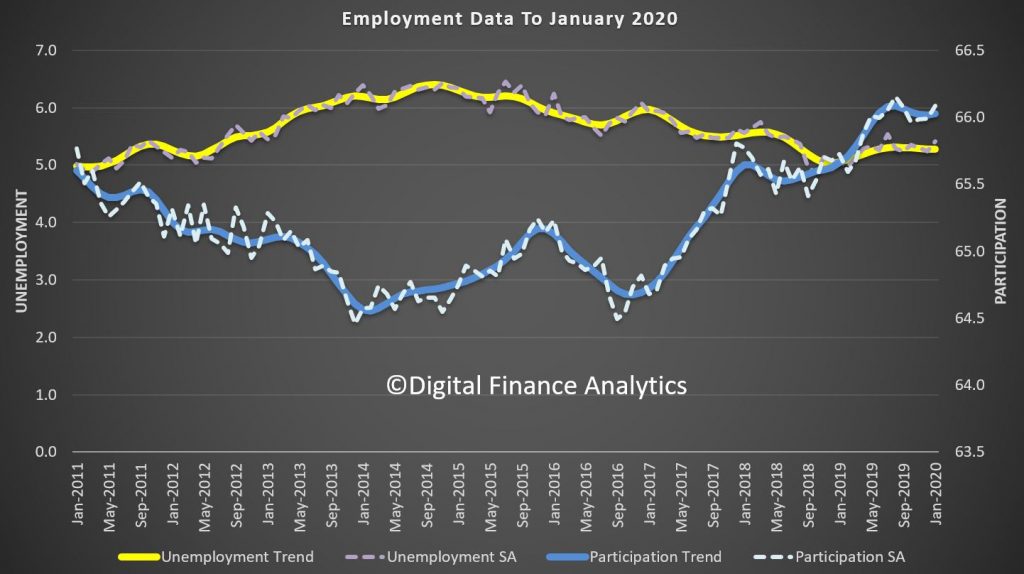
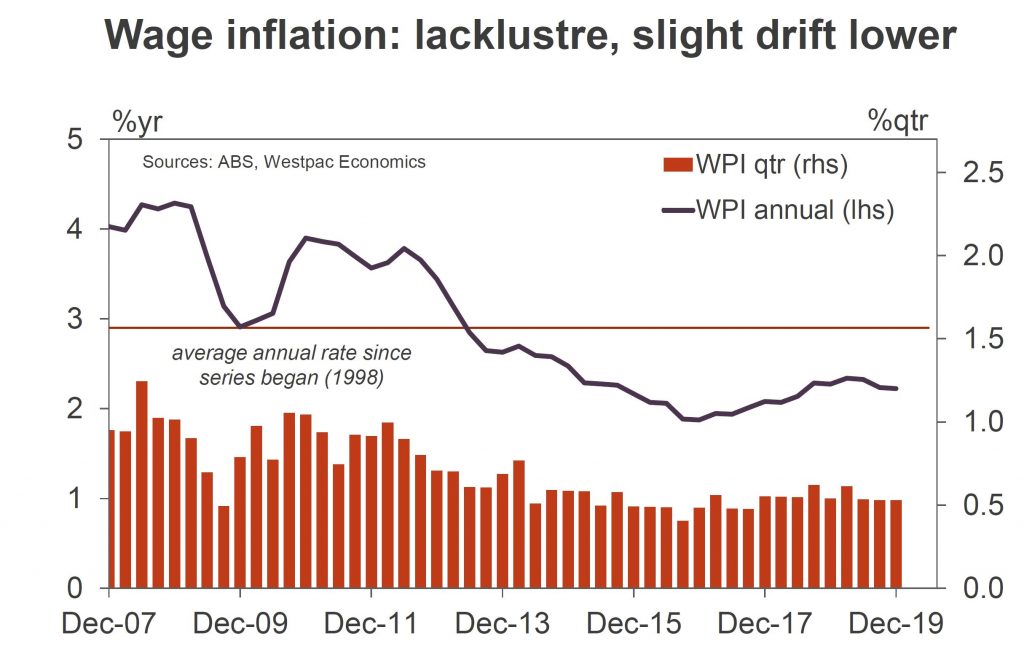
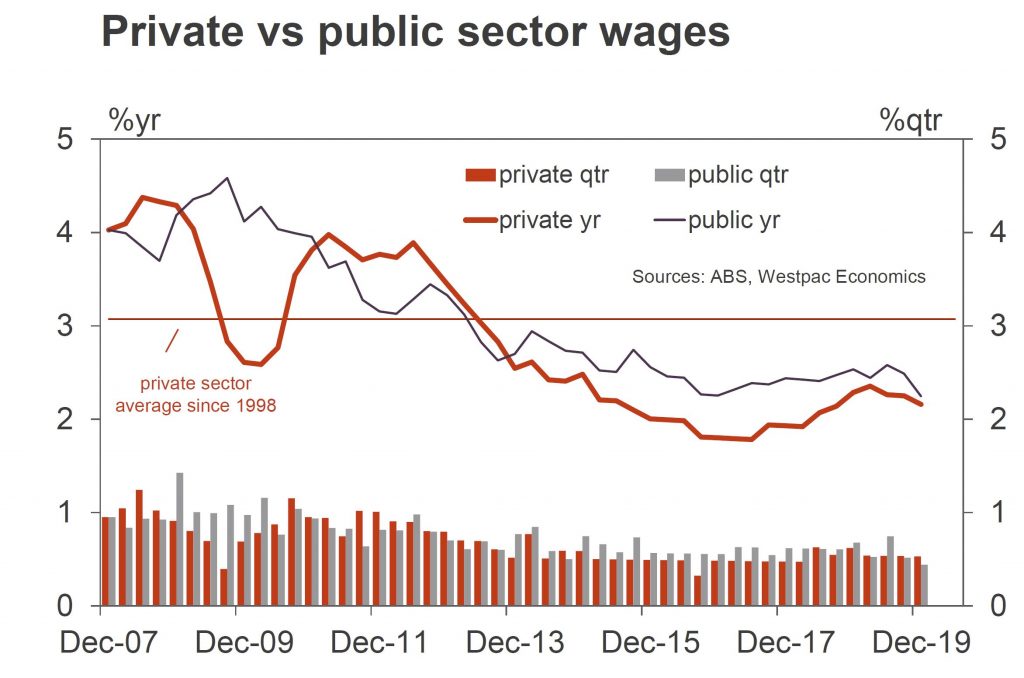
Household income remained steady with compensation of employees recording its twelfth consecutive rise, increasing 1.0 per cent during the quarter. This reflects a rise in the number of wage and salary earners as well as a steady increase in the wage rate. Non-life insurance claims contributed to household income reflecting increased claims attributed to natural disaster occurrences in the quarter. The household saving to income ratio was 3.6 per cent, driven by the subdued consumption coupled with steady increases in wages and a boost in insurance claims.

The Mining industry provided additional strength to the economy, with growth in production volumes of 1.6 per cent, strengthening through the year to 7.3 per cent. This was reflected in the growth in mining exports and inventories.

Falling prices for key export commodities impacted the terms of trade in the December quarter, which fell 5.3 per cent. This reduced nominal GDP, which fell 0.3 per cent, as lower coal, iron ore and gas prices contributed to more subdued company profits. Mining profits declined 2.6 per cent for the quarter.

Real net national disposable income declined 0.9 per cent. “Fluctuations in commodity prices have significant effects on the Australian economy in terms of export revenues and real income,” added Mr Hockman.

But the real question is, does the GDP really tell us anything useful? I discuss the GDP question with American in OZ Salvatore Babones, Associate Professor, University of Sydney.

Support package gains shape as GDP turning point swamped

The good news is our economy was performing better than had been thought in the lead-up to the bushfires and coronavirus. Via The Conversation.

Updated figures in Wednesday’s national accounts show the economy grew 0.6% in the three months to September, rather than the 0.4% previously reported, and a healthier-than-expected 0.5% in the three months to December.

Combined, these figures pushed annual economic growth up above 2% to 2.2% for the first time in a year in which it had been below 2% for the longest period since the global financial crisis.

Annual GDP growth

Through-the-year economic growth by quarter. Source: ABS 5206.0

Not to put too fine a point on it, it looks as if we were actually experiencing the the “gentle turning point” repeatedly promised by Reserve Bank Governor Philip Lowe.

As Lowe put it during the second half of last year:

After having been through a soft patch, a gentle turning point has been reached. While we are not expecting a return to strong economic growth in the near term, we are expecting growth to pick up.

The figures show the economy began (gently) picking up after the Reserve Bank began cutting rates in June. Counting this week’s latest interest rate cut, it has cut four times.

But the coronavirus and the bushfires have consigned the turning point to history.

Negative growth now possible

Not for a minute does Treasurer Josh Frydenberg believe the economy continued to improve this quarter, the March quarter.

Reminded that the support package promised by the prime minister will come too late for the three months to March, and reminded that many businesses haren’t been able to trade much, Frydenberg was asked to assess the risk the economy might now be going backwards, a state of affairs that if it continued long enough would be a recession.

He replied that the Treasury believes the bushfires alone will shave 0.2 points from growth in the March quarter. Added to that will be the risk from the spread of the coronavirus, which he believes will be “substantial”.

Tonight (Wednesday) Frydenberg and Treasury officials will take part in a phone hookup with other members of the International Monetary Fund to discuss developments including interest rate cuts in both Australia and the United States.

Treasury update on Thursday

The Treasury will finalise its estimate of the impact of the coronavirus on March-quarter GDP later in the evening and report it to a Senate estimates hearing beginning at 9am Thursday.

It means we will know the likely impact at about the same time as the treasurer.

To support retirees hurt by four near-consecutive rate cuts, the treasurer is considering cutting the deeming rate – the rate investments are deemed to have earned for the purposes of the pension income test. It’ll be the second deeming rate cut in the space of a year and will make it easier for retirees earning very little to remain on the pension.

The focus of the support package will business investment, which slid an unexpected 1.1% in the final three months of the year and 3.4% over the course of the year in defiance of budget forecasts it would climb.

Standard of living slipping

Although not ruling out support for householders, Frydenberg said mortgage holders had done well out of the past four rate cuts. Households with A$400,000 mortgages could soon be paying $3,000 less per year than they had in June.

Living standards, as measured by the Reserve Bank’s preferred measure, real net national disposable income per capita, went backwards in the December quarter, slipping 1.3%. Over the year, it climbed just 1.2%.

Household spending recovered somewhat, climbing 0.4% in real terms in the December quarter after inching ahead only 0.1% in the September quarter.

Throughout the year to December, real household spending grew 1.2% at a time when Australia’s population grew 1.5%. This means the consumption of goods and services per person went backwards.

Government spending provided substantial support. Over the year to December public spending on infrastructure grew 4.1% in real terms.

Deputy Prime Minister Michael McCormack said on Wednesday he would try and boost that by asking state and local governments to bring forward whatever projects they could, to start work in the next three to six months.

Recurrent government spending grew 5%.

Author: Peter Martin, Visiting Fellow, Crawford School of Public Policy, Australian National University

Dwelling Approvals Moderate in January

The number of dwellings approved rose 0.5 per cent in January, in trend terms, according to data released by the Australian Bureau of Statistics (ABS) today.

The data is weaker than many was expecting, but we suspect that’s a direct impact of slowing of high-rise approvals, especially in Victoria, and perhaps the bushfires. The one-offs we saw at the end of last year, were exactly that.

ABS Director of Construction Statistics, Daniel Rossi, said: “The rise was driven by private sector houses, which rose 0.8 per cent, in trend terms.

“Meanwhile, private sector dwellings excluding houses fell 0.1 per cent. A significant fall in the number of apartments approved in January has offset the strength recorded in late 2019.”

Across the states and territories, dwelling approvals rose in Australian Capital Territory (7.3 per cent), Victoria (2.8 per cent) and Northern Territory (2.7 per cent). Falls were recorded in Tasmania (3.7 per cent), South Australia (3.4 per cent), Western Australia (2.0 per cent), New South Wales (0.8 per cent) and Queensland (0.7 per cent), in trend terms.

Approvals for private sector houses increased in Victoria (2.6 per cent), Western Australia (2.0 per cent), Queensland (0.6 per cent) and South Australia (0.4 per cent). Private house approvals in New South Wales fell 2.1 per cent, in trend terms.

The seasonally adjusted estimate for total dwellings approved fell 15.3 per cent in January, driven by a 35.5 per cent decrease in private dwellings excluding houses. This was largely due to weakness in approvals for apartments (which is volatile from month-to-month), especially in Victoria.

The value of total building approved rose 0.3 per cent in January, in trend terms, after falling for six months. The value of residential building rose 0.1 per cent, while non-residential building increased 0.4 per cent.

Staring Down The Barrel of a Technical Recession

This week marks a new phase in the coronavirus crisis with the case count outside China accelerating sharply. Via The Conversation.

China’s containment strategy bought global health authorities time to prepare, but failed to confine the outbreak to North-East Asia.

In the past week both President Trump and Prime Minister Morrison have prepared citizens for a rise in the onshore case count in recognition of the likelihood the virus will spread to most of the world.

Because it isn’t possible to shut down the global trade and transport system without causing a global recession, their strategy has shifted from containment to preparation.

It’ll be important to manage panic

Critical to the process is managing panic. If consumers around the world substantially reduce their spending either as a precautionary measure or in response to public health fears, the impact on businesses will be substantial.

The key economic challenge will be to stop a vicious cycle of weaker spending and job losses taking hold. Targeted government spending can help businesses at risk, although some will use it as an excuse to reset their cost base and scale down in an economic environment that was challenging even before the coronavirus.

Global share markets have fallen 10% in a week as this new phase has begun to unfold, adding to uncertainty and fear.

Rate cuts are all but certain

Countries that have the capacity to cut interest rates will do it. In the US, markets are expecting a cut at or before the next meeting of the US Fed on March 17.

In Australia, markets are expecting a cut of 0.25 points at the Reserve Bank’s board meeting on Tuesday. There is some talk of a double cut, of 0.50 points, which would bring the Reserve Bank cash rate down from 0.75% to 0.25%.

The cuts would be aimed at shoring up confidence in the economy and financial markets as much as anything else. Global rates are already low enough to provide economic stimulus. It will be up to politicians to provide the targeted measures that will be needed to help keep businesses afloat and people in jobs.

We’re facing a Chinese recession

The trade and travel restrictions in place in and around China will have major ramifications. Estimates of the impact of the containment policies on Chinese growth in the first quarter of the year range from minus 2% to minus 10%, enough to obliterate growth in the world’s fastest-growing big economy.

A shocking Chinese purchasing managers’ index reading on the weekend showed a fall to a new low not reached during the global financial crisis.

Few countries are as exposed to Chinese purchasing as Australia.

Australia gets GDP figures on Wednesday for the final three months of 2019. These are likely to show the economy grew by less than 0.5% in the quarter.

Most of the impact of the bushfires and the initial impact of the coronavirus will show up in the data for the first quarter of this year. Many analysts have pencilled in a negative number.

And possibly an Australian recession

It will leave Australia exposed to what is known as a technical recession – two consecutive quarters of negative economic growth, in the three months to March and the three months to June.

This possibility, Australia’s first recession in 29 years, will depend on how we react to the emergence of coronavirus onshore.

The initial reaction might paradoxically support measured economic growth as people stockpile supplies. The next phase would be a reduction in spending as people avoid leaving their homes. As we are seeing in China, and more recently in Korea and Italy, shopping districts can become ghost towns.

It would be akin to a nationwide rise in saving, which drains consumer spending and business activity. Beyond efforts to maintain perspective and keep calm, little can be done to prevent people from willingly choosing to remain at home.

We’ll need targeted, clever, government support

It is in this phase that government policy actions will be critical. A mild technical recession caused by an external shock would be undesirable but need not be a disaster for the community if the employment ramifications can be minimised.

Government efforts need to be directed at stopping a negative shock evolving into a self-reinforcing spiral of declining spending and lower employment.

Lower interest rates will be of very little use to start with. Governments will need to target support to those parts of the economy most under stress with the greatest risk of job losses.

The challenge will be to identify those businesses at the greatest risk of insolvency.

The Reserve Bank board will need to follow the lead of the US Federal Reserve and at least issue a soothing statement to financial markets that it is ready to act if needed.

If it is too early to gauge the impact of this new phase of contagion of the coronavirus, it is really too early for rate cuts. And there is a risk that a rate cut this week might generate more panic and amplify the effects of any consumer and business panic already upon us.

At most, the bank can support the government. It is our leaders who will bear the biggest responsibility for steering us through what’s to come.

Author: Warren Hogan, Industry Professor, University of Technology Sydney

PMI Falls in February

More evidence of a weakening economy today with the latest Performance of Manufacturing Index (PMI) read for Australia showing a further decline in February.

The Australian Industry Group Australian Performance of Manufacturing Index fell a further 1.1 points to 44.3 points in February. This marked four consecutive months of contraction in Australian manufacturing for the first time since 2014 and was the lowest monthly result in almost five years(seasonally adjusted).

Results below 50 points indicate contraction with lower results indicating a faster contraction in the month. The indices for all manufacturing sectors deteriorated in February and all except food&beverages recorded a contraction in the month (results under 50 points, trend). The production, sales, new orders and exports indices fell further into contraction in February and were firmly negative.

This was the first month in which respondents to the Australian PMI reported the effects of the new coronavirus ‘COVID-19’.

Respondents said that travel restrictions in response to COVID-19 are already denting exports of Australian manufactured goods, particularly consumable items into China. The ‘heavy’ manufacturing sectors (equipment, machinery, metals) reported supply chain disruptions due to factory and freight closures in China.

Locally, respondents remain concerned about drought, weak demand from the construction sector and the generally slow pace of the economy.

Despite weak new orders and production, the employment index improved in February to be broadly stable (and above its own long-run average).

Looking ahead, the new orders index in the Australian PMI plunged to its lowest level since July 2013. This suggests a very sharp deterioration in new orders and even weaker demand conditions ahead for manufacturers

The Australian Industry Group Australian Performance of Manufacturing Index is a national composite index based on the diffusion indices for production, new orders, deliveries, inventories and employment with varying weights. An Australian PMI reading above 50 points indicates that manufacturing is generally expanding; below 50, that it is declining. The distance from 50 indicates the strength of the expansion or decline.

Australian PMI results are based on responses from a national sample of manufacturers. The Australian PMI uses the ANZSIC industry classifications for manufacturing sectors and sector weights derived from ABS industry output data. Seasonal adjustment and trend calculations follow ABS methodology.

China’s Upcoming Recession

Salvatore Babones, Adjunct Scholar at the Centre for Independent Studies, and Associate Professor University of Sydney joins me to discuss the latest indicators relating to China, as the current crisis plays out.

His latest observations were featured in the prestigious American The Center for the National Interest

Australia’s Economic Fuse Is Burning!

The education sector in Australia is highly leveraged towards China.

As a result of the current travel ban their finances are at risk. So they are finding ways around the ban, with the approval of the Government, who is trading off public health against economics. In other words, our health is being put at risk.

I discuss this troubling episode with Salvatore Babones, Adjunct Scholar at the Centre for Independent Studies, and Associate Professor University of Sydney.

Trend unemployment rate remains steady at 5.2%

Interesting test today, as according to the latest ABS figures on unemployment trend stayed at 5.2%, but seasonally adjusted rose 0.2% to 5.3%. Who will report what (many were keen to highlight the recent falls in SA terms, will the reverse be true too?). We continue to prefer the more reliable trend series. Note too the incoming rotation group had a higher unemployment rate than the group it replaced. So, how much is real and how much noise? Still whatever, on these numbers you can forget wages growth. And this is before the China freeze really hit!

Employment and hours

In January 2020, trend monthly employment increased by around 20,000 people. Full-time employment increased by around 15,000 and part-time employment increased by around 5,000 people.

Over the past year, trend employment increased by around 257,000 people (2.0 per cent), in line with the average annual growth over the past 20 years (2.0 per cent).

Year on Year Employment Change Over 20 Years (%)

Full-time employment growth (1.7 per cent) was above the average annual growth over the past 20 years (1.6 per cent) and part-time employment growth (2.8 per cent) was below the average annual growth over the past 20 years (3.0 per cent).

The trend monthly hours worked increased by less than 0.1 per cent in January 2020 and by 1.3 per cent over the past year. This was lower than the 20 year average annual growth of 1.6 per cent.

Underemployment and underutilisation

The trend monthly underemployment rate remained steady at 8.5 per cent in January 2020, and increased by 0.2 percentage points over the past year.

“The underemployment rate continues to remain high, but is still below the levels from 2016-17,” said Mr Hockman.

The trend monthly underutilisation rate also remained steady at 13.7 per cent in January 2020, an increase of 0.4 percentage points over the past year.

States and territories trend unemployment rate

The monthly trend unemployment rate increased in Victoria and decreased in South Australia and Tasmania in January 2020. The unemployment rate remained steady in all other states and territories.

Over the year, unemployment rates fell in Western Australia, Tasmania and the Australian Capital Territory. Unemployment rates increased in New South Wales, Victoria, Queensland, and the Northern Territory.

Seasonally adjusted data


The seasonally adjusted unemployment rate increased by 0.2 percentage points to 5.3 per cent in January 2020, while the underemployment rate increased 0.3 percentage points to 8.6 per cent. The seasonally adjusted participation rate increased by 0.1 percentage points to 66.1 per cent, and the number of people employed increased by around 14,000.

The net movement of employed in both trend and seasonally adjusted terms is generally underpinned by over 300,000 people leaving employment and around 300,000 people entering employment in the month.

In original terms, the incoming rotation group in January 2020 had a lower employment to population ratio than the group it replaced (62.0% in January 2020, compared to 64.2% in December 2019), and was higher than the sample as a whole (61.8%). The incoming rotation group had a lower full-time employment to population ratio than the group it replaced (43.2% in January 2020, compared to 44.5% in December 2019), and was higher than the sample as a whole (42.7%).

The incoming rotation group had a higher unemployment rate than the group it replaced (5.8% in January 2020, compared to 4.0% in December 2019), and was higher than the sample as a whole (5.7%). The incoming rotation group had a lower participation rate than the group it replaced (65.8% in January 2020, compared to 66.9% in December 2019), and was higher than the sample as a whole (65.6%).

Aussie continues to drift lower after the news….

Wages rose 0.5% in the December quarter 2019

The seasonally adjusted Wage Price Index (WPI) rose 0.5 per cent in the December quarter 2019 and 2.2 per cent through the year, according to figures released today by the Australian Bureau of Statistics (ABS).

ABS Chief Economist, Bruce Hockman stated “The seasonally adjusted quarterly rise of 0.5 per cent extended the period of moderate growth observed throughout 2019, and was influenced by the relative stability of the labour underutilisation rate. Annually, both private and public sector wages rose 2.2 per cent; this was the lowest public sector growth rate since the commencement of the index in December quarter 1997.”

For the first time since 2012, private sector wages grew at a faster rate than the public sector (0.5 compared to 0.4 per cent), in original terms.

Across industries, annual wage growth in 2019 ranged from 1.6 per cent for the information media and telecommunication services industry to 3.1 per cent for the health care and social assistance industry.

Victoria recorded the highest through the year growth of 2.7 per cent, while Western Australia recorded the lowest for the sixth consecutive quarter (1.7 per cent)