The health of banks is important to everyone, whether a borrower or a saver, an individual or a business. Subject to certain restrictions, bank deposits up to $250,000 are insured by the Federal Deposit Insurance Corp. The agency’s deposit insurance fund is financed by banks through fees. For catastrophic events, the fund is further supported by a $100 billion line of credit at the Treasury Department, meaning that taxpayers serve as the ultimate backstop in the event of a crisis.1
Because of the government safety net and in support of financial stability, bank supervisors monitor the health of banks through periodic examinations. At the conclusion of its exam, each bank is assigned a rating—called CAMELS—that allows comparisons of bank health over time and with peers.
CAMELS as a Health Monitor
CAMELS is an acronym representing its six components:
Capital adequacy
Asset quality
Management
Earnings
Liquidity
Sensitivity to market risk
Banks are rated on each component, and a composite rating is also computed. Ratings range from one to five:
1 is “strong.”
2 is “satisfactory.”
3 is “less than satisfactory.”
4 is “deficient.”
5 is “critically deficient.”
To earn a 1 on any component, a bank must show the strongest performance and risk management practices in that area. Alternatively, a rating of 5 indicates weak performance, inadequate risk management practices and the highest degree of supervisory concern.
The overall, or composite, rating for each bank is based on the six components. However, it is not an arithmetic average of the individual component ratings. Rather, some components are weighed more heavily than others based on examiner judgment of risk.
For community banks, the asset quality rating is critical because of the size of the loan portfolio at small banks. We’ll take a deeper dive into asset quality and the other individual components of CAMELS in upcoming posts.
Who Sees the Rating?
At the conclusion of each examination, the bank’s rating is revealed to senior bank management and the board of directors. If the rating is 3, 4 or 5, the board is typically required to enter into an agreement with bank supervisors to correct the issues. The most serious deficiencies can result in formal supervisory actions that can be enforced in court.
Each bank’s CAMELS ratings and examination report are confidential and may not be shared with the public, even on a lagged basis. In fact, it is a violation of federal law to disclose CAMELS ratings to unauthorized individuals.2 Outsiders may monitor bank health through private-sector firms that use publicly available financial data to produce their own analysis of bank health, sometimes even using their own rating system.
Notes and References
1 The FDIC may borrow money from the U.S. Treasury, the Federal Financing Bank and individual banks to replenish the fund on a temporary basis. See the FDIC’s Federal Deposit Insurance Act page for more information.
2 Violators may be assessed criminal penalties under 18 USC §641.
The big banks are under increasing pressure to move interest rates as more lenders make changes in response to increased costs.
Over the last week ten institutions have changed their interest rates to home loan products, with a total of 53 product level changes recorded.
While we have seen a number of rate increases over the last few weeks, despite the Reserve Bank of Australia (RBA) holding the cash rate, not all of the changes have been increases.
According to the information from comparison site Canstar, Yellow Brick Road made changes to all home loan types.
Mortgage House dropped its fixed rate investment products by 61 to 72 bps. It also made some changes to its owner occupier fixed rate products with interest rate decreases of 8 to 26bps.
Westpac also made changes this week. It increased its owner occupier fixed rate interest only home loans by 5 to 15bp.
Suncorp also made changes to its fixed rate products, decreasing the rates of its investment loans by 10 to 40bps.
Explaining the changes in interest rates, Steve Mickenbecker, group executive, financial services, at Canstar, said, “We are seeing a classic bit of churn that tends to happen at the top or bottom of a market.
“It has only just started in the last month or two, and we’re quite a while from seeing the end of it. The upward pressure is mounting, and at the same time the banks want to hold some competitive rates in the market.
“With LIBOR and BBSW up 40 basis points in a month, it’s not surprising that we are seeing rate increases.
“The cost of wholesale funding is rising, which ultimately has to find its way through to home loan rates. At this stage it is the second-tier banks that have increased their variable rates by 8 to 10 basis points, not the big banks.
“The funding pressure sees some fixed rates rising, while other banks have moved down to maintain a competitive rate in the market for new business as they have increased their variable rates across the book for both the existing and new.”
While so far it has been the ‘second-tier’ banks changing variable rates, Mickenbecker said “big banks are under even more pressure”.
He added, “With around 80% of existing loans provided by the big four and the bulk in variable rates, any move in variable rates is going to flow through to most Australian borrowers.
“In the political world of banks through this Royal Commission, an increase is going to only increase the opprobrium. Westpac has moved interest only fixed rates up, reflecting that even the big lenders are feeling the funding pressure.
“But in terms of margin across the Westpac portfolio, the increase will hardly make a difference. With most big banks funding around 60 to 65% of their loan book through retail deposits, they have some buffer from wholesale funding increases.
“However, sooner or later they will have to move variable rates up. The timing might come down to when they feel they can face down the community.”
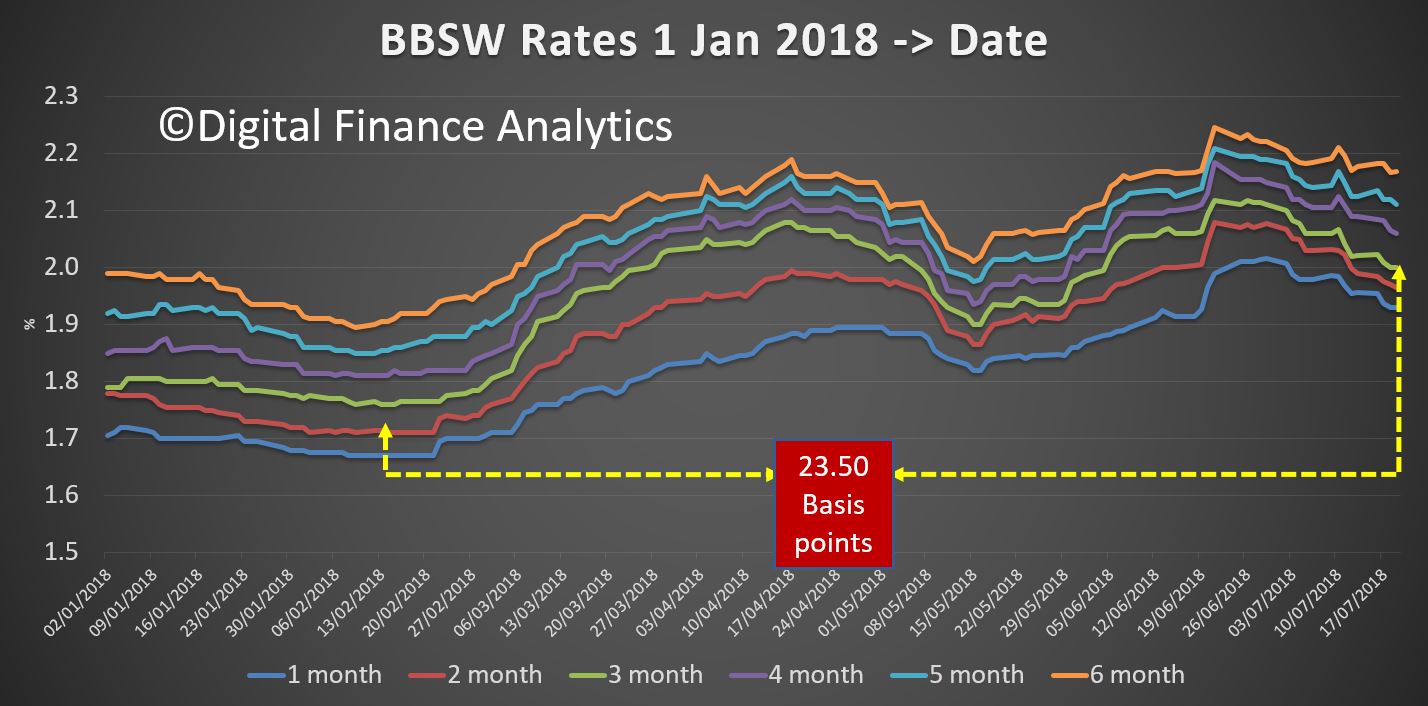
We track the movement in the Bank Bill Swap Rate, as this directly, or indirectly impacts Australian bank funding costs, and of course has led to significant numbers of smaller banks repricing their mortgage books higher in recent weeks.
The latest data shows that last week the 3 month benchmark fell very slightly, leaving funding costs 23.50 basis points higher than the lows in February.
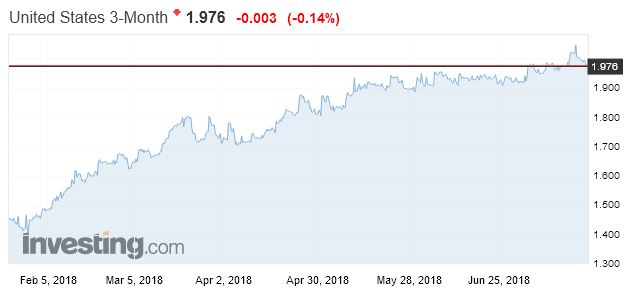
This mirrors recent changes in the US 3-Month rate which is also slightly lower, but we also note that locally some overseas investors are repatriating money back to the US (encouraged by recent tax changes) and perceived elevated risks in the banking system here, relative to the USA.
The main force at work which may still lift mortgage portfolio rates higher is the aggressive attractor rates now available from several of the major banks as they fight to write the lions share of smaller loan volumes. Our surveys suggest that lower risk owner occupiers and investors can wrangle some really cheap rates at the moment. But this puts more pressure on margins and the back book.
At some point the funding pressure dam will burst….
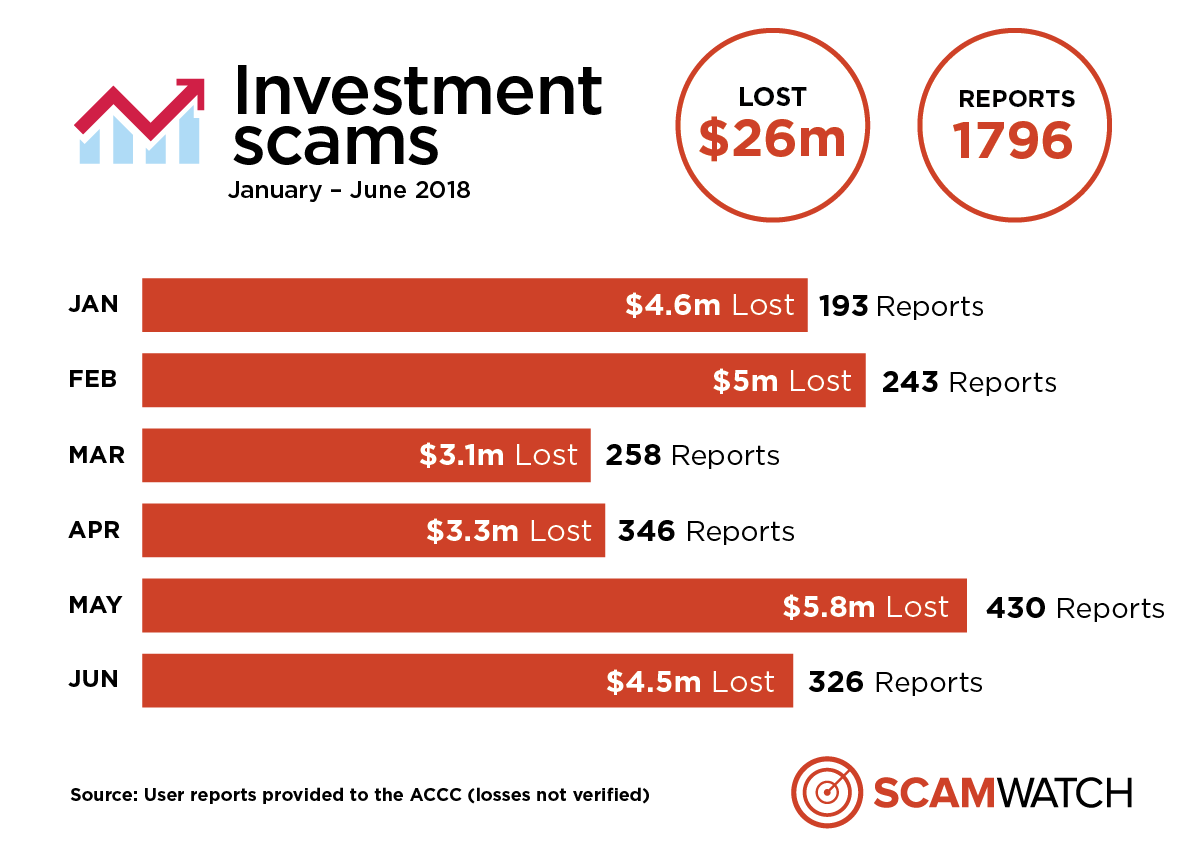
Scamwatch is warning the Australian community to be wary about investment scams, with statistics revealing Australians are collectively losing $4.3 million a month to these scams.
In 2018, more than $26 million has been reported lost to investment scams—already 84 per cent of the total losses recorded in 2017. This represents an average month on month increase in losses of 117 per cent compared to last year.
“The losses to investment scams are horrific. Each week the ACCC receives heartbreaking accounts of people losing hundreds of thousands, and in some cases millions, of dollars,” ACCC Deputy Chair Delia Rickard said.
“Last year, Australians reported they lost $64.6 million to investment scams to Scamwatch and the Australian Cybercrime Online Reporting Network (ACORN). If the current trend continues, combined losses reported to Scamwatch and ACORN in 2018 could be in excess of $100 million.”
“These scams are very sophisticated and the scammers are very convincing. People aged 45–64 are most at risk and make up more than half the reports sent to Scamwatch,” Ms Rickard said.
The vast majority of investment scams are still centred on traditional investment markets like stocks, real estate or commodities. For example, scammers will cold call victims claiming to be a stock broker or investment portfolio manager and offer a ‘hot tip’ or inside information on a stock or asset that is supposedly about to go up significantly in value. They will claim what they are offering is low-risk and will provide quick and high returns.
“Scammers will spend significant time and effort grooming their victims to invest. They will use the right technical language and also offer professional looking websites and documents to convince victims they are legitimate. It’s often only when people try to cash out their investment that they realise their money is gone,” Ms Rickard said.
Two other types of investments where scams are prevalent are cryptocurrency trading and binary options. Cryptocurrency trading scams have grown significantly in the past 12 months and are now the second most common type of investment scam offer pushed on victims.
“The rise in popularity in cryptocurrency trading has not been missed by scammers who are latching onto this new trend to con people. These are similar to any other investment scam: the scammer will claim to have inside knowledge about price movements they will use to make you a fortune. If you invest, your money will quickly disappear,” Ms Rickard said.
“Binary options trading involves scammers pretending they can predict the movements of a commodity, asset or index prices over a short time. They direct you to a website with a login, account details and a trading platform. They appear to put your money into the account and demonstrate a number of successful trades to encourage you to invest greater sums. Then your money begins to disappear and so too does the scammer.”
The clearest warning sign you’re dealing an investment scammer is how they contact you and the promises they make.
“It can be very difficult to tell what is and isn’t legitimate these days. If someone calls, emails or texts you out of the blue with investment advice, don’t engage with them no matter how legitimate they sound. Hang up the phone, or delete the email or text. If you’re searching for new investment opportunities online, don’t always trust what you read. It’s easy for scammers to create professional looking investment websites,” Ms Rickard said.
“Any claims like ‘risk-free investment’, ‘low risk, high return’, ‘be a millionaire in three years’, or ‘get-rich quick’ are also easy tells that you’re dealing with a scammer.”
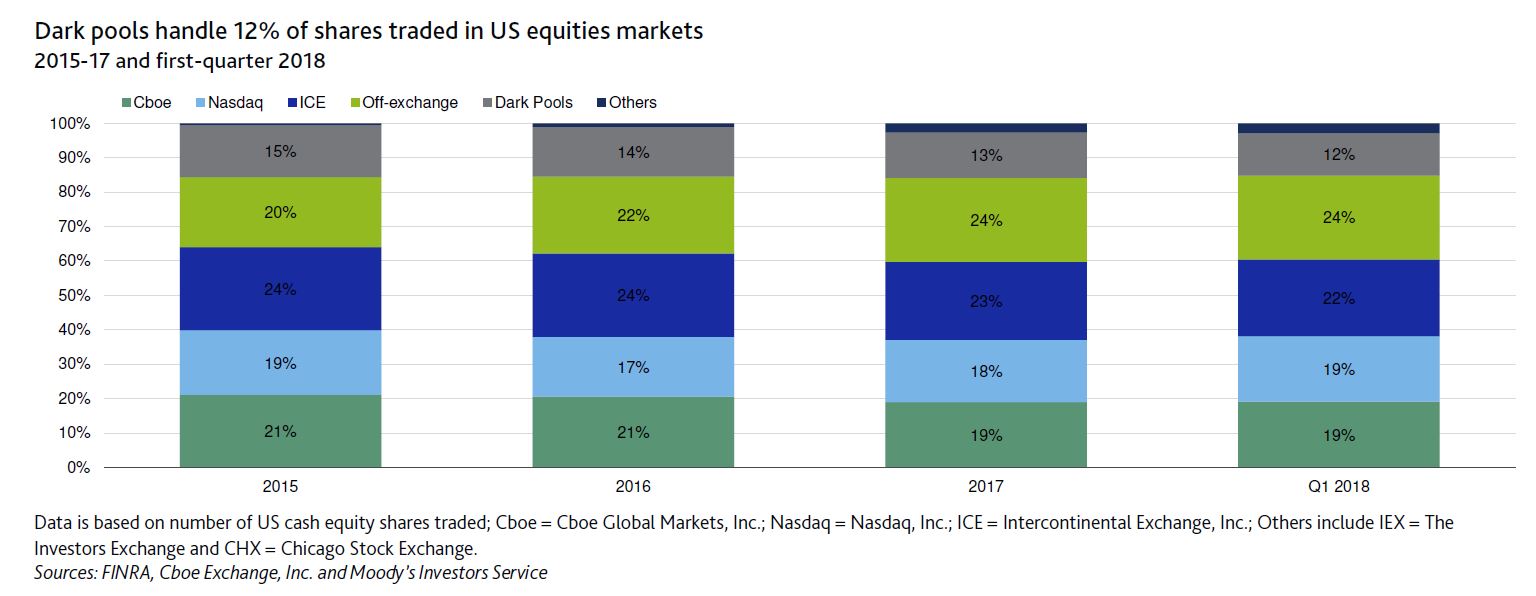
Moody’s says that last Wednesday, the US Securities and Exchange Commission adopted amendments to the rules governing alternative trading systems (dark pools) that will increase transparency around trading data and execution.
The new rule is credit positive because it will require dark pools to provide standardized and detailed public disclosures, enhancing their oversight. The new disclosures take effect January 2019.
The increased disclosure requirements will improve reporting and oversight by dark-pool operators, which are typically large banks and independent and specialized trading firms such as Liquidnet Holdings, Inc. We expect these improvements to increase customer confidence in dark-trading venues, allowing customers to assess potential conflicts of interest or the potential for leakage of subscriber information from the dark pools to its broker-dealer operator or affiliates. The tougher reporting requirement standards will also strengthen dark pools’ internal oversight and compliance framework, which should limit future regulatory penalties, a credit positive.
Dark pools are a type of off-exchange trading venue that institutional investors actively use because they provide anonymous execution and minimize market effects. Dark-pool trades remain subject to national market system regulatory requirements, chief among them that trades must be executed at or better than the national best bid-offer price – the price that corresponds to the most competitive, publicly visible resting order on so-called bright venues such as exchanges. As of first quarter 2018, dark pools processed around 12% of all US equity trading volume
In recent years, the SEC and the New York Attorney General have scrutinized dark pools. Securities regulators investigated whether banks misled institutional investors participating in their dark pool trading venues and favored high frequency traders. A number of dark-pool operators agreed to settle charges relating to disclosure failures or other securities law violations. Most prominently in 2016, subsidiaries of Barclays Bank PLC (A2/A2 stable, baa31) and Credit Suisse AG (A1/A1 stable, baa2) agreed to settle separate cases. Barclays paid $70 million and Credit Suisse paid $84.3 million to resolve claims that their dark pools failed to continuously monitor the trading venues against predatory trading, to treat subscriber information confidentially and other disclosure shortfalls.
The new reporting requirements include the disclosure of information regarding ownership of a dark pool and its broker-dealer and arrangement between the dark pool and affiliate broker-dealers. A dark pool will also be required to disclose the type of subscribers it caters to, order types, fees and other operational information.
Following on from the SMH article today, The Project also did a segment on the subject, including my comments via a recorded live cross. The issues of mortgage stress and repayments are going mainstream!
Martin North, the principal at consultancy Digital Finance Analytics, said interest-only loans account for about $700 billion of the $1.7 trillion in Australian mortgage lending and it was “our version of the GFC”.
“My view is we’re in somewhat similar territory to where the US was in 2006 before the GFC,” Mr North said.
“This is absolutely not ‘sub-prime’ in the US definition but there were people [in Australia] who were being encouraged to get very big loans on the fact that principal & interest was impossible to service but they could service interest-only,” Mr North said.
“We also know that some interest-only loans were not investors but they are actually first-home buyers encouraged to go in at the top of the market.”
Those who follow our posts will know this has been an area of concern for several years as the volume of IO loans accelerated to a peak of more than 40%, before the regulator finally acted.
Now lending standards have been tightened, but there is a large overhang of loans which now will fail to be refinanced again.
So many households will need to step-up to an interest and principal repayment loan, which could be 40% or more higher to service, or be forced to sell.
In addition, some borrowers appear to not understand that they hold an IO loan, so this could all come as a nasty shock, at a time when property values are sliding, incomes are flat and costs of living are rising.
In addition, we know that many investment properties are already underwater from a net cash flow (before tax) position.
Despite the RBA’s recent assurances that many will cope just fine (and some households will) this has the potential indeed to be our version of the GFC.
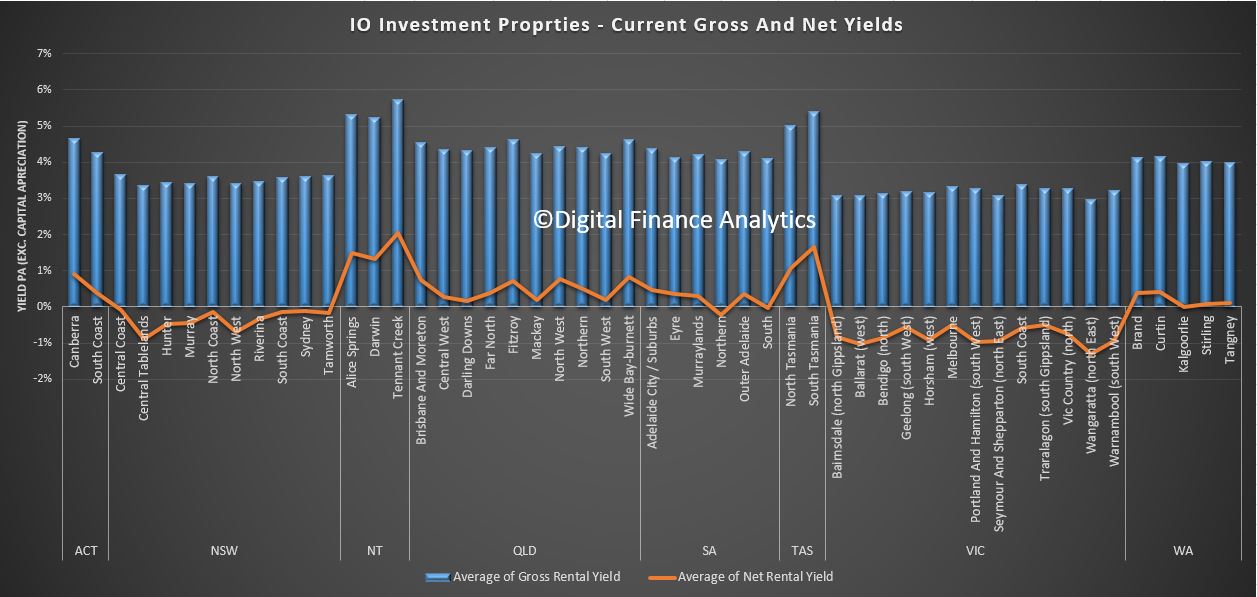
Here is analysis by state and region looking the the gross and net yield on investment properties (excluding capital appreciation). Many of the loans coming up for reset will require cash from sources other than the rentals. Most pressures appear to be in NSW and VIC, where on average loans are larger, and households more leveraged.
Welcome to the Property Imperative weekly to 21th July 2018, our digest of the latest finance and property news with a distinctively Australian flavour.
By the way if you value the content we produce please do consider joining our Patreon programme, where you can support our ability to continue to make great content. Here is the link.
Watch the video, listen to the podcast, or read the transcript.
It’s important to look past the headlines and examine the data, because we need to see the truth beneath.
Let’s start with the housing market this week. Auction clearance rates and volumes continue to fall and Sydney recorded the lowest clearance rate the city has seen since December 2012. CoreLogic says that last week saw 1,178 homes taken to auction across the capital cities, returning a clearance rate of 52.0 per cent. Compare this with 52.6 per cent across 1,411 auctions last week and 69.4 per cent on 1,627 homes this time last year.
Melbourne’s final clearance rate came in at 56.2 per cent across 559 auctions last week, similar to the previous week when 631 auctions were held and a clearance rate of 56.1 per cent was recorded. This time last year auction volumes were higher across the city with 756 homes going under the hammer returning a clearance rate of 74.9 per cent.
Sydney’s final clearance rate dropped to 46.9 per cent last week across 408 auctions, the lowest clearance rate the city has seen since December 2012. In comparison, 552 auctions were held across Sydney over the previous week returning a clearance rate of 50.1 per cent while this time last year, 609 homes went under the hammer, returning a clearance rate of 69.2 per cent.
Across the smaller auction markets, clearance rates improved everywhere except Brisbane. In terms of volumes, Adelaide was the only city to see an increase with an additional 8 homes taken to auction over the week. Of the non-capital city markets, the Hunter region recorded a 70.6 per cent final auction clearance rate across 17 results, followed closely by Geelong where 70.4 per cent of the 27 auction results were successful.
CoreLogic says auction activity is expected to remain relatively subdued this week with 1,155 homes scheduled for auction across the combined capital cities, similar to last week. And they also reported that home prices slid further across all the centres other than Brisbane, down another 0.11% in the past week. So absolutely no indication of any improvement. Today I had the chance to visit five auctions in our area, none sold, and no-one serious made any bids at three of the events.
But this should come as no surprise, as credit is still less available than a few months ago. Indeed, around forty percent of households seeking to refinance their mortgages have been knocked back compared with just 5% a year ago. We discussed these findings as part our analysis of Household Financial Confidence, which overall was lower again – see our post “Household Financial Confidence On The Blink Again” . The June 2018 edition of the index, which draws information from our rolling household surveys, registered just 89.7, well below the 100 neutral setting and down from 90.2 last month. Debt remains a major issue, with mortgages being the front line. Households remain highly leveraged. Some households with lower Loan to Value ratios have been able to switch to other, cheaper loans. We also continue to see many households adding to their overall debt via credit cards, or other loans. The new positive credit environment which commenced 1 July 2018 will change the game ahead and credit may become harder to source for some. On the other hand, households continue to dip into their savings to maintain lifestyle and budgets. Significantly more than one third of households with an owner occupied mortgage had savings LESS than the equivalent of one month’s mortgage repayment. The other two thirds had significantly larger resources which would insulate them in a down turn, at least for a time.
CoreLogic has looked at the changes in property values by area from their peaks, with Perth showing a 28% fall alongside Darwin, Brisbane down 12.5%, Adelaide down 7.4%, Canberra down 6.8%, Sydney down 5.3% and Melbourne down 0.9%. And over the past decade, house values fell on average 27% across Mackay, in Queensland, and more than 34% across the WA outback. These are big falls, and puts the movements in Sydney and Melbourne into perspective – or perhaps provides a better view of where we are headed.
S&P Global Ratings did a job on the banks this week, saying they recently negatively revised their view of the Australian banking sector’s industry risk. Developments over the past two years in the Australian banking sector, including information coming out of hearings at the ongoing Royal Commission, highlight some weaknesses in the effectiveness of regulation in the banking sector, and the conduct, governance, and risk appetite shown by Australian banks. This is a big deal, as we discussed in our post “And Now For The Bad News, At Least For The Banks”.
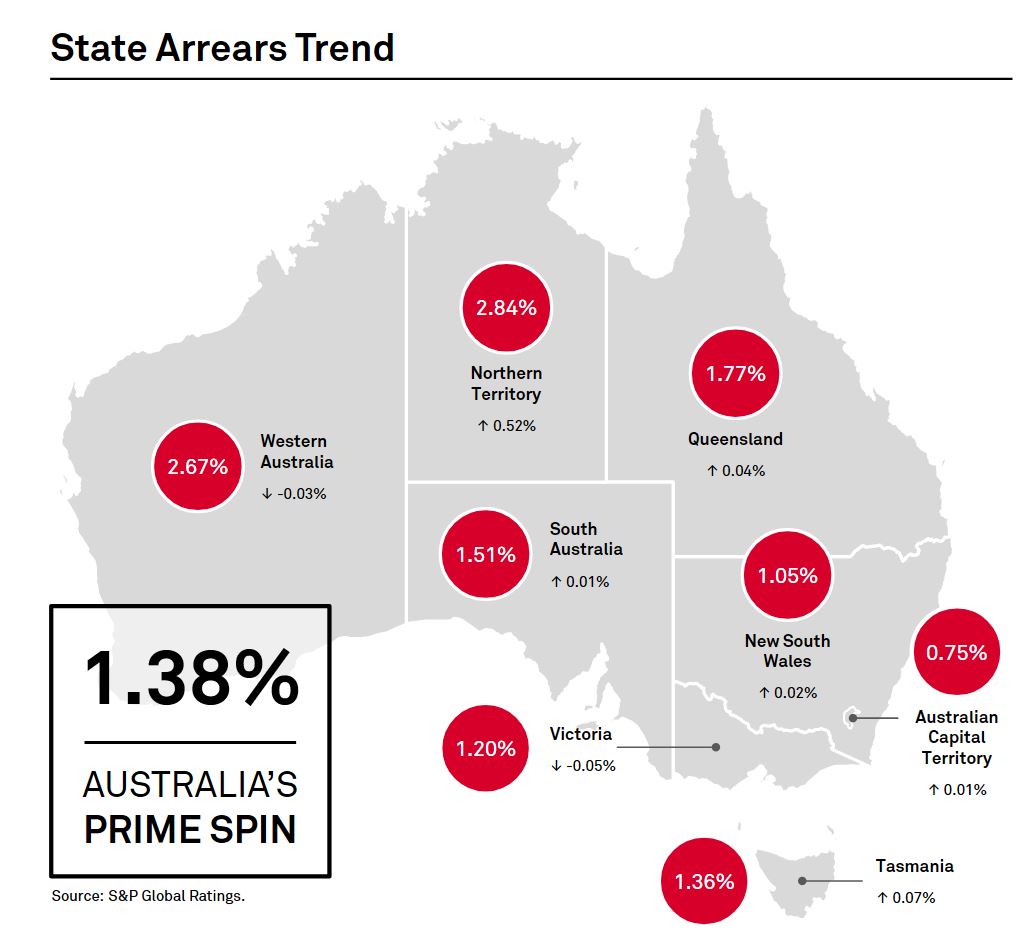
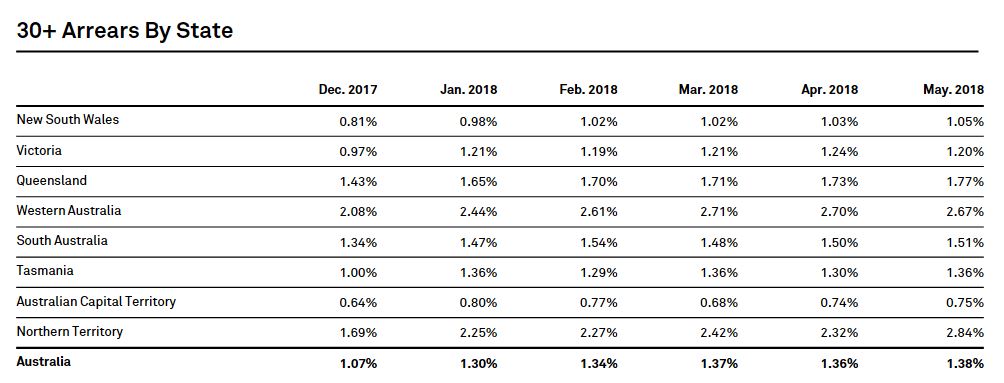
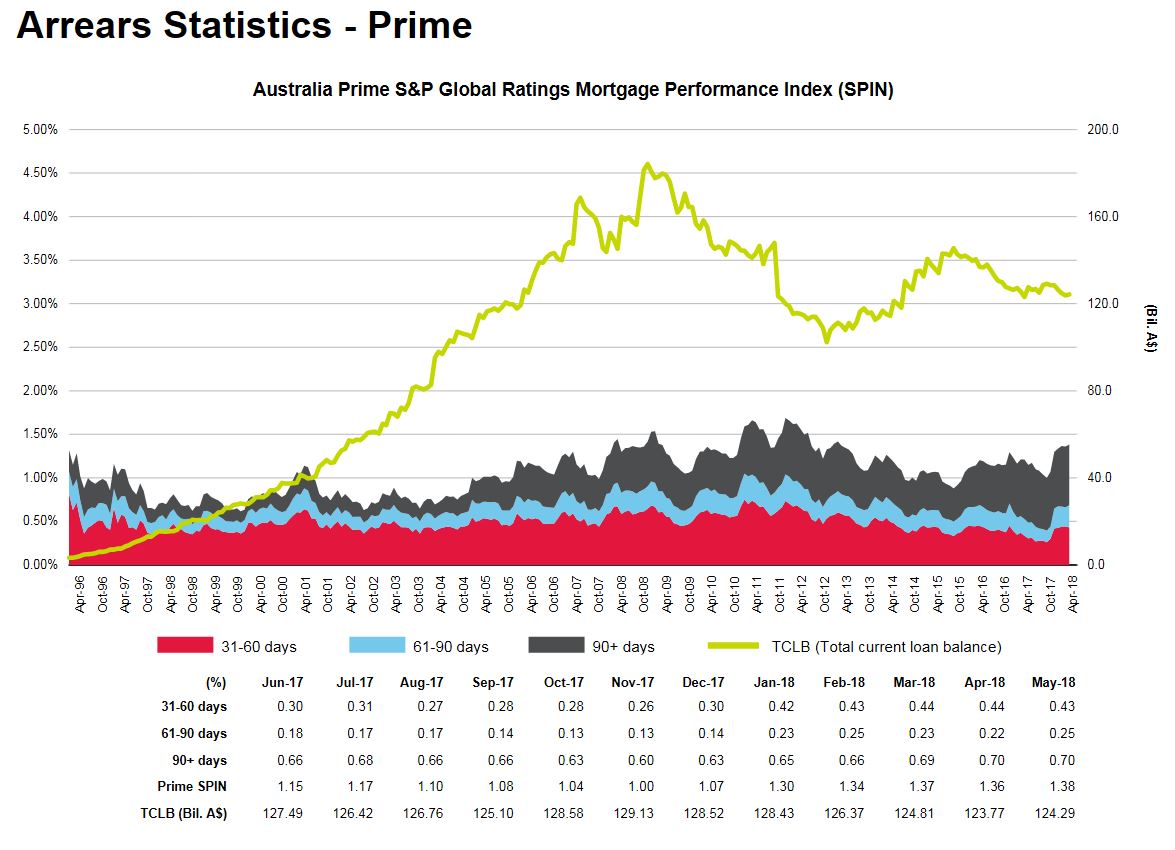
In addition, The latest S&P Ratings SPIN index to May 2018, based on their portfolio of mortgage backed securities showed a further move up in defaults compared with last month, from 1.36% to 1.38%. There were rises in New South Wales of 0.02%, Queensland of 0.04% and Northern Territory up 0.52%. Significantly, the larger hikes were seen in the major bank portfolios, with the prime spin rising from 1.36% last month to 1.38% in May. There was a rise in 61-90 day past due loans, from 0.22% last time to 0.25%. While these moves are small, arrears are now as high as they were back in 2011, and interest rates are much lower today, so this highlights the risks in the system. This does not appear to be a seasonal issue either; it is more structural.
In addition, personal insolvencies were higher again, according to the Australian Financial Security Authority who released their statistics for 2017–18 and the June quarter 2018. The data reveals a sharp rise in total personal insolvencies to the highest level since the Global Financial Crisis a decade ago, with record high insolvencies reached in WA and NT, and debt agreements also hitting an all-time high. The pressure on households continues to bite.
Even the RBA minutes, out this week discussed the problem. And the latest SQM Research data on rentals also showed that Sydney vacancy rates are the highest in 13 years, at 2.8%, potentially putting more pressure on property investors in city.
We also ran some alternative mortgage scenarios this week, showing that even if incomes started to move up, to nearer 3% that’s 1% higher than now, the number of households struggling with their finances would remain well above the long term trends. We remain, as a nation, highly exposed to debt, especially if interest rates rise. You can watch our video on this analysis “Alternative Mortgage Stress Scenarios”.
Even CBA’s Gareth Aird, their Senior Economist, in a fairly bullish piece, admitted that for many households, the number one headwind that they face with respect to consumption is debt repayment. Australia has one of the most indebted household sectors globally. Debt to income ratios have risen from around 148% in mid-2012 to a record high of 190% in Q 2018. This measure includes all households regardless of whether they actually have a mortgage. For households that have a mortgage, that figure is significantly higher. It has increased steadily as interest rates have come down despite lower rates making it easier to repay debt. Basically growth in the net flow of credit (i.e. new credit less repayments) has been higher than growth in income. He says a high debt burden relative to income acts as a constraint on future household consumption growth. It means that interest payments as a share of income are higher than otherwise. And of course the principal must be paid too. This leaves households with less income that can be spent on goods and services. And it means that households have a much greater sensitivity to interest rate changes. From a demographic perspective, it is younger households feeling the debt burden most acutely. There are also about $120bn of interest only loans in aggregate that are scheduled to roll over to principle and interest (P&I) loans annually over the next three years. Borrowers shifting to P&I loans will face higher monthly loan repayments. Could not have put it better myself.
The plight of households in the current environment even reached New York in an excellent piece in the New Your Times. “Australian Housing Costs Rival New York’s, but Boom May Be Ending“. I was quoted extensively: “We are on the edge of a precipice,” said Martin North, principal analyst for Digital Finance Analytics, an independent research and advisory firm. “All of the forces that have driven the home sector and the debt sector higher in the last 20 years are all coming to a critical inflection point.” “Almost everywhere you look, you can see icebergs,” Mr. North said. Signs of stress are showing. Mr. North, the analyst from Digital Financial Analytics, estimates that of 3.5 million mortgages where the owner lives in the home, almost a third of the households have incomes close to or less than their expenditures. He predicts that at least 50,000 homeowners may default in the next 12 months.
If you want to get deep and dirty into our analysis, and the potential consequences for Australian Households, and mitigation strategies, then you might want to watch the recording of our Live Stream from last Tuesday. It’s just over the hour in length, and we have some excellent interactions in the chat room. In fact there are two versions available, the live edition, including real-time chat, and the odd technical glitch (helps to turn the sound on), or the slightly shorter version, at higher quality and tidied up, but without the chat. You can choose. We plan more live events down the track. The links are below.
The apparent bright spot this week was the latest employment data which was above market expectations. The number of people employed rose 50,900 from May to June in seasonally adjusted terms, which was well ahead of forecasts of around 16,500. And that wasn’t just a lot of new part-time jobs. Full-time employment rose by 41,200. On a year-on-year basis that represents an increase in employment of 2.8%. But even then, the number of people unemployed fell from 715,200 in May to 714,100 in June. This is explained by the participation rate – the proportion of people participating or trying to participate in the paid labour market. The participation rate rose from 65.5% in May to 65.7% in June, leaving the unemployment rate unchanged at 5.4%. The Australian labour force participation rate is actually pretty high. A useful comparison is the United States – probably the world’s most robust labour market – where the current rate is 62.9%. The key point is that if more people are going to come into the labour market when it looks better – as they have been consistently – then a continued reduction in the unemployment rate is going to require creating a whole lot more jobs. And in any case the basis for counting employed people is suspect. We discussed this in our post “And Now for The Good News”. Little sign of wages growth at the moment.
The local stock markets had a pretty good week, again, with the ASX All Ords up 0.35% on Friday to 6,377. The S&P ASX 100 was up 0.38% to 5,168, encouraged by the employment data, and the economic news from China. Westpac, the largest investment mortgage lender was up 0.67% to 29.90, but well below its 12 month highs, and CBA rose 0.68% to 75.90, but again well below prices from a year ago. The overhang from the Royal Commission, tighter funding, and higher risks explain why they are priced down.
Looking across to the US markets, the earnings season was in full flight for the week and the majority hit or beat Wall Street expectations. The Down Jones Industrial was down 0.3% to 25,058 on Friday and the S&P 500 fell a little to 2,801. The Volatility Index, the VIX was also a little lower, but remains above its level last year. The financial sector continued to perform well. Morgan Stanley led the broker-dealer reports and Goldman Sachs also topped estimates, although concerns about its succession plan hit the stock later in the day. But even so, these stocks are off their 12 month highs, and Macquarie Bank, in comparison, has been performing more strongly in our local market up 0.84% on Friday to 125.40.
On the tech-heavy NASDAQ, which fell just a little on Friday, down 0.07% to 7,820, it was a tale of two techs as a momentum stock fell short of what investors wanted and an old stalwart came through. Netflix tumbled at the start of the week after the company missed expectations on new subscribers, a key metric for the streaming company. Netflix added 5.14 million subscribers in the latest quarter, shy of analysts’ expectations for more than 6.2 million. But after the bell on Thursday, Microsoft reported second-quarter earnings that beat consensus thanks to cloud services revenue.
The prospect for the path of U.S. interest rates took an interesting turn at the end of the week. At first things seemed to jibe with market expectations that the Federal Reserve will raise rates once and possibly twice before the year is out. At his Humphey-Hawkins testimony before the Senate Banking Committee and the House Financial Services Committee, Federal Reserve Chairman Jerome Powell reiterated the central bank should gradually increase interest rates.
But President Donald Trump shook some of the market’s confidence, saying on Thursday he’s “not thrilled” about the Fed hiking rates and going into more specifics on Twitter on Friday.
The tweets had little overall impact on the market forecasts for upcoming rate hikes. But they did take the legs from the dollar on Friday. The U.S. Treasury Department has long had a policy of simply stating that a strong dollar is in America’s best interest.
The yield curve continues to converge across the long and short term, and this has often been seen as an early warning of trouble ahead. This from Bloomberg.
The 30-year bond is sitting at 3.03% and the 3 Month at 1.98%. The 3 Month LIBOR rates remained above 2.3% and the 10 year benchmark is at 2.9%, just a little off its highs, and this also reflected in a lower BBSW rate in Australia, suggesting a small fall in margin pressure for the banks locally compared with a few weeks ago.
Trade-war concerns took a back seat through most of the week, but were revived on Friday and could weigh more heavily next week, despite another full earnings calendar. President Trump said in an interview on CNBC that he is ready to impose tariffs on $500 billion worth of Chinese goods to the U.S. if China does not back down on its trade policies. “I’m not doing this for politics, I’m doing this to do the right thing for our country” he said on CNBC’s “Squawk Box.” “We have been ripped off by China for a long time.”
In fact, Moody’s highlighted that already the trade-wars is hitting base metal prices, yet is hardly mentioned. Since worries surrounding a trade war came to the fore, the base metals price index has sunk by 13.0%. The copper futures are well down from their highs a couple of months back, as is steel. This could crimp Australian GDP in the months ahead. And both Gold and Silver were weaker, suggesting that at the moment “risk” investors are preferring the US Dollar.
It’s also worth noting the Chinese Yuan slide against the US dollar and the Australian Dollar and some are suggesting that this is a sign of the Chinese Government answering the Trade wars by taking their currency lower (so reducing the cost of their goods in the local economies). The Aussie Dollar continues to drift lower against the US Dollar, and we expect this to continue, indeed one economist suggested it could end up around 60c in the months ahead.
Crude oil prices posted a second-straight weekly decline and may continue to weigh on energy stocks, as they have of late. On the New York Mercantile Exchange crude futures for September delivery rose $1.30 to settle at $70.46 a barrel Friday. Investors continue to weigh up the prospect of a global shortage in supplies, despite Saudi Arabia’s pledge to hold off flooding the market with more output. That said, crude oil prices were supported on Friday by the plunge in the dollar following Trump’s remark about the greenback and other currencies.
Bitcoin lifted a little, and continues in a less volatile mode, though well below earlier highs.
Finally, for today, another lens on the debt bomb, as featured in my recent discussions with Economist John Adams, including those on the debt bomb itself, the international debt bubble and more recently the meaning of money. We have more planned, so watch out for those, and there is also dedicated web page on the DFA blog. Again the link is below.
The McKinsey Global Institute says that since the GFCs, many large corporations around the world have shifted toward bond financing as commercial bank lending has been subdued. Today, 19 percent of total global corporate debt is in the form of bonds, nearly double the share in 2007. Annual nonfinancial corporate bond issuance has increased 2.5 times, from $800 billion in 2007 to $2 trillion in 2017. The global value of corporate bonds outstanding has increased 2.7 times since 2007 to $11.7 trillion, doubling as a share of GDP.
The average quality of blue-chip borrowers has declined. In the United States, almost 40 percent of nonfinancial corporate bonds are now rated BBB, just one notch above speculative-grade “junk bonds.” Growth in speculative-grade bonds has been particularly strong. Globally, the value of corporate high-yield bonds outstanding increased from $500 billion in 2007 to $1.9 trillion in 2017. In the coming five years, and unprecedented amount of these bonds will come due. Bond issuance by companies in China and other developing countries has soared. The value of China’s nonfinancial corporate bonds outstanding rose from $69 billion in 2007 to $2 trillion at the end of 2017, making China one of the largest bond markets in the world. Outside China, growth has been strongest in Brazil, Chile, Mexico, and Russia.
From 2018 to 2022, a record amount of bonds—between $1.6 trillion and $2.1 trillion annually—will mature. Globally, a total of $7.9 trillion of bonds will come due during those five years, based on bonds already issued. However, some bonds have maturities of less than five years and may still be issued and come due during that period. If current issuance trends continue, then as much as $10 trillion of bonds will come due over the next five years. At least $3 trillion of this total will be from US corporations, $1.7 trillion from Chinese companies, and $1.7 trillion from Western European companies.
Now overlay the rising interest rate environment, and you can see the problem. Such high leverage will cost the global economy dear, and sooner rather than later.
S&P Global Ratings has just come out with a significant comment on “some weaknesses in the effectiveness of regulation in the banking sector, and the conduct, governance, and risk appetite shown by Australian banks”. Finally!!
The negative rating outlooks on systemically-important Australian banks reflect pressures on the Australian sovereign creditworthiness (Commonwealth of Australia; AAA/Negative/A-1+) and a possible tempering of our current highly supportive opinion concerning the Australian government’s tendency to support banks.
During the past quarter, we revised our economic risk trend for the Australian banking industry to positive from stable. This reflects our expectation that the trend of an orderly unwinding of economic imbalances, including for high property prices and private sector indebtedness, should continue for at least the next year.
By contrast, we recently negatively revised our view of the Australian banking sector’s industry risk. In our view, developments over the past two years in the Australian banking sector, including information coming out of hearings at the ongoing Royal Commission, highlight some weaknesses in the effectiveness of regulation in the banking sector, and the conduct, governance, and risk appetite shown by Australian banks.
The latest S&P Ratings SPIN index to May 2018, based on their portfolio of mortgage backed securities showed a further move up in defaults compared with last month, from 1.36% to 1.38%.
In fact, Western Australia’s default rates improved a little, as did Victoria, but there were rises in New South Wales of 0.02%, Queensland of 0.04% and Northern Territory up 0.52%. ACT has the lowest default rate at 0.75%, followed by New South Wales at 1.05% while the Northern territory and Western Australia have the highest rates of 30 default at 2.84% and 2.67% respectively.
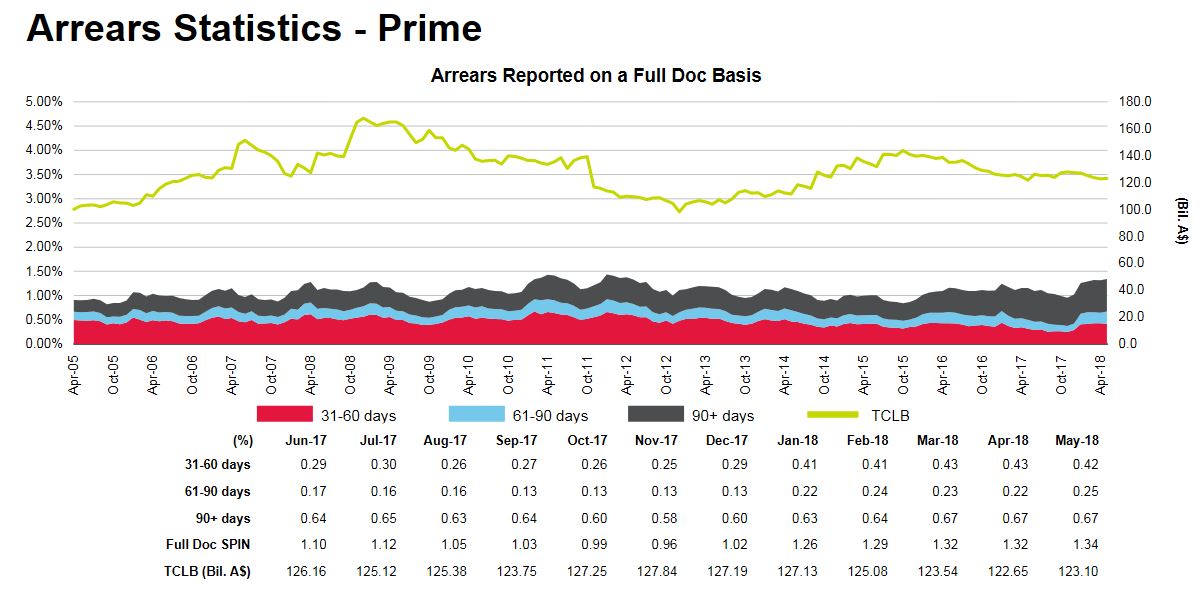
Looking across the period in default, the most significant rise across prime loans was in the 61-90 days bracket, up from 0.22% in April to 0.25% in May. 90 day plus arrears remained the same at 0.67%.
Significantly, the larger hikes were see in the major bank portfolios, with the prime spin rising from 1.36% last month to 1.38% in May. There was a rise in 61-90 day past due loans, from 0.22% last time to 0.25%.
Whilst these moves are small, arrears are now as high as they were back in 2011, and interest rates are much lower today, so this highlights the risks in the system. This does not appear to be a seasonal issue, it is more structural.