Last month, the Federal Reserve announced that 31 out of 33 U.S. banks had passed its latest “stress test,” designed to ensure that the largest financial institutions have enough capital to withstand a severe economic shock.
Passing the test amounts to being given a clean bill of health by the Fed. So are taxpayers – who were on the hook for the initial US$700 billion TARP bill to bail out the banks in 2008 – now safe?
But beyond this, the stress tests highlight a significant shortcoming in how regulators hope to prevent the next wave of bank failures: They’re focusing way too much on size, particularly with the designation of so-called systemically important, “too-big-to-fail” banks.
U.S. lawmakers in search of a solution are currently working on legislation that would make it easier for too-big-to-fail banks to actually fail through bankruptcy. While doing so would be a good thing, it still raises important questions.
Are policymakers right to focus on size in determining whether a bank poses a major risk to the financial system and taxpayers? Would splitting larger banks into smaller ones free taxpayers from the repeated burden of rescuing them during times of crisis? Does calling a bank “too big to fail” even mean anything?
To me, this focus on size and “too big to fail” seems misplaced. I’m among those who advocate replacing our current system with something known as “narrow banking,” which would totally separate deposits from riskier lending activities. This would have the best chance of protecting taxpayers from having to foot the bill for future bailouts, as I’ll explain below.
Dodd-Frank also says that banks and other companies that “could pose a threat to the financial stability of the United States” if they fail or engage in very risky activities must write bankruptcy plans known as living wills and meet stricter capital requirements.
Some policymakers contend that the increased regulation and capital are not enough and have called for breaking up big banks into smaller ones in order to reduce the probability of having to use taxpayer money to bail them out.
Neel Kashkari, president of the Minneapolis Fed, has called for breaking up the big banks.Brendan McDermid/Reuters
A question of size
In order to make sense of the too-big-to-fail slogan, we first must agree (or disagree) on what we mean by “big.” So, let us examine the biggest bank in the U.S.: JPMorgan Chase.
JPMorgan maintains about $1.39 trillion worth of deposits. Suppose we break up JPMorgan into four banks, each with approximately $348 billion of depositors’ money. Are these “baby” JPMorgan banks now “too small to fail”? Clearly not, since in the event of a bank failure, taxpayers may still be on the hook for up to $348 billion, each.
So if that’s not small enough, let’s divide them another time, into eight banks that each handles $174 billion in deposits. Could we now regard these new “baby-baby” banks as “too small to fail?”‘ Again, should we consider $160 billion not a small sum if the bank goes under and needs to be rescued by the government?
By this logic, we’d of course also need to break up the other big banks, such as Bank of America and Wells Fargo (each with just under $1.3 trillion in deposits) and Citibank ($947 billion).
The idea that breaking up banks into smaller banks reduces risks is an abstraction since our repeated experience (from the Great Depression to the Great Recession) shows that many banks tend to fail at the same time like dominoes, which by definition we call a “financial crisis.”
Would it really matter to the taxpayer whether a large JPMorgan fails or several “baby JPMorgans” collapse at the same time?
So size does not matter after all. If the term “big” does not make a lot of sense, then why do regulators and central banks keep repeating this slogan?
JPMorgan is the biggest bank in the U.S.Eric Thayer/Reuters
Unintended consequences
In fact, my reading of too big to fail is that, intentionally or unintentionally, it sends banks the wrong message. That is, regulators and central banks are basically telling the “big” banks that they should not worry very much because taxpayers and the Fed will always rescue them because they are too big to fail.
Therefore, intentionally or not, the assertion of too big to fail and passing artificial stress tests may actually generate exactly the opposite incentive for financial institutions, which may encourage large banks to continue taking risks with depositors’ money. In fact, using data for more than 200 banks in 45 countries, a New York Fed paper found that banks classified by rating agencies as more likely to receive government support engage in more risk-taking. The authors also show that riskier banks are more likely to take advantage of potential government support.
The stated logic behind the classification of too big to fail was to impose more restrictions on these financial institutions and conduct stress tests so they will become less likely to fail. The additional restrictions that central bankers are now considering imposing on banks, such as maintaining capital ratios as high as 16 percent to 18 percent, still do not free the taxpayer from bearing the remaining 80 percent of the bailout cost.
Although 16 percent seems like a high number compared with the 12.3 percent capital that large banks were assumed to maintain during the recent stress test, even 20 percent capital requirement leaves banks with substantial leverage. (A capital ratio just shows how much of a bank’s assets are backed by cash or cash-like instruments, as opposed to leverage, or debt.)
Let banks fail
If the TBTF and stress tests send the wrong message to banks, then I would suggest replacing too big to fail with “all banks, regardless of size, should be allowed to fail” with no taxpayer bailout.
The problem is such a statement suffers from what economists call “time inconsistency.” That is, policymakers may be able to take a hard line now, but once the banking system collapses, there is no government in the world (democratic or otherwise) that would be able to resist the political pressure to pay the banks whatever they want just to bring them back to life.
To solve the time inconsistency problem – and ensure policymakers let banks fail – we need to prepare in advance for the next wave of bank failures by protecting depositors’ money, instead of just focusing on stress tests or size reductions.
And this is actually easier to implement than one may think.
Depositors should be simply allowed to have access to accounts that maintain 100 percent reserves. That is, every cent of their savings would be backed by hard currency. Research of mine has shown that moving in this direction improves social welfare relative to the current system of purely fractional banking, in which banks only hold a fraction of their deposits. Currently they are allowed to lend up to 90 percent (keeping 10 percent as reserves).
There are several ways to implement that. One is to allow each depositor to open an online account with the central bank. This could be done via existing commercial banks or directly with the central bank. In addition, if central banks, such as the Fed, provide direct access via nonbank money transmitters (such as PayPal, Square, Western Union or even Wal-Mart’s Bluebird), depositors would be able to secure their money in advance against any loss, even in the event many banks and money transmitters fail. In fact, Mark Carney, governor of the Bank of England, recently announced that the U.K. central bank will expand direct access to nonbank payment providers.
Why haven’t I mentioned the Federal Deposit Insurance Corporation (FDIC), which was set up explicitly to protect deposits in the case of bank failure? Simple: In 2015, the FDIC fund had just $67.8 billion. Dividing this amount by total U.S. deposits implies that the FDIC can bailout only 1.06 percent. In fact, even if JPMorgan is the only bank that fails, the FDIC can only bailout 5 percent of this bank’s deposits, thereby making the FDIC totally irrelevant during a financial crisis.
On the other hand, a 100 percent reserves policy would break our current system’s bundling of risk-taking with the job of keeping accounts safe and offering payment services. Only then, by ensuring depositors (and voters) aren’t at risk when there’s a crisis, would governments have the will to let banks fail – without any regard to their size – and at no cost to taxpayers.
Author: Oz Shy, Senior Lecturer in Economics, Massachusetts Institute of Technology
The Basel Committee on Banking Supervision today published an updated standard for the regulatory capital treatment of securitisation exposures. By including the regulatory capital treatment for “simple, transparent and comparable” (STC) securitisations, this standard amends the Committee’s 2014 capital standards for securitisations. This securitisation framework, which will come into effect in January 2018, forms part of the Committee’s broader Basel III agenda to reform regulatory standards for banks in response to the global financial crisis and thus contributes to a more resilient banking sector.
The crisis highlighted several weaknesses in the Basel II securitisation framework, including concerns that it could generate insufficient capital for certain exposures. This led the Committee to decide that the securitisation framework needed to be reviewed. The Committee identified a number of shortcomings
relating to the calibration of risk weights and a lack of incentives for good risk management.
(i) Mechanistic reliance on external ratings;
(ii) Excessively low risk weights for highly-rated securitisation exposures;
(iii) Excessively high risk weights for low-rated senior securitisation exposures;
(iv) Cliff effects; and
(v) Insufficient risk sensitivity of the framework.
The above shortcomings translate into specific objectives that the revisions to the framework seek to achieve: reduce mechanistic reliance on external ratings; increase risk weights for highly-rated securitisation exposures; reduce risk weights for low-rated senior securitisation exposures; reduce cliff effects; and enhance the risk sensitivity of the framework.
In July 2016 the Basel Committee on Banking Supervision published an updated standard for the regulatory capital treatment of securitisation exposures that includes the regulatory capital treatment for “simple, transparent and comparable” (STC) securitisations. This standard amends the Committee’s 2014 capital standards for securitisations.
The capital treatment for STC securitisations builds on the 2015 STC criteria published by the Basel Committee and the International Organization of Securities Commissions. The standard published today sets out additional criteria for differentiating the capital treatment of STC securitisations from that of other securitisation transactions. The additional criteria, for example, exclude transactions in which the standardised risk weights for the underlying assets exceed certain levels. This ensures that securitisations with higher-risk underlying exposures do not qualify for the same capital treatment as STC-compliant transactions.
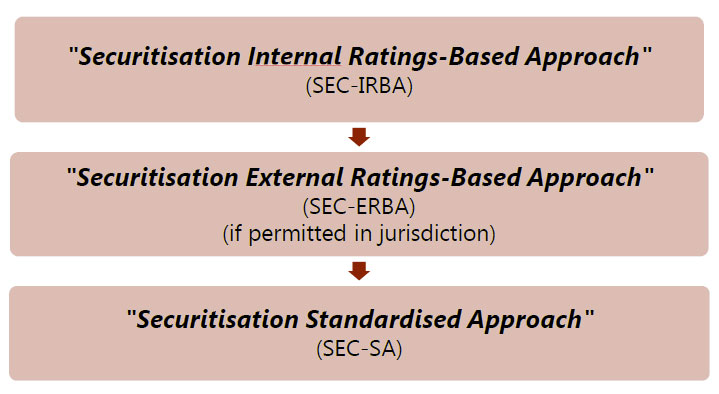
The Committee has revised the hierarchy as part of the Basel III securitisation framework, to reduce the reliance on external ratings as well as to simplify it and limit the number of approaches.
The SEC-IRBA is at the top of the revised hierarchy. The underlying model is the Simplified Supervisory Formula Approach (SSFA) and it uses KIRB information as a key input. KIRB is the capital charge for the underlying exposures using the IRB framework (either the advanced or foundation approaches). In order to use the SEC-IRBA, the bank should have the same information as under the Basel II SFA: (i) a supervisory-approved IRB model for the type of underlying exposures in the securitisation pool; and (ii) sufficient information to estimate KIRB.
A bank that cannot calculate KIRB for a given securitisation exposure would have to use the SECERBA, provided that this method is implemented by the national regulator. A bank that cannot use the SEC-IRBA or the SEC-ERBA (either because the tranche is unrated or because its jurisdiction does not permit the use of ratings for regulatory purposes) would use the SEC-SA, with a generally more conservative calibration and using KSA as input. KSA is the capital charge for the underlying exposures using the Standardised Approach for credit risk. A slightly modified (and more conservative) version of the SEC-SA would be the only approach available for resecuritisation exposures. In general, a bank that cannot use SEC-IRBA, SEC-ERBA, or SEC-SA for a given securitisation exposure would assign the exposure a risk weight of 1,250%.
The revised Basel III securitisation framework represents a significant improvement to the Basel II framework in terms of reducing complexity of the hierarchy and the number of approaches. Under the revisions there would be only three primary approaches, as opposed to the multiple approaches and exceptional treatments allowed in the Basel II framework.
Further, the application of the hierarchy no longer depends on the role that the bank plays in the securitisation – investor or originator; or on the credit risk approach that the bank applies to the type of underlying exposures. Rather, the revised hierarchy of approaches relies on the information that is available to the bank and on the type of analysis and estimations that it can perform on a specific transaction.
The mechanistic reliance on external ratings has been reduced; not only because the RBA is no longer at the top of the hierarchy, but also because other relevant risk drivers have been incorporated into the SEC-ERBA (ie maturity and tranche thickness for non-senior exposures).
In terms of risk sensitivity and prudence, the revised framework also represents a step forward relative to the Basel II framework. The capital requirements have been significantly increased, commensurate with the risk of securitisation exposures. Still, capital requirements of senior securitisation exposures backed by good quality pools will be subject to risk weights as low as 15%. Moreover, the presence of caps to risk weights of senior tranches and limitations on maximum capital requirements aim to promote consistency with the underlying IRB framework and not to disincentivise securitisations of low credit risk exposures.
Compliance with the expanded set of STC criteria should provide additional confidence in the performance of the transactions, and thereby warrants a modest reduction in minimum capital requirements for STC securitisations. The Committee consulted in November 2015 on a proposed treatment of STC securitisations. Compared to the consultative version, the final standard has scaled down the risk weights for STC securitisation exposures, and has reduced the risk weight floor for senior exposures from 15% to 10%.
The Committee is currently reviewing similar issues related to short-term STC securitisations. It expects to consult on criteria and the regulatory capital treatment of such exposures around year-end.
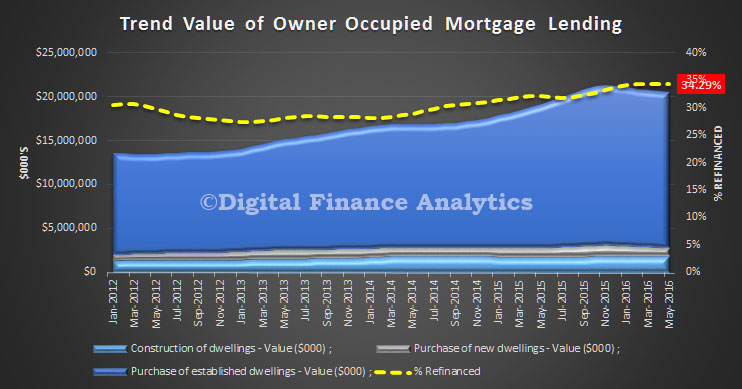
The housing finance data from the ABS today shows that there has been a slight slowing in absolute mortgage lending flows in May. But the overall stock of housing loans held by ADIs rose 0.62%, or $9.3 billion (after taking account of new additions, repayments and refinance, as well as adjustments). Total loans on book were worth $1.5 trillion, another record. Within that, owner occupied loans rose 0.76% or $7.3 billion, and investment loans rose 0.37% or $2.0 billion.
We will concentrate on the more reliable trend data series. Overall new owner occupied lending flows fell, in trend terms by 0.56%, or $115 million. Withing that overall fall though, refinanced loans were static, at 34.3% of lending, as households took up the low rate offers available. Lending for construction was down 0.54%, or $9.9 million, whilst purchases of new property were down 3.5% or $34 million and purchase of establish property was down 0.4%, or $71.6 million. Remember we are looking at flows of new loans here, so in trend terms, the value of mortgages is still growing, just more slowly.
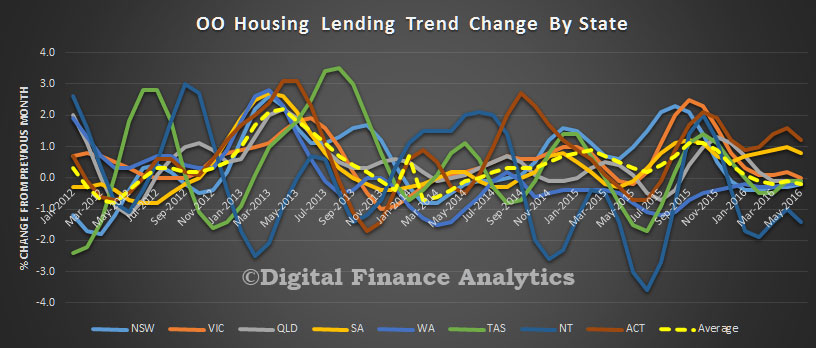
Looking across the various states, the weighted average was a drop of just 0.2%. ACT rose 1.2% and SA rose 0.8%, whilst all other states, other than NT fell around 0.2%. NT fell 1.4% on small volumes.
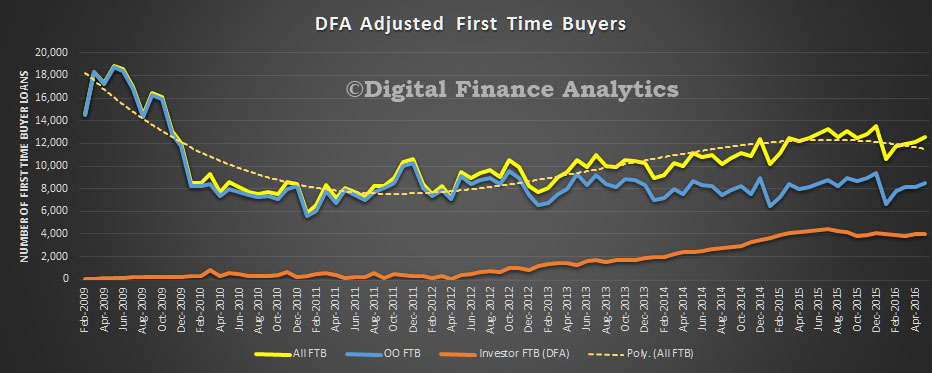
Looking at the original data for first time buyers, the number of loans jumped by 4.5% to 8,488, but comprised 13.9% of all transactions, down from 14.14% last month. The average loan size fell again by 1.3%, showing that tighter lending standards are biting, the average new loan for first time buyers is now $326,000, whilst the average loan to other borrowers also fell, to $362,000, down 1.2%. Using data from our surveys, we are able to identify those first time buyers going direct to the investment property sector. Investor loans grew 1.2% making 4,041 loans in the month, so total REAL first time buyers of all types rise by 3.4% to 12,529 during May.
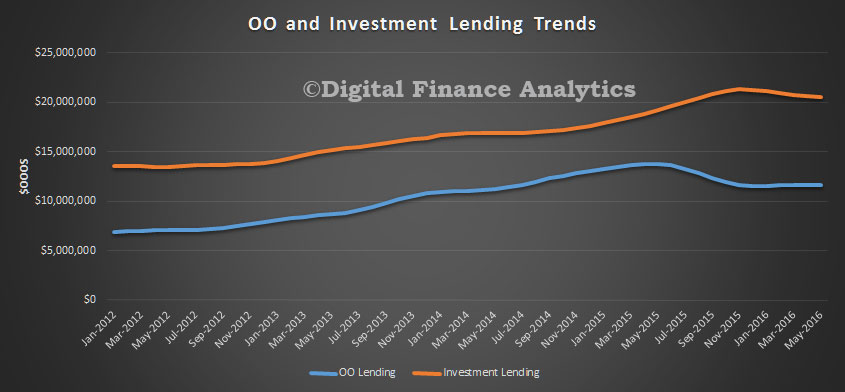
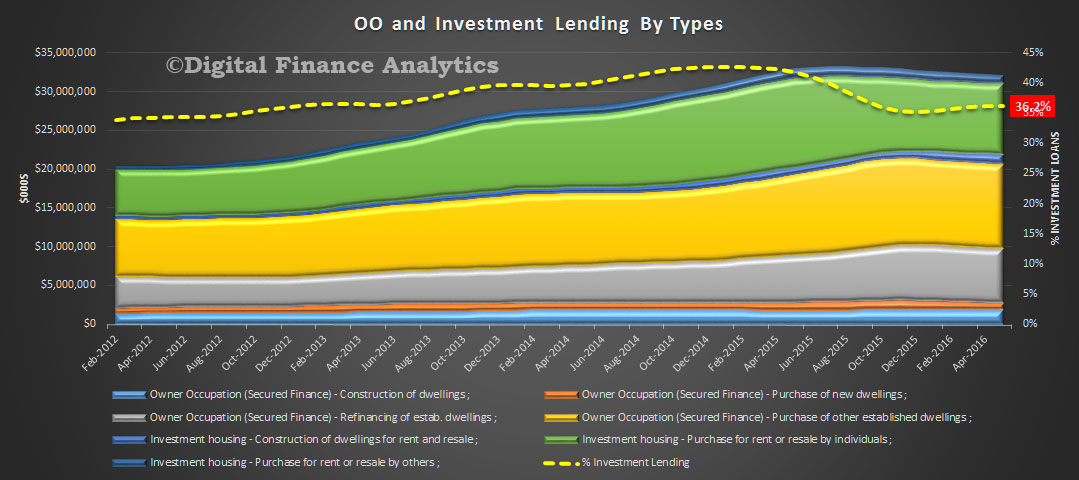
Looking at the mix of lending for investment and owner occupation, the flow of investment loans fell by 0.1% in trend terms (down $6m) whilst owner occupied loans flows fell 0.6% or $115 million. $11.6 billion of investment loans and $20.5 billion of owner occupation loans were written. In total more than $32.1 billion of new loans were written, compared with $32.2 billion last month, an overall fall of 0.4%.
As a result, the mix of new loans for investment purposes rose to 36.2%. We continue to see a rise in investment lending, with a 1.9% lift in loans for new investment property construction, compared with a fall of 0.5% for construction for owner occupation.
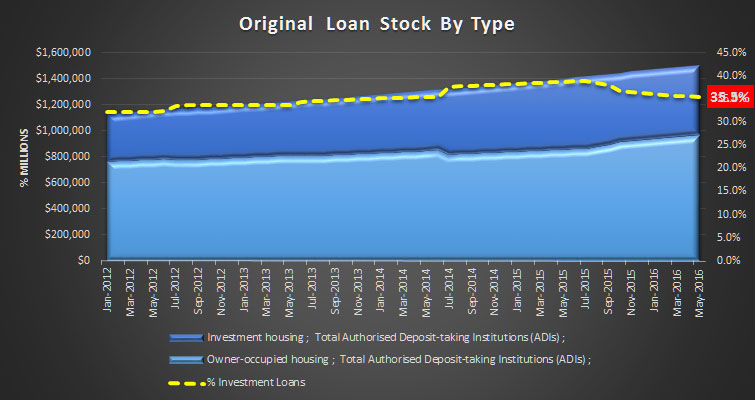
Finally, we look at loan stock, remembering some reclassifications continue. The overall stock of housing loans held by ADIs rose 0.62%, or $9.3 billion (after taking account of new additions, repayments and refinance, as well as adjustments). Total loans on book were worth $1.5 trillion, another record. Within that, owner occupied loans rose 0.76% or $7.3 billion, and investment loans rose 0.37% or $2.0 billion.
So, we conclude that momentum is likely to drive home loan demand higher, even if the rate of growth is somewhat curtailed by tighter lending standards. Demand is still being seen from investors and first time buyers are still active. Refinance to new low rates is still in play. So, no we have not yet reached “peak mortgage”.
According to Moody’s last Thursday, Canada’s Office of the Superintendent of Financial Institutions (OSFI) notified the country’s regulated mortgage lenders that it will intensify its supervisory oversight of their residential mortgage underwriting practices.
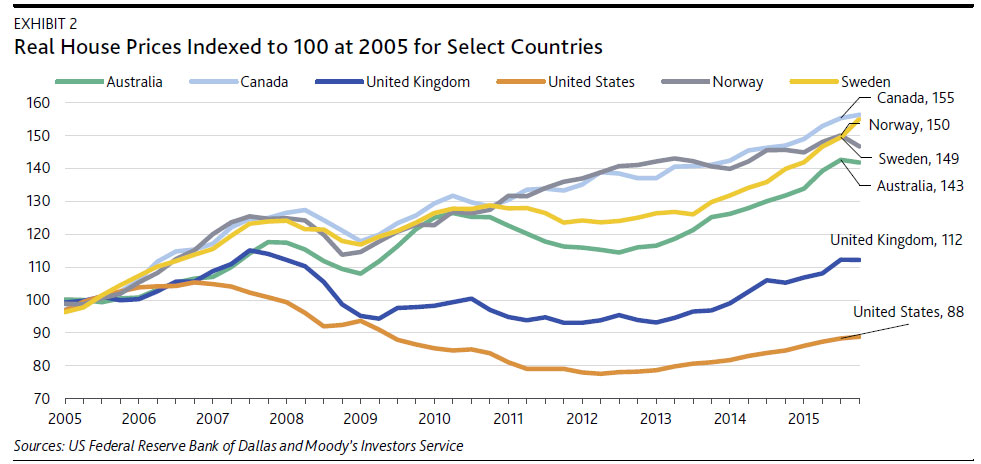
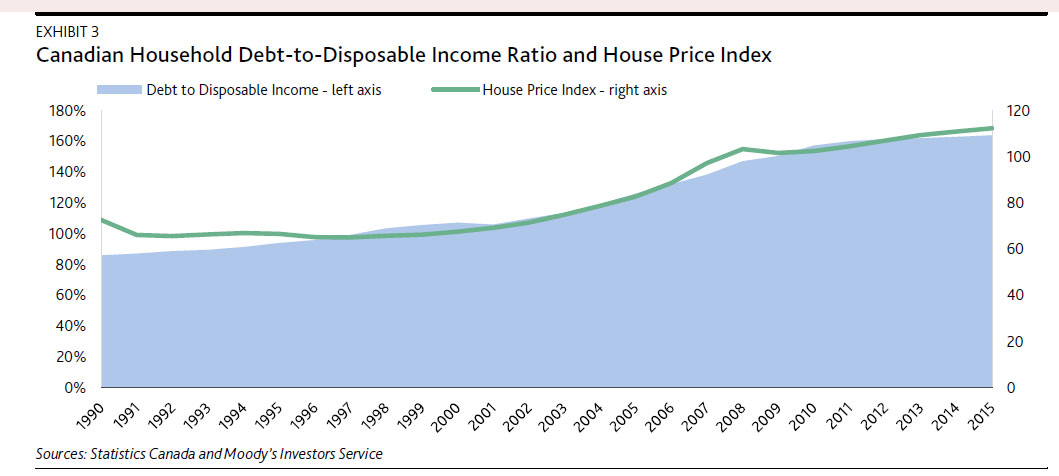
In the past 10 years home prices in Canada have lifted more than in Australia, although the debt to disposable income ratio at around 155% is still lower than Australia (175%) but higher than the UK (~130%). The Canadian market is also exposed to the impact of future interest rate rises.
Moody’s says that Canadian housing prices have risen faster than most other industrialized countries, resulting in house price levels increasing substantially over the past 10 years to be among the highest in major industrialized countries (see Exhibit 2), and raising the risk of a price correction. Over the past 25 years, house prices in Canada have steadily increased, primarily in urban centres such as Toronto, Ontario, and Vancouver, British Columbia.
The regulator vowed a heightened focus on income verification, mortgages with loan-to-value ratios of less than 65% (which OSFI indicated was a category in which underwriting practices are often less rigorous), stress assumptions related to debt-service ratios and the reliability of property appraisals. OSFI’s announcement is credit positive for Canadian banks because heightened regulatory scrutiny will force them to maintain or enhance existing residential mortgage underwriting controls and practices amid growing concerns about increasing household debt and elevated housing prices.
Residential mortgage debt, including home equity lines of credit (HELOCs), has doubled over the past decade. Canadian conventional mortgage debt, excluding home equity lines of credit (HELOCs), has grown at a compound annual rate of 7% over the past decade. Almost CAD1.6 trillion in mortgage debt, including HELOCs, was outstanding as of 31 March 2016, more than double the amount outstanding for the same period 10 years ago (see Exhibit 1).
Over the past 25 years, Canadian consumer debt-to-income levels, which include mortgage debt, almost doubled and are at a record high. As a result, housing indebtedness has tracked closely to house price increases as borrowers take larger loans, while at the same time, incomes have not kept pace. These higher debt levels make Canadian consumers vulnerable to an employment or interest rate shock that would exacerbate their debt-servicing burden (see Exhibit 3).
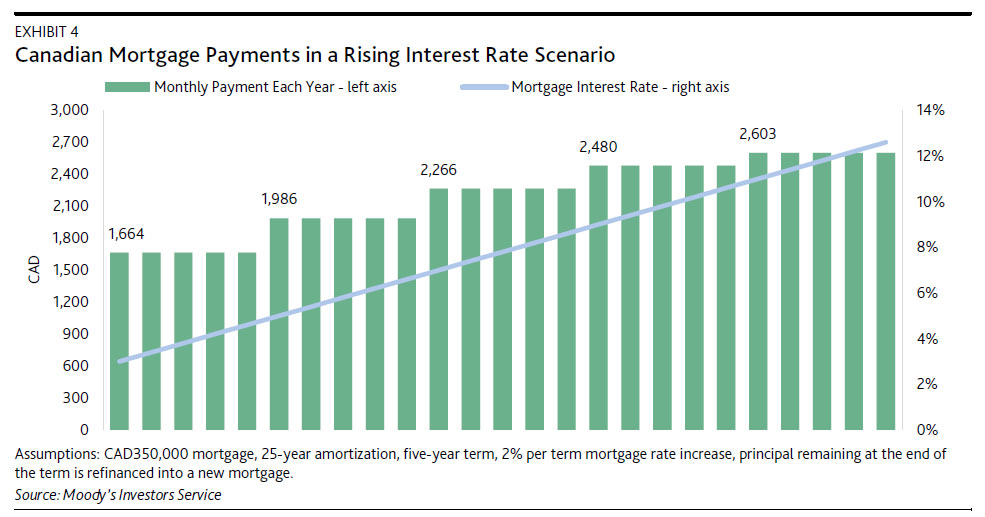
Of note, OSFI specifically indicated its interest in debt service ratios because current underwriting requirements may not adequately capture the stress effect of refinancing a mortgage into one with a higher mortgage interest rate. This is important because of the unique characteristic of a Canadian mortgage. A Canadian mortgage is structured as a balloon loan whereby the term (typically five years) is shorter than its amortization (typically 25 years). This means borrowers must periodically refinance their mortgages (see Exhibit 4), exposing them to changes in interest rates over the life of the mortgage. This refinancing risk is greatest for recent borrowers with high loan-to-value mortgages in a rising interest rate environment. OSFI noted that a rapidly rising interest rate environment would place considerable stress on existing debt service ratios, particularly on investment properties with rental income.
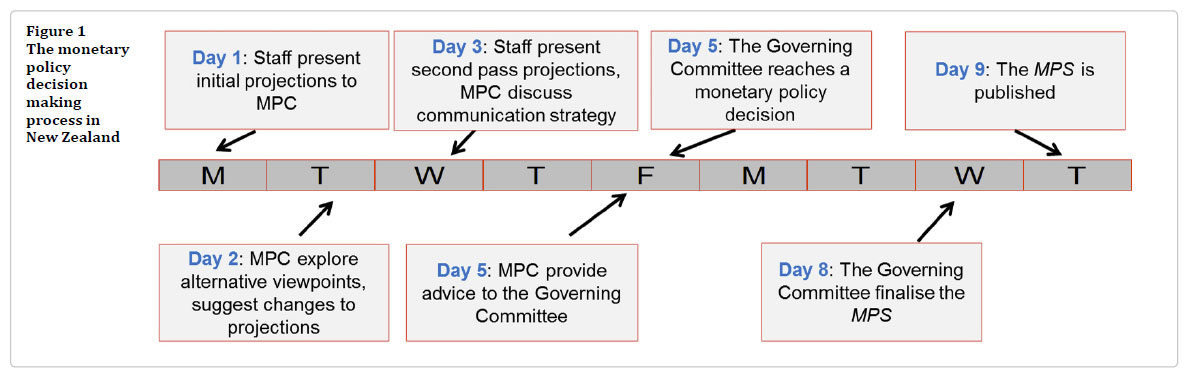
The New Zealand Reserve Bank today published a Bulletin article that explains the monetary policy decision-making process. Seven times a year, the Reserve Bank makes a decision on the appropriate Official Cash Rate (OCR) setting.The Reserve Bank conducts monetary policy to achieve the goals of the Policy Targets Agreement, but is faced with significant uncertainty when making OCR decisions.
A robust system is needed to address the inherent uncertainty that the Reserve Bank faces when making these decisions. The Bulletin article describes the detail of this process. The article discusses: the research behind a monetary policy decision; how the Governing Committee reaches a monetary policy decision; how the Bank communicates the decision to its key stakeholders; and how the decision-making framework is reviewed in the face of new developments.
The Bulletin article notes that a key element of the monetary policy decision making process is the need for constant review and innovation, and the Reserve Bank’s approach to decision making will continue to evolve over time.
Moody’s says that last Tuesday, the Bank of England’s (BoE) Financial Policy Committee (FPC) reduced the countercyclical capital buffer (CCyB) applied to banks’ UK risk-weighted assets to 0.0% from 0.5% as a result of expected softening in the UK economy following the UK referendum to exit the EU (Brexit). The reduced CCyB gives banks greater flexibility in providing credit to households and businesses, but reduces banks’ requirements to hold loss-absorbing capital, which is credit negative.
The 0.5% reduction of the regulatory capital buffers for UK banks in aggregate equates to £5.7 billion of capital. Given the BoE’s estimate of bank sector aggregate leverage of 4%, this allows for an increase in banks’ lending capacity of £150 billion. Such measures reduce the likelihood of a credit crunch and allow the UK’s financial system to absorb shock rather than amplify the negative effects on growth and investment from the uncertainty following the Brexit Referendum.
In 2015, net lending to the UK banking sector increased by around £60 billion, a small proportion of the additional lending capacity created by this reduction in capital requirements. Increasing the UK banks’ lending capacity will likely support their profitability, which we expect to be pressured by the low-rate environment, likely fall in demand for credit and an increase in credit impairments from the uncertainty around the UK’s vote to leave the EU.
Although the PRA and the FPC deem that the banks will still hold sufficient idiosyncratic and systemic risk capital to withstand a severe but plausible stress, these reductions in capital buffers will, if used to support lending, increase banks’ vulnerability to unexpected idiosyncratic and macroeconomic shocks. The effect will vary across UK banks, with leverage-constrained institutions less affected than those that are relatively more capital constrained. At 30 March 2016, the aggregate common equity Tier 1 ratio of the UK’s seven largest banks stood at 12.3%.
In March 2016, the FPC raised the CCyB to 0.5% effective March 2017 from 0.0%, with a 1% target for later in 2017, for the UK’s six largest banks1 in response to domestic credit risks, mainly related to an overheating housing market. Concurrently, to ensure there was no duplication in capital requirements, the FPC recommended reducing Prudential Regulation Authority (PRA) supervisory buffers (Pillar 2B) by 0.5%, offsetting the initial introduction of the CCyB. Despite this reversal in the decision to raise the CCyB, the BoE recommended to retain and bring forward the reduction in banks’ PRA buffer, to the extent the level of individual bank buffers is driven by macroeconomic versus idiosyncratic risk factors, thereby increasing available capital to support lending to businesses and households.
The CCyB is a macro prudential tool whereby the FPC adjusts bank capital requirements on a systemwide basis with the aim of dampening procyclicality of bank lending to the UK economy. This is intended to reduce the negative effects of boom and bust economic cycles, which are costly for banks and the wider
economy.
Although the CCyB may help avoid a credit crunch, amid a period of prolonged uncertainty around the UK’s future trade relationship with the EU, demand for credit is likely to be subdued, raising questions about the policy’s effectiveness on the real economy.
An interesting take on the Australian banking sector from InvestSMART.
Over the last 20 years the ASX All Ords has returned an average of 4.4 per cent a year. The major banks have beaten that hands down, delivering an average return of 7.5 per cent pa.
Things were wobbly during the GFC but the comeback, assisted by government guarantees, was stupendous. Investors that held on through thick and thin (there’s a lesson there) have done remarkably well. Even compared with their international equivalents, Australian banks are top of the class:
Since the GFC, when interest rates have slowly headed towards zero, Australian and Canadian banks have been the only ones with ROEs in double figures – well into double figures in fact. How have they done it? Well, our banking sector isn’t especially competitive. They all work pretty much the same way, do pretty much the same thing and charge a pretty penny for it. That’s part of it. But this chart showing real interest rates for cash, housing (mortgages) and business loans over the past 20 years is a better explanation.
A bank makes most of its money from borrowing out at one rate (the cash rate, more or less, shown as the blue line) and lending it out at a higher rate (the red, green and purple lines, showing different forms of lending). In banking this is called the interest rate spread and the higher it is, the more money it makes.
Since the GFC the cost of bank borrowing has fallen substantially but in real terms what we’re charged on our loans hasn’t fallen as much. A mortgage rate of four per cent might sound low to those of us that can remember rates of 15 per cent but compared to what a bank pays to borrow the money, it’s pretty high. The banks call it a ‘repricing’ of home loans, which the RBA has said puts the implied spread on housing lending “higher than the previous peak in 2009”. This chart shows what that means:
See that gap between the red and purple lines in 2009, when the interest rate spread was about two per cent? There was some compression after the GFC but now look at the gap for 2016: it’s even higher. The banks are making a killing on mortgages, and that’s the primary reason for their growing profitability. This chart shows the dividend payout ratios of the big four banks over the past 20 years:
While there’s a fair bit of volatility from year-to-year, bank dividend payout ratios are pretty high. That’s bank boards succumbing to investor demands for yield but also having the profits to be able to do so. More recently, we’ve had the odd situation where banks are paying out huge dividends and then asking for it back via capital injections to support a massive growth in mortgage lending (and comply with new regulations, which we’ll get to). Here’s the chart:
Incredible isn’t it? Our banking system has become addicted to mortgage lending. But why wouldn’t it be? Mortgages are hugely profitable and the source of returns on equity that are pushing 20 per cent in some cases. Here’s resident economist Callam Pickering on the issue:
“By focusing on mortgages, banks have the ability to leverage themselves higher which boosts profitability and return on equity. During good times, the key to greater profitability for banks is to write as many new mortgages as possible; those banks that focus on business loans are likely to suffer by comparison. For the most part, the majors are holding just a few cents for each dollar of mortgages they hold on their books.”
Are the regulators worried? Sure they are. A bank must hold a certain level of capital for each loan it writes. The amount depends on the perceived risk of a loan. In the past, mortgage assets have been ascribed a very low weighting – that ‘few cents for each dollar of mortgages’ is no exaggeration – but last year’s Financial System Inquiry concluded banks needed to hold more. Last year, the four largest lenders raised a record $20 billion in equity capital to comply with these new regulations. And they may need a similar amount over the next two years.
Even so, bank system leverage, which some claim is as high as 41 times, is higher than I’d imagine most bank shareholders suspect. And mortgages are the reason for it.
By their nature banks are leveraged. But to achieve such high returns on equity banks are using even more of it. This chart shows where most of that funding comes from:
On the past 20 years bank there’s been a big shift away from domestic deposits towards offshore financing of loans. That makes sense: you can’t sustain a huge increase in mortgage lending from domestic deposits alone. That money has to come from somewhere. Let’s put all this together and see what it means for the local economy.
First, that huge growth in mortgage lending shows up in household debt. LF Economics estimates that in the second quarter of 2015 Australia’s unconsolidated household debt was 123 per cent of GDP, the highest in the world. The euro area was half that, the UK 86 per cent and the US 79 per cent. That’s what a quarter century of uninterrupted growth does. Recessions purge bad debt from the system and economic growth hides it. When the tide goes out in the next recession, we’ll see who’s been bathing naked.
Second, the level of debt makes Australians especially sensitive to interest rate rises. Bond rates are telling us that there’s no prospect of that but if the markets are wrong it might not be pretty. Third, because of the increase in overseas bank funding, our banking sector is now more exposed to overseas developments, including currency movements. Our banking sector is anything but an island.
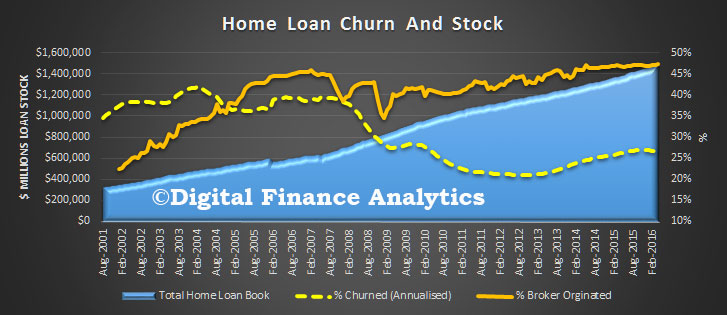
Currently more than 26 percent of the home loan lending book is being churned each year, reflecting strong refinance demand, low rates and massive marketing campaigns. So it is interesting to look at the trend data, especially in the light of the New Zealand Reserve Bank data we discussed yesterday, which indicated 35 per cent of loans there are churning annually.
Data from the ABS enables us to analyse the proportion of the home loan book which, by value is churned each year. To do this we compare the loan stock data, with the loan flow data, by total value pools. Here are the result for the ADI’s.
The stock figure takes account of new loans written, refinanced and repaid. The flow data shows us the new loans written. So we see a rise in churn from 2012, moving from about 20 per cent to more than 26 per cent. We also see a slowing turn in recent months, suggesting perhaps that the refinance drive has peaked. That said, there are a number of marketing campaigns suggesting that borrowers should refinance now if their mortgage rate does not have a three in front of it! On average, households with a loan of more than a year old would do well to check their rate.
All things being equal, you could say that the average loan is under four years, though in the real world, there is diversity, with some loans turned over every one to two years, and others retained for a much longer term.
What is also striking though is that in the 2000’s churn moved up from around 13 per cent to reach a peak of 39 per cent prior to the 2007/8 GFC. This rise in churn can be mapped to the rise of mortgage brokers in Australia (whilst the correlation could be coincidence, we suspect there is a link) as many brokers were on commission structures without claw-backs, with upfront commissions more generous that tail commissions. Changes in regulation and commission structures made the churn harder to execute later.
Still a quarter of the book turning over annually is pretty amazing, considering all the activity (and fees etc.) which are generated. It also suggests to me that bank’s should be thinking much harder about retention strategies.
Australia’s AAA credit rating was under pressure even before the election and is now looking decidedly shaky. Ratings agency Standard & Poors has moved Australia’s rating outlook from “stable” to “negative”, due to debt and a poor chance of budget repair.
This follows warnings from the other major credit rating agencies – Moody’s and Fitch Ratings. The problem is budget repair will only become harder over the coming years, whatever the final numbers in the parliament.
On the parties’ approach to budget repair, the Coalition and Labor are virtually indistinguishable as far as the credit agencies are concerned. The May budget projected a deficit (in underlying cash terms) of A$37 billion in 2016-17, gradually falling to $6 billion over the four-year forward estimates.
Labor’s plan is to reduce the deficit from $39 billion to $11 billion over that time. Both Coalition and Labor forecast a return to surplus over the subsequent years and indeed quite large surpluses ten years from now. Budget repair on this scale was utterly implausible before the election and is fiction now.
The government’s so-called “zombie” budget measures were baked into its projections over the forward estimate period. These were mainly the cuts to university funding, family payments and the Pharmaceutical Benefits Scheme. None of these had any prospect of being legislated with the past Senate, never mind with a larger, more powerful set of crossbench senators.
The Parliamentary Budget Office estimates these “zombie” measures to be worth $8 billion in total over the forward estimates. This accounts for roughly half of the difference between the total projected deficits of Coalition and Labor over the same period.
In short, there is little or no prospect of achieving the budget repair that is a pre-requisite for maintaining Australia’s AAA credit rating. Both sides of politics need to spell out to all Australians what this means. The effect of a credit downgrade is like an income cut to households, businesses and government.
It’s similar to the effect of a decline in the terms of trade (relative prices of our exports), and also similar to a loss of national productivity. All of these things effectively reduce our national disposable income. We become poorer as a nation.
Foreign lenders use Australia’s credit rating to set the interest rates that they charge Australian borrowers, mainly governments and businesses. A lower credit rating triggers a larger foreign risk premium in the interest rate that they charge borrowers.
This flows through to the general level of interest rates in the economy, so all firms and households with debts face higher borrowing costs. This can lead to less spending and hiring of workers by firms, and less disposable income for those households.
The major credit agencies are huge private organisations entrusted with capital of shareholders. They make calls about credit ratings not for political purposes but on the basis of what is in the best interests of investors.
The credit agencies are simply making rational assessments. The probability of Australia eventually defaulting on its debt is extremely low, but it is not zero and it is rising, which is important.
The slightly higher risk of default would result in a small downgrade from AAA, as occurred in the 1980s, by the major credit agencies. In turn this would imply higher interest rates, as it did back in the 1980s.
Higher interest rates are definitely bad news for those borrowing. It’s not necessarily good news for those saving either because rates on saving do not increase as much as rates on borrowing.
Also, when rates on overseas borrowing go up because of a larger foreign risk premium in our interest rates, the Australian dollar is likely to fall, as it did dramatically in the 1980s, from US 72 cents to 60 cents in the space of three months. When the Australian dollar falls for this reason our international purchasing power is reduced.
This is quite different to what happens when the Reserve Bank raises interest rates through its control over the official interest rate. In that case the Australian dollar is likely to rise, in the short term at least, which increases our international purchasing power – we can buy more from overseas with our income.
The parliament is like the Roman emperor Nero: “fiddling while Rome burns”, an apt analogy since Europe is where we are slowly headed economically and that won’t be pretty.
Author : Ross Guest, Professor of Economics and National Senior Teaching Fellow, Griffith University
Growing imbalances in the housing market require policy action on a number of fronts, New Zealand Reserve Bank Deputy Governor Grant Spencer said today. In an excellent speech he draws important links between the elements driving house prices, and also underscores the limits of the banks range of options, especially considering the target inflation range of 1-3%.
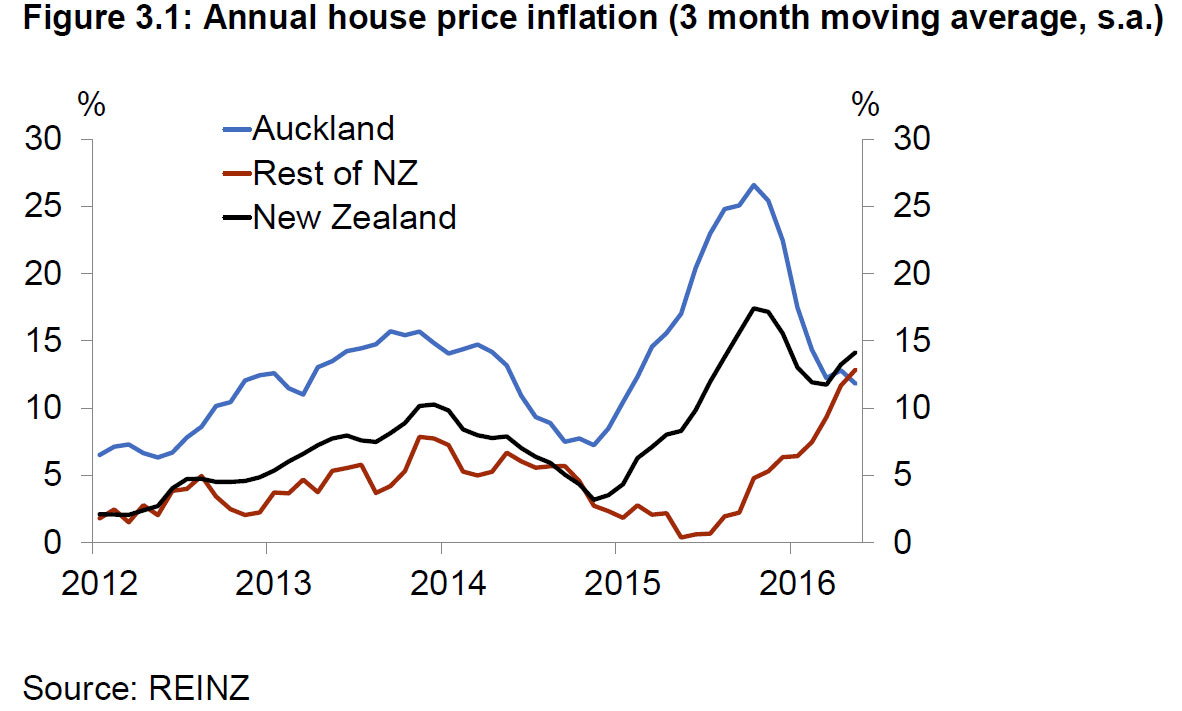
New Zealand is experiencing a housing market boom. House prices are increasing at 13 percent per annum nationally, and at 15-20 percent in Auckland and close-by regions. Evidence from housing cycles in several advanced economies suggests that the longer this continues, the more likely there will be a severe correction.
Speaking to the Wellington Branch of the New Zealand Institute of Valuers, Mr Spencer said that a range of factors had contributed to strong demand for housing, including record low interest rates, rising credit growth, and population increases.
While housing demand has been strong, the housing supply response has been constrained by rigid planning and consent processes, community preferences in respect of housing density, inefficiencies in the building industry, and infrastructure development constraints around financing and resource consents.
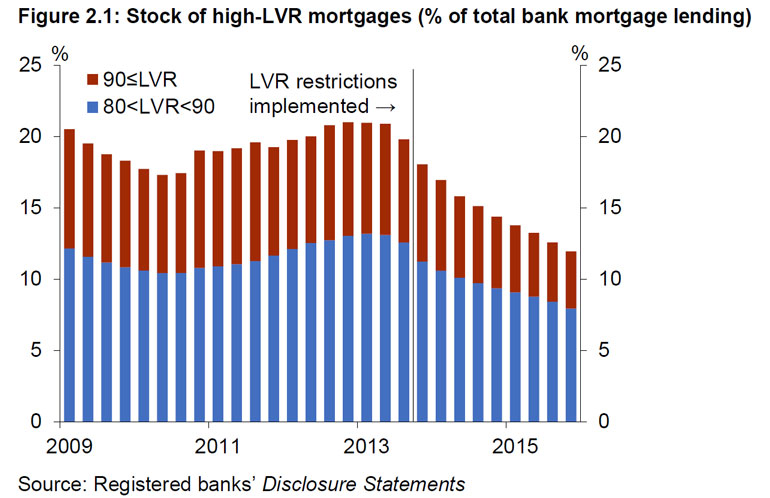
When the Bank had introduced LVR restrictions in 2013, they saw some markets slowing, but “House price pressures have re-emerged in Auckland following an easing in late 2015 and have also strengthened across other regions”.
New Zealand house price inflation began to accelerate again from around March 2016 as demand pressures intensified in Auckland. In the meantime, other regions were contributing to higher national house price inflation from mid-2015, particularly those areas adjacent to Auckland. Most regional centres are now experiencing annual house price inflation in excess of 8 percent. Similarly, sales activity increased across the country in the first half of 2016. Reflecting the underlying housing shortage, new listings have remained flat. Listings as a proportion of sales are now 40 percent below the previous low seen at the height of the pre-GFC boom in 2007.
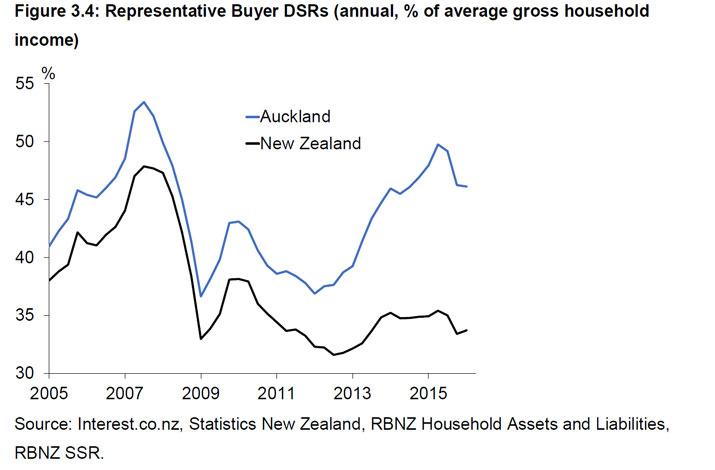
He also highlighted an increase in investor purchases, and significant mortgage refinance, including increased interest-only and high debt-to-income lending. New mortgage commitments are also elevated, running at an annual rate of 35%. Debt servicing ratios are also elevated.
Supply is not meeting demand he concluded. This is a recipe for potential disaster.
The longer the boom continues, the more likely we will see a severe correction that could pose real risks to the financial system and broader economy.
Mr Spencer said a broad range of initiatives is necessary to increase the long-term housing supply response, particularly in Auckland, and to help ensure housing demand is kept in line with supply capacity.
The Reserve Bank has no direct influence over supply, but can influence housing demand through the credit channel. In this regard, we see the Reserve Bank as part of a team effort.
A dominant feature of the housing resurgence has been an increase in investor activity, which increases the risk inherent in the current housing cycle.
The Reserve Bank is considering tightening Loan-to-Value Ratios (LVRs) further to counter the growing influence of investor demand in Auckland and other regions, and to further bolster bank balance sheets against fallout from a housing market downturn. Such a measure could potentially be introduced by the end of the year.
Limits on Debt-to-Income ratios (DTIs) might also have a role to play but would be a new instrument that would have to be agreed by the Minister of Finance under the Memorandum of Understanding on Macro-prudential policy. Further investigation of this option will be undertaken.
A third option is a housing capital overlay. The Reserve Bank has already indicated that it will be conducting a full review of bank capital requirements over the coming year.
Consideration might be given to further reducing the tax advantage of investing in residential housing. Supply side issues also need attention. But much of this lays beyond the remit of the Central Bank.
He concluded that the causes of the imbalances are complex with a number of important drivers on both the demand and supply side. Addressing these imbalances will require policy action by a variety of agencies on a number of fronts. The underlying housing shortage needs to be urgently addressed, particularly in Auckland where population growth continues to outstrip housing construction. A step up in supply is required and finalisation of the Auckland Unitary Plan will be a key opportunity to facilitate such a step.
On the demand side, the key drivers are population growth and easy credit. The low cost of credit is making higher debt levels affordable, particularly for investors who can deduct interest costs from taxable income. Residential investors are accounting for an increasing share of house sales and new mortgage credit.
The Bank’s interest rate policy must have regard to financial stability concerns, but the global environment is likely to keep interest rates low for some time yet. Macro-prudential policy can assist in containing the growing risk to financial stability as the current housing market reaches new extremes. In light of the growing risk, the Reserve Bank is closely considering measures that could be progressed in the coming months.