Credit rating agency Standard and Poor’s (S&P) has placed Australia’s AAA rating on credit watch negative from its previously stable outlook.
While S&P also said it had “affirmed our ‘AAA’ long-term and ‘A-1+’ short-term unsolicited sovereign credit ratings on Australia” the move to a negative outlook does imply Australia is now at a heightened risk of losing its AAA rating.
Worth noting too that S&P indicate that states and major banks are also on watch, which is logical considering that these entities rely directly or indirectly on Federal Government support, and a reduction in the rating of the “peak” body would flow through, leading to potentially higher funding costs. “The negative outlooks on these banks (Commonwealth, Westpac, ANZ and NAB) reflect our view that the ratings benefit from government support and that we would expect to downgrade these entities if we lower the long-term local currency sovereign credit rating on Australia,” S&P said.
S&P said in a statement accompanying the announcement that:
The negative outlook on Australia reflects our view that without the implementation of more forceful fiscal policy decisions, material government budget deficits may persist for several years with little improvement. Ongoing budget deficits may become incompatible with Australia’s high level of external indebtedness and therefore inconsistent with a ‘AAA’ rating.
Crucially S&P says it is “more pessimistic about the central government’s revenue outlook than the government was in its latest budget projections”.
In a strong message to both side of the political fence S&P said that because Australia carries a high level of net external debt “Australia’s general government sector fiscal outcomes need to be stronger than its peers’, and net debt needs to remain lower, to remain consistent with the current ‘AAA’ rating”.
That’s sounds ominous and S&P notes that “Australia’s external debt net of public and financial sector assets (our preferred stock measure) is over three times current account receipts (CARs)”. They also highlight that the current account deficit of 5% of GDP this year will “only moderate slightly during the forecast horizon to just over 3%”.
As a result “Australia’s 2016 gross external financing requirement of US$630 billion is over half of GDP,” S&P said.
That sounds ominous but S&P expects “Australia’s external borrowers to maintain easy access to foreign funding”.
Summing up what all of the above and the change to negative outlook means S&P said (our emphasis):
There is a one-in-three chance that we could lower the rating within the next two years if we believe that parliament is unlikely to legislate savings or revenue measures sufficient for the general government sector budget deficit to narrow materially and to be in a balanced position by the early 2020s.
The dollar reacted to the announcement, but has recovered somewhat since.
The latest Financial Stability report released by the Bank of England provides insights into the UK mortgage market, and some of the concerns the regulators are addressing. Of note is the information on “Buy-to-Let” loans, or Investment Mortgage Loans. Most striking is the strong concerns expressed about the rise to 17% of all loans being for this purpose. In Australia, by comparison, 35% of housing loans are for investment purposes. We also look at household debt ratios and countercyclical buffers.
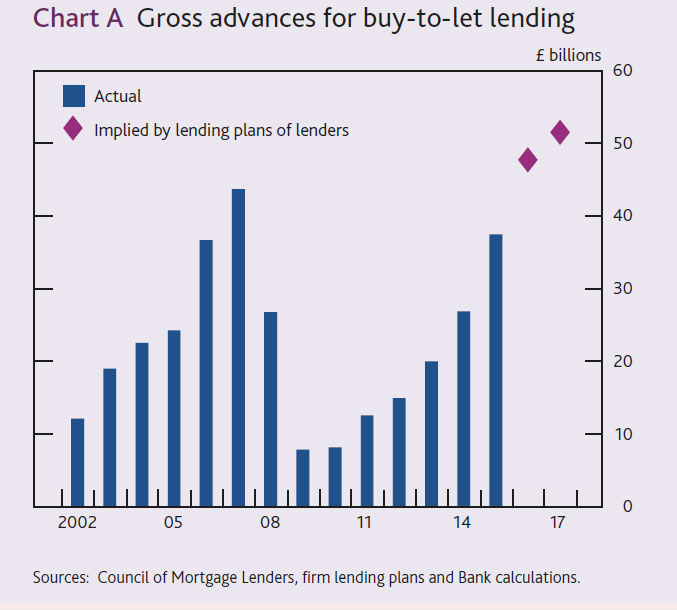
Buy-to-let mortgage lending has driven mortgage lending growth in recent years. Seventeen per cent of the stock of total secured lending is now accounted for by buy-to-let mortgages, and the gross flow of buy-to-let lending in 2015 was close to its pre-crisis peak.
The PRA conducted a review of underwriting standards in the buy-to-let mortgage market between November 2015 and March 2016. It reviewed the lending plans of the top 31 lenders in the industry, who account for over 90% of total buy-to-let lending. A number of lenders planned to increase their gross buy-to-let lending significantly, with overall planned lending in the region of £50 billion.
Given competition in the sector, this strong growth profile raises the risk that firms could relax their underwriting standards in order to achieve their plans. The review further highlighted that some lenders were already applying underwriting standards that were somewhat weaker than those prevailing in the market as a whole.
The draft Supervisory Statement aims: to ensure that buy-to-let lenders adhere to a set of minimum expectations around underwriting standards; and, to prevent a marked loosening in underwriting standards. It also clarifies the regulatory capital treatment of certain buy-to-let exposures.
At its March meeting, the FPC welcomed and supported the draft Supervisory Statement. The Supervisory Statement reflects microprudential objectives, aiming to reduce the risk that buy-to-let lenders make losses that can threaten their safety and soundness. From a macroprudential perspective, policies that prevent a slippage in buy-to-let underwriting standards should also reduce the threat of buy-to-let lending amplifying wider housing market risks. The FPC discussed that, although the 200 basis points increase in buy-to-let mortgage rates was lower than the interest rate stress applied to owner-occupied lending under the FPC’s June 2014 Recommendation, lenders tended to assess affordability for buy-to-let mortgages using interest cover ratios of at least 125%. In addition, loan-to-value ratios at origination in excess of 75% were less common in buy-to-let mortgages than in owner-occupied mortgages. Buy-to-let loans therefore typically started with a larger equity cushion for lenders, which reduced the associated credit risk in the first few years of the loan given that these loans were typically non-amortising. The FPC considered that no action beyond this was warranted for macroprudential purposes at that time. It will continue to monitor developments and potential threats to financial stability from the buy-to-let mortgage market closely, and stands ready to take action.
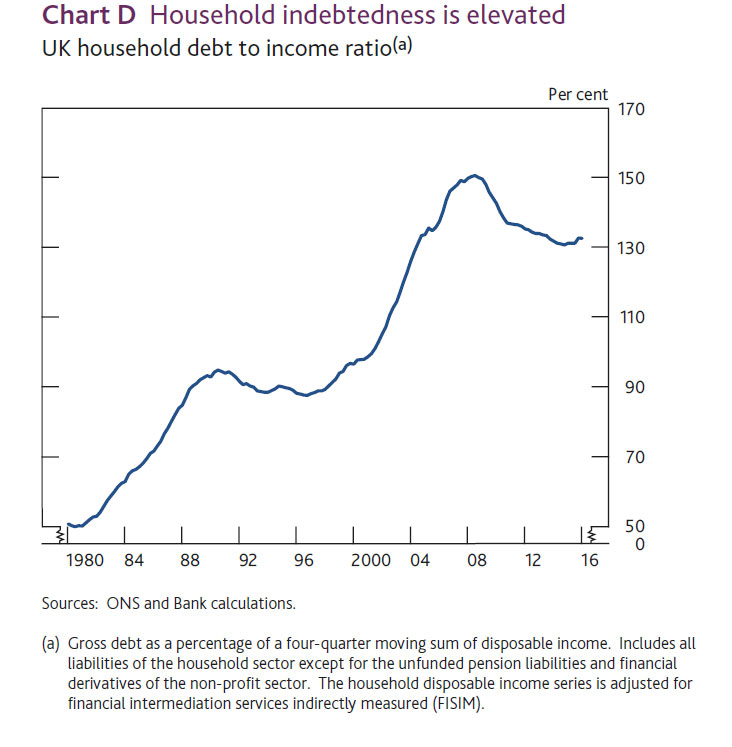
Another piece of data in the report is the household indebtedness. Worth comparing this with the RBA chart we highlighted yesterday, where the ratio in Australia is north of 175%.
More broadly, The Stability Report highlighted the risks to the UK economy, especially around Brexit. The webcast is worth listening to.
Of note is that fact that the regulators reduced the UK countercyclical capital buffer rate from 0.5% to 0% of banks’ UK exposures
with immediate effect, reflecting heightened risk and the wish to encourage banks to lend. Australia already has a zero percent buffer.
The FPC is reducing the UK countercyclical capital buffer rate from 0.5% to 0% of banks’ UK exposures with immediate effect. Absent any material change in the outlook, and given the need to give banks the clarity necessary to facilitate their capital planning, the FPC expects to maintain a 0% UK countercyclical capital buffer rate until at least June 2017. This action reinforces the FPC’s view that all elements of the substantial capital and liquidity buffers that have been built up by banks are able to be drawn on, as necessary, to allow them to cushion shocks and maintain the provision of financial services to the real economy, including the supply of credit and support for market functioning.
It will reduce regulatory capital buffers by £5.7 billion. For a banking sector that, in aggregate, targets a leverage ratio of 4%, this raises their capacity for lending to UK households and businesses by up to £150 billion.
In March, the FPC had begun to supplement regulatory capital buffers with the UK countercyclical capital buffer. This reflected its assessment that the risks the system could face were growing and additional capital was needed that could be released quickly in the event of an adverse shock.
At that time, the FPC judged that risks associated with domestic credit were no longer subdued, as they had been in the period following the financial crisis, and global risks were heightened. The Committee raised the UK countercyclical capital buffer rate to 0.5% and signalled its expectation that it would increase it further, to 1%, if the risk level remained unchanged. As set out in this Report, a number of economic and financial risks are materialising. The FPC strongly expects that banks will continue to support the real economy, by drawing on buffers as necessary.
Consistent with the FPC’s leverage ratio framework, the countercyclical leverage ratio buffer rate will also fall.
The Committee’s decision in March to raise the UK countercyclical capital buffer rate to 0.5% was due to take effect formally from 29 March 2017. However, as the Committee explained in March, there is an overlap between the risks captured by existing PRA supervisory capital buffers and a positive UK countercyclical capital buffer rate of 0.5%. The PRA Board concluded in March 2016 that, to ensure there is no duplication in capital required to cover the same risks, existing PRA supervisory buffers of PRA-regulated firms should be reduced, as far as possible, to reflect a UK countercyclical capital buffer rate of 0.5%, when such a rate came into effect.
The FPC has therefore accompanied its decision to reduce the UK countercyclical capital buffer rate with a Recommendation to the PRA that it bring forward this planned reduction in PRA supervisory capital buffers.
Recommendation: The FPC recommends to the PRA that, where existing PRA supervisory buffers of PRA-regulated firms reflect risks that would be captured by a UK countercyclical capital buffer rate, it reduce those buffers, as far as possible and as soon as practicable, by an amount of capital which is equivalent to the effect of a UK countercyclical capital buffer rate of 0.5%.
The PRA Board has agreed to implement this Recommendation. This means that three quarters of banks, accounting for 90% of the stock of UK economy lending, will, with immediate effect, have greater flexibility to maintain their supply of credit to the real economy. Other banks will no longer see their regulatory capital buffers increase over the next nine months, increasing their capacity to lend to UK households and businesses too.
Consistent with this, the FPC supports the expectation of the PRA Board that firms do not increase dividends and other distributions as a result of this action.
The world still needs the central banks to bail us out of trouble but the impact of monetary policy is complicated in a world of zero or near-zero interest-rate policy (ZIRP) and negative interest-rate policy (NIRP).
Money presents us with three alternatives: we can spend it, save it or invest it. Most households and governments do the first; financial institutions take the third option; and virtually no one saves. Except Asia, obviously.
In 2008, spending and investment froze during the global financial crisis (GFC). This forced central banks and governments to ultimately adopt unorthodox and largely unprecedented strategies. Two tools were available to governments: fiscal stimulus and looser monetary policy. Most governments adopted a mix of both.
However, there are political and financial limits to fiscal policy, particularly as governments grew increasingly overextended during the GFC. Consequently, since 2008, monetary policy has largely displaced fiscal policy as means of generating economic stimulus. Except in Sydney, at the Reserve Bank of Australia (RBA).
ZIRP it. ZIRP it good
The Bank of Japan (BoJ) was the first to adopt ZIRP, as it sought to deal with the aftershocks of the Heisei recession of the early 1990s. This was referred to as Japan’s “lost decade”, as it experienced stagnant growth, a condition still bedevilling the country today, despite the best efforts of Abenomics.
As the global financial crisis emerged throughout 2007–08, the US Federal Reserve, the European Central Bank (ECB) and the Bank of England sank hundreds of billions of their respective currencies into their foundering financial sectors. The People’s Bank of China injected massive liquidity into Chinese markets.
In Australia, the RBA slashed interest rates, with deep successive cuts in 2008–09. Looser monetary policy was matched by the Rudd government’s significant fiscal expansion to prevent the collapse of consumer spending.
The reason behind this fiscal pump priming, combined with the dramatic monetary measures, was clear: in late 2008, credit markets froze. Admittedly, there is much debate about how long and to what extent this occurred. However, the fear of contagion was so palpable that the interbank lending market experienced systemic dysfunction and, at the very least, credit rationing took place.
The problem for central banks is that they have relatively few monetary tools available to them. The traditional lever to prevent overheating is to exert monetary discipline by raising interest rates, thus increasing the cost of credit.
Conversely, under the crisis conditions of the GFC, the central banks slashed interest rates to encourage consumption. However, the US Federal Reserve, the Bank of Japan, the Bank of England and the European Central Bank reached their lower limits faster than the RBA, which never adopted ZIRP.
But that may be about to change. The RBA’s cash rate is at a historic low of 1.75%, and the bank may cut further as the Australian economy plateaus, combined with the uncertainty wrought by Brexit.
The new normal
Make no mistake: ZIRP and even perhaps NIRP are the new normal. Just ask Janet Yellen. When the Federal Reserve chairman increased US interest rates by 0.25% in December 2015, the markets reacted savagely. It was the first Federal Reserve (Fed) rate rise since 2006.
US Federal Reserve chair Janet Yellen.JIM LO SCALZO/AAP
Fourteen months earlier, Yellen had tapered off the US’s third quantitative easing program (QE3), ending it on schedule in October 2014. Between 2008 and 2014, the Fed had purchased over US$4.5 trillion in government bonds and mortgage-backed securities in three rounds of QE, plus a fourth program, Operation Twist (2011–12).
The outcome was an avalanche of “free” money. Why “free”? Because, in the long run, the real cost of the capital for commercial banks was zero, or less than zero.
The Fed was effectively printing money (although it’s more complex than that). The effects were clear: the US central bank was reflating the American economy, and by extension the global economy, by injecting massive amounts of liquidity into the system in an attempt to ameliorate the worst effects of the 2008–09 financial crisis.
US Fed moves this year
No one on the markets was surprised by the central bank’s December 2015 rate rise. The clear objective was to return some semblance of normality to global interest rates.
The problem is it didn’t work. The tapering-off of QE in late 2014 meant that the last sugar hits of stimulus were wearing off in 2015.
The Yellen rate rise, plus the clear intention of the Fed to incrementally drive rates higher, spooked the markets. In May this year, undeterred by gloomy US jobs figures, Yellen indicated that she would seek to raise US interest rates “gradually” and “over time” as US growth continued to improve. Her concern was that adherence to ZIRP would ultimately bite in the form of inflation.
Not anymore. Brexit has seen to that. It was one of the factors behind the Fed committee’s decision to keep interest rates on hold in mid-June.
ZIRP – or something approximating it – is becoming the “new normal” because cheap money has become structural; the global financial system is now structured around the persistence of low-cost credit. NIRP is thus the logical continuum of this downward interest rate spiral.
Negative interest zates
Until recently, most macroeconomic textbooks argued that zero was rock bottom for interest rates. The GFC shifted the goalposts.
This is where NIRP enters the picture: negative interest rates. How do they work? Typically, commercial banks will park their money in their accounts with the central bank, or in private markets, such as the London Interbank Offered Rate (LIBOR). Thus, their money never sleeps and earns interest 24/7, even when bank doors are shut.
But NIRP is different. Negative rates mean depositors pay for the privilege of a bank to hold their money. Which means depositors are better off holding the cash than placing the funds on deposit. Japan has experienced the results of a NIRP first-hand.
Bank of Japan (BOJ) Governor Haruhiko Kuroda decided to adopt negative interest rates.FRANCK ROBICHON/AAP
There is a method in this madness: the G7 central banks want commercial banks to lend, not to accumulate piles of cash. Consequently, the policy effect of both ZIRP and NIRP is to stimulate business and consumer lending in order to drive real economic activity. With piles of cash looking for investment placements, the shadow banking system of financial intermediaries may also drive enterprise investment.
However, ZIRP and NIRP are blunt instruments; the perverse outcomes of the stimulus programs of the US Fed, the Bank of Japan and the European Central Bank were artificially inflated stockmarkets and various sector bubbles (such as real estate, classic cars).
The combination of ZIRP and QE may have also created a “liquidity trap”. This means that central banks’ QE injections caused only a sugar rush and did not inflate prices, as one would normally expect from a significant expansion of the monetary base.
Instead, many developed countries have experienced multiple recessions and a prolonged period of deflation. In April this year, the Australian economy experienced deflation for the first time since the GFC, which compelled the RBA to make its most recent 0.25% cut in May 2016.
Yellen knows the global economy cannot retain ZIRP indefinitely. But, ironically, all of the central banks are caught in their own liquidity trap: unable to relinquish ZIRP for fear of market catastrophe; unwilling to abandon QE entirely as “the new normal” demands fresh injections of virtually cost-free credit.
A lack of interest
The Australian economy has done quite well by having interest rates above the OECD average, particularly since the GFC. This has encouraged significant foreign investment flows into Australia as global investors seek somewhere – anywhere – to park their cash as other safe-haven government bonds, such as the US, Japan and Germany, are in ZIRP or NIRP territory. It also doesn’t hurt that Australia’s major banks and government bonds are blue-chip-rated. And Australian sovereign bonds have excellent yields too.
If ZIRP is the new normal, that matters to the Reserve Bank of Australia. It also matters to all Australian home buyers, businesses, banks, pensioners, investors, students and credit card holders. Everyone, in other words.
ZIRP has created hordes of winners: mortgage interest rates are at historic lows. Property buyers who borrowed when rates were relatively high (at, say, 6-7%) are now paying less than 4%. Credit card rates are still astronomically high (20–21% or more), but balance transfer rates are zero. New credit issues in terms of consumer debt represented by unsecured loans (which is what a credit card is) have a real capital cost of zero. This is virtually unprecedented.
But ZIRP or near-ZIRP produces many losers as well. There is no incentive to save because rates are so low. Hoarding cash makes no sense.
Global surplus capacity reinforces deflation as both goods and commoditised services are cheap. Wages are terminal. Pension funds’ margins are smaller, thus expanding future liabilities and reducing the value of current superannuation yields.
In a world of ZIRP, is it any wonder that all of this cheap or (effectively) free cash has been stuffed into the global stock exchange and real estate markets, creating not only a double bubble, but double trouble?
The best things in life are free
QE is like heroin: the first hit is always free. The commercial banks got their first hit in 2008 and the prospect of going cold turkey sends them into paroxysms of fear.
The problem is that the dealers – the central banks – have started using their own product and are just as hopelessly addicted to both ZIRP and QE. To rudely cut off supply would destroy their own markets.
The RBA is not immune to the elixir of ZIRP. No central bank wants to assume responsibility for a recessionary economy; the RBA took enough heat for its monetary policy mismanagement of 1989-90, which induced the 1990s recession.
Unlike the Fed, the RBA is not about to fire up the printing presses and engage in rounds of QE, if it runs out of tools and is compelled to adopt ZIRP. The RBA is too conservative to engage in such policy in any case.
But this conservatism has a direct impact upon federal government fiscal policy, irrespective of whether the LNP or the ALP is in power. From Rudd to Turnbull, Treasury has been forced to increase its borrowing time and time again, blowing out the forward fiscal projections year after year.
No government has delivered a surplus because it is no longer possible. The RBA is partly responsible for this because, rather than expanding its balance sheet via QE, it has forced Canberra to accumulate government debt of more than $AU400 billion, which the overburdened Australian taxpayer will pay for.
Like most drug deals, this will not end well.
Author: Remy Davison, Jean Monnet Chair in Politics and Economics, Monash University
Today’s RBA note highlights that inflation will remain low for some time. This is a problem lodged firmly in many economies with ever lower cash rates. Assuming the RBA sticks to their 2-3% target, this leaves the door open for another rate cut. However, we should also question whether even lower rates would have a net positive impact on growth, as savers would take another hit, businesses would be no more willing to borrow, whilst home lending would be stimulated further and it could also stoke investor housing as capital growth is still in play. All up, not a nice cocktail, when incomes are static or falling in real terms. Perhaps some latitude on the inflation target would make more sense.
At its meeting today, the Board decided to leave the cash rate unchanged at 1.75 per cent.
The global economy is continuing to grow, at a lower than average pace. Several advanced economies have recorded improved conditions over the past year, but conditions have become more difficult for a number of emerging market economies. China’s growth rate has moderated further, though recent actions by Chinese policymakers are supporting the near-term outlook.
Commodity prices are above recent lows, but this follows very substantial declines over the past couple of years. Australia’s terms of trade remain much lower than they had been in recent years.
Financial markets have been volatile recently as investors have re-priced assets after the UK referendum. But most markets have continued to function effectively. Funding costs for high-quality borrowers remain low and, globally, monetary policy remains remarkably accommodative. Any effects of the referendum outcome on global economic activity remain to be seen and, outside the effects on the UK economy itself, may be hard to discern.
In Australia, recent data suggest overall growth is continuing, despite a very large decline in business investment. Other areas of domestic demand, as well as exports, have been expanding at a pace at or above trend. Labour market indicators have been more mixed of late, but are consistent with a modest pace of expansion in employment in the near term.
Inflation has been quite low. Given very subdued growth in labour costs and very low cost pressures elsewhere in the world, this is expected to remain the case for some time.
Low interest rates have been supporting domestic demand and the lower exchange rate since 2013 is helping the traded sector. Financial institutions are in a position to lend and credit growth has been moderate. These factors are all assisting the economy to make the necessary economic adjustments, though an appreciating exchange rate could complicate this.
Indications are that the effects of supervisory measures have strengthened lending standards in the housing market. Separately, a number of lenders are also taking a more cautious attitude to lending in certain segments. Dwelling prices have risen again in many parts of the country over recent months. But considerable supply of apartments is scheduled to come on stream over the next couple of years, particularly in the eastern capital cities.
Taking account of the available information, the Board judged that holding monetary policy steady would be prudent at this meeting. Over the period ahead, further information should allow the Board to refine its assessment of the outlook for growth and inflation and to make any adjustment to the stance of policy that may be appropriate.
APRA has issued an update on Australian Bank capital ratios. They show that banks in Australia have lifted their capital base in the past year, (e.g. CET1 from 11.7% to 13.5% on an international comparison basis at December 2015), but APRA also underscores the fact that even higher capital ratios will be required to meet tighter rules, and to ensure that local banks do not slip down the international ranking, so as to maintain their ratios as “unquestionably strong”. This is because regulators are driving ratios higher in many countries.
Higher capital costs of course, and in in the normal course of business, will lead to more expensive loans and lower returns to shareholders. We think dividends will be under pressure in the next couple of years.
It is also worth saying that APRA is disclosing aggregate data, so variations across individual banks will be masked. This makes an interesting comparison to data from the FED where the results of capital stress tests are reported at an institution level. We think APRA should report capital ratios by individual institution, but of course they won’t.
In July 2015, APRA published the Information Paper International capital comparison study (2015 study) as an important first step in addressing the Financial System Inquiry (FSI) recommendation to set capital standards such that Australian authorised deposit-taking institution (ADI) capital ratios are ‘unquestionably strong’.
In its final report, the FSI suggested that for banks to be regarded as unquestionably strong they should have capital ratios that position them in the top quartile of internationally-active banks. APRA’s 2015 study, which adjusted for differences in measurement methodology across jurisdictions and uses a number of different measures of capital strength, found that the Australian major banks were well-capitalised, but not in the top quartile of international peers.
In particular, APRA’s 2015 study found that, based on the major banks’ capital adequacy ratios at 30 June 2014, a 70 basis point (bp) increase in capital ratios would be required to position the major banks’ Common Equity Tier 1 (CET1) ratio at the international 75th percentile (i.e. the bottom of the top quartile) and that they would likely need to increase their capital adequacy ratios by a larger amount to be comfortably positioned in the top quartile over the medium to long term.
The Basel Committee on Banking Supervision (Basel Committee) recently published an updated quantitative impact study (QIS)1 including the capital ratios of internationally active banks as of 30 June 2015. Based on the same methodology used in APRA’s 2015 study and using the latest Basel QIS, APRA has recently reviewed the major banks’ relative position to their international peers. To incorporate the capital raisings undertaken by the major banks, particularly during the second half of 2015, this update is based on their capital ratios as at December 2015.
As detailed in APRA’s 2015 study, the major banks’ weighted average comparison CET1 ratio was estimated as 11.7 per cent as at June 2014. Chart 1 shows that by December 2015, this ratio had increased by 180 bps to 13.5 per cent. This increase was the result of a range of factors, but the largest single driver was the substantial capital raisings by the major banks in the latter part of 2015. The differential between the CET1 ratio under APRA’s requirements and the international comparison ratio also increased: in broad terms, the differential as at December 2015 was 350 basis points.
On a relative basis, the strengthening of the major banks’ CET1 ratios placed them, on average, at approximately 40 bps above the June 2015 Basel QIS 75th percentile of 13.1 per cent for Group 1 banks.2 The improvement in the relative position of the major banks in Chart 1 is likely to be somewhat overstated by the timing differences between the international (June 2015) and Australian (December 2015) data. On average, the 75th percentile CET1 ratio in the Basel QIS has tended to increase by approximately 25-35 basis points each half year, suggesting the 75th percentile would be somewhat higher had December 2015 QIS data been available to APRA. Nevertheless, notwithstanding this timing difference, the relative positioning of the Australian major banks’ CET1 ratios now seems broadly in line with the benchmark suggested by the FSI.
Chart 1: CET1 ratios of Basel QIS and major banks3
Source: APRA data
Furthermore, since the 2015 study the relative position of the major banks’ other weighted average comparison capital ratios have improved compared to the distribution of Basel QIS Group 1 banks.4 As shown in Chart 2, the major banks’:
comparison Tier 1 ratio of 14.8 per cent is positioned in the top quartile as compared to the third quartile as at June 2014; and
comparison Total capital ratio of 16 per cent is positioned at the bottom of the top quartile as compared to the median of the distribution as at June 2014.
The relative position of the major banks’ Tier 1 Leverage ratio of 5.4 per cent has also increased to a level above the median (but still below the top quartile) of the distribution of Basel QIS Group 1 banks. This compares to the banks’ position below the median in the 2015 study.
Chart 2: Capital adequacy ratios of Basel QIS (June 2015) and major banks (Dec 2015)
Source: APRA data
As noted above the major banks have undertaken significant capital raisings since the 2015 study, which has significantly improved their capital adequacy positon relative to international peers. That said, the trend of international peer banks strengthening their capital ratios continues. Forthcoming international policy developments will also likely mean that Australian banks need to continue to improve their capital ratios in order to at least maintain, if not improve, their relative positioning. The final design and calibration of these reforms will not be decided until around the end of 2016, and it would be prudent for Australian ADIs to continue to plan for the likelihood of strengthened capital requirements in some areas.
As detailed in the 2015 study, APRA’s analysis on the relative positioning of major bank capital ratios is intended to inform, but not determine, its approach for setting capital adequacy requirements. Recent regulatory actions (such as that applying to mortgage risk weights announced in July 2015), and the resulting improvement in the major banks’ international capital comparison, provide the necessary time for APRA to consider the full range of factors that are relevant to satisfy the FSI’s unquestionably strong recommendation. Critically this includes assessing the impact of the Basel Committee reforms as they are finalised and considering how other measures of resilience, such as liquidity, funding, asset quality, and recovery and resolution planning can assist in achieving the FSI’s objective.
APRA intends to provide further insight to these broader considerations once the Basel Committee has completed its deliberations on the international framework around the end of 2016.
1 Basel Committee, Basel III monitoring report, March 2016.
2 Basel QIS Group 1 banks comprises approximately 100 internationally active banks with Tier 1 capital of more than 3 billion Euros.
3 In Charts 1 and 2 the Australia (headline) ratios are determined under APRA’s prudential framework. The Australia (Basel QIS) ratios are derived from the Basel QIS which requires banks to report their regulatory capital base in an internationally-consistent manner. The Australia (comparison ratio) ratios are calculated using the methodology set out in the 2015 study.
4 Consistent with the 2015 study the reported Basel QIS and comparison Tier 1 and comparison Total capital adequacy ratios have not been adjusted for the impact of transitional legacy capital as this issue affects banks in most jurisdictions. The major banks’ headline Total capital ratio is higher than their Basel QIS Total capital ratio as APRA’s framework allows for phasing out of legacy capital instruments
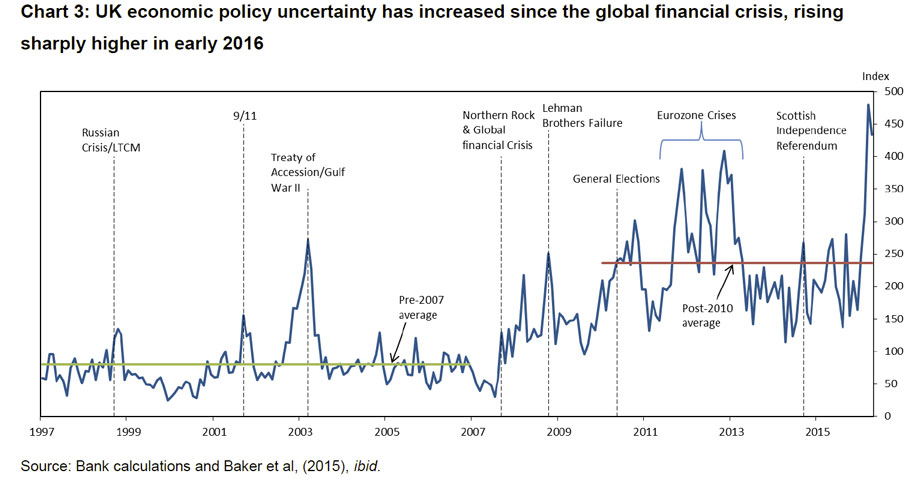
In a speech entitled “Uncertainty, the economy and policy“, given by Mark Carney, Governor of the Bank of England, he highlights that waves of uncertainty are washing over the UK economy, and these waves are getting larger. The result of the referendum is clear. Its full implications for the economy are not. But the question is not whether the UK will adjust but rather how quickly and how well. As risks have risen, further monetary policy interventions are likely, but he says there are limits to how much can be achieved with these levers.
… The decision to leave the European Union marks a major regime shift. In the coming years, the UK will redefine its openness to the movement of goods, services, people and capital. In tandem, a potentially broad range of regulations might change.
Uncertainty over the pace, breadth and scale of these changes could weigh on our economic prospects for some time. While some of the necessary adjustments may prove difficult and many will take time, the transition from the initial shock to the restructuring and then building of the UK economy will be much easier because of our solid policy frameworks.
At times of great uncertainty, households, businesses and investors ask basic economic questions. Will inflation remain under control? Will the financial system do its job?
In recent years, economic uncertainty has been elevated because of fragilities in the financial system and overhangs of public and private debt.
These challenges have been compounded by deeper forces that have radically altered the balance of saving and investment in the global economy. In the process, these have moved equilibrium interest rates into regions that monetary policy finds difficult to reach. Whether called ‘secular stagnation’ or a ‘global liquidity trap’, the drag on jobs, wages and growth is real.
All this uncertainty has contributed to a form of economic post-traumatic stress disorder amongst households and businesses, as well as in financial markets – that is, a heightened sensitivity to downside tail risks, a growing caution about the future, and an aversion to assets or irreversible decisions that may be exposed to future ‘disaster risk’.
Even before 23rd June, we observed the growing influence of uncertainty on major economic decisions. Commercial real estate transactions had been cut in half since their peak last year. Residential real estate activity had slowed sharply. Car purchases had gone into reverse. And business investment had fallen for the past two quarters measured. Given otherwise accommodative financial conditions and a solid domestic outlook, it appeared likely that uncertainty related to the referendum played an important role in this deceleration.
It now seems plausible that uncertainty could remain elevated for some time, with a more persistent drag on activity than we had previously projected. Moreover, its effects will be reinforced by tighter financial conditions and possible negative spill-overs to growth in the UK’s major trading partners.
As the MPC said prior to the referendum, the combination of these influences on demand, supply and the exchange rate could lead to a materially lower path for growth and a notably higher path for inflation than set out in the May Inflation Report. In such circumstances, the MPC will face a trade-off between stabilising inflation on the one hand and avoiding undue volatility in output and employment on the other. The implications for monetary policy will depend on the relative magnitudes of these effects.
Today, while the economy is more complex and our models less reliable, the Bank has identified the clouds on the horizon and can see that the wind has now changed direction.
Over the past few months, working closely with the Chancellor and with HM Treasury, we put in place contingency plans for the initial market shocks. They are working well.
Over the coming weeks, the Bank will consider a host of other measures and policies to promote monetary and financial stability.
In short, the Bank of England has a plan to achieve our objectives, and by doing so support growth, jobs and wages during a time of considerable uncertainty.
Part of that plan is ruthless truth telling. And one uncomfortable truth is that there are limits to what the Bank of England can do.
In particular, monetary policy cannot immediately or fully offset the economic implications of a large, negative shock. The future potential of this economy and its implications for jobs, real wages and wealth are not the gifts of monetary policymakers.
These will be driven by much bigger decisions; by bigger plans that are being formulated by others. However, we will relentlessly pursue monetary and financial stability. And by doing so we will facilitate the adjustments needed to realise this economy’s full potential.
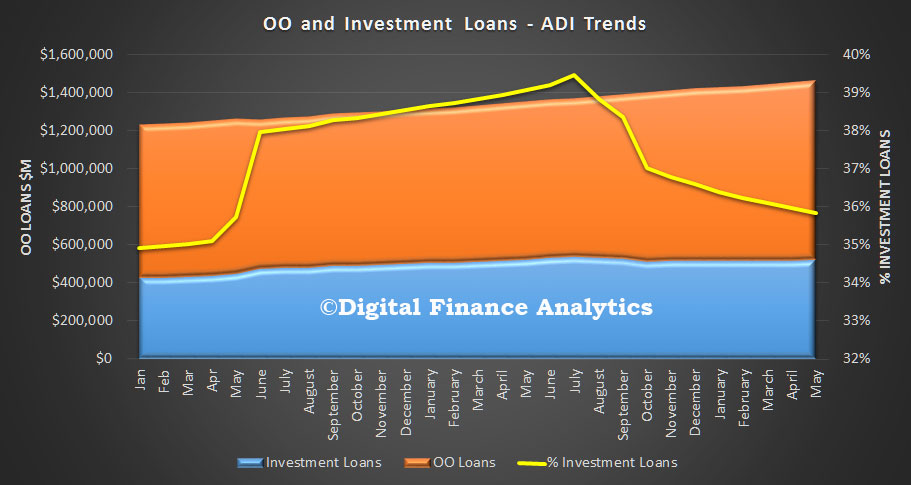
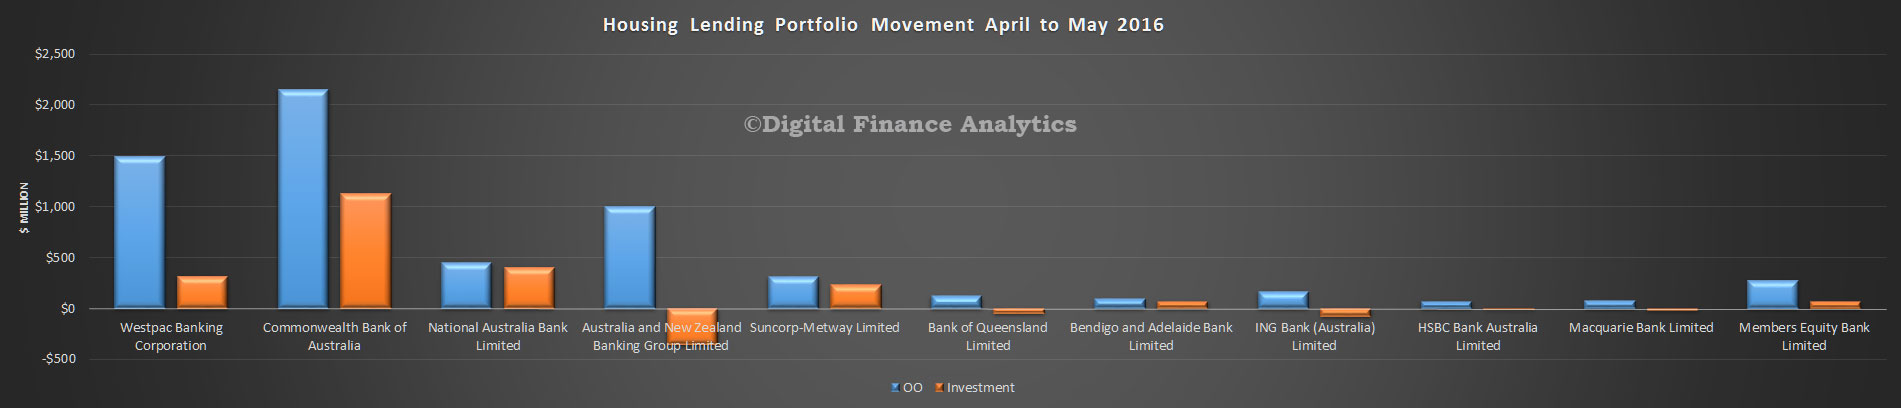
The latest data from APRA provides an insight into the relative movements between players in the home loan market as well as the total book held by ADIs. The RBA today released their aggregate data to May. APRA data shows that total home loans by ADI’s grew by 0.9% in the month, from $1.45 trillion in April to $1.46 in May, up $13 billion. Of this $10.2 billion was for owner occupied loans and $2.8 billion for investment lending, which has gained momentum recently. Total owner occupied loans were worth $938 billion, and investment loans $524 billion, or 35.9% of book.
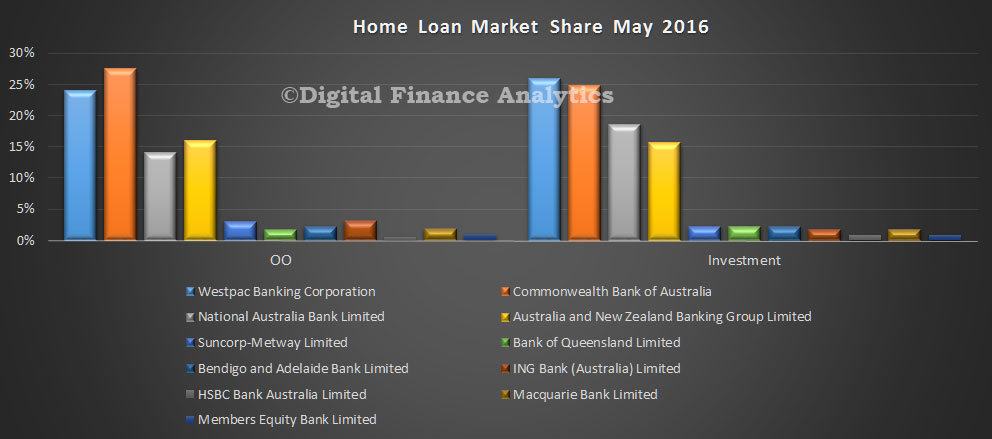
Looking at the monthly movements in absolute dollar terms, CBA grew its book the most, with a hike in both owner occupied and investment lending. Westpac grew its owner occupied book more, compared with its investment loans book, though it still has the largest share.
Overall the relative shares changed but slightly.
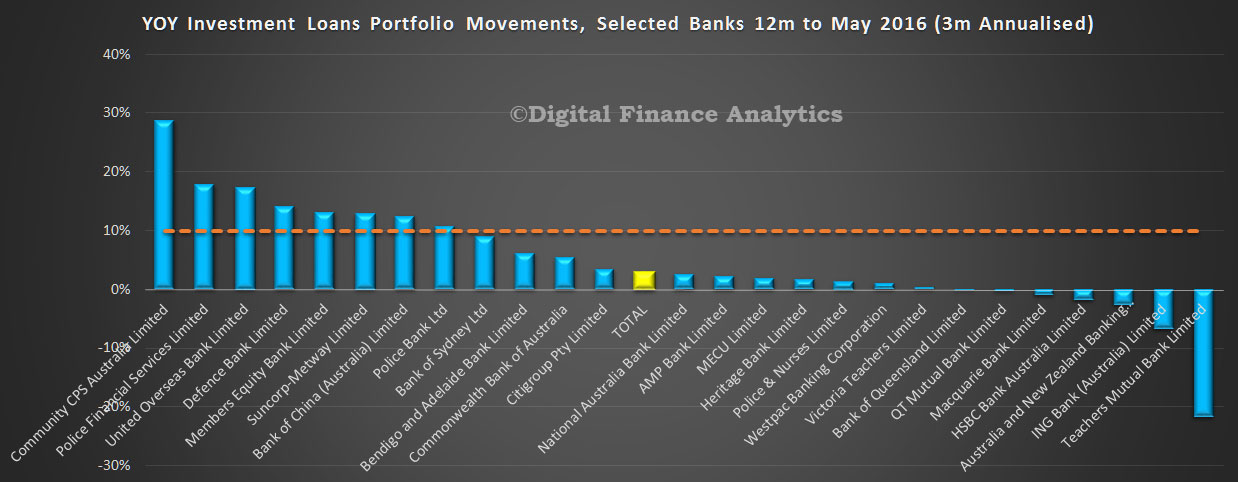
Finally, we cross-checked the speed limits for investment loans at 10% (not a squeak from APRA as to whether this limit still applies by the way). The majors are all well below, which gives them capacity to make more investor loans in coming months. This is based on a 3 month rolling average, annualised. It will still be noisy, as more than $1bn of loans were switched between categories in the month.
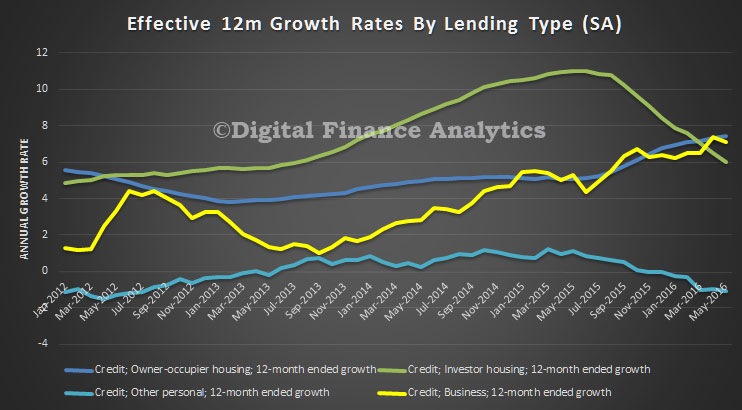
The RBA released their Financial Aggregates for May 2016. Total housing grew by 0.5% in May, compared with 0.4% in April. Business lending grew by 0.3%, compared with 0.8% in April. Personal credit fell again by 0.1%. Housing lending overall lifted by $7.5bn, of which $6.5 bn was for owner occupation and $0.9bn for investor loans. Total housing loans are now $1.56 trillion, another record and comprise 61% of all loans outstanding.
Annual growth rates for home lending is 6.5%, compared with 6.2% in May 2015, Business was 7.1%, compared with 5.3% last year, and Personal lending was down 1.1% to May 2016, compared with up 1.1% this time last year.
A further $1.1 bn of loans were switched between owner occupied and investment housing loan categories.
Following the introduction of an interest rate differential between housing loans to investors and owner-occupiers in mid-2015, a number of borrowers have changed the purpose of their existing loan; the net value of switching of loan purpose from investor to owner-occupier is estimated to have been $41 billion over the period of July 2015 to May 2016 of which $1.1 billion occurred in May. These changes are reflected in the level of owner-occupier and investor credit outstanding. However, growth rates for these series have been adjusted to remove the effect of loan purpose changes.
New standards on how much businesses can surcharge their customers for credit or debit card purchases start in September. However, it’s not clear how the rules will be policed and whether this will lead to all businesses enforcing a surcharge, rather than just those who choose to.
The Reserve Bank of Australia (RBA) has revised the regulations, aiming to limit the amount merchants can surcharge customers for paying by credit or debit cards. The new rules will initially apply to large merchants, defined as those employing over 50 staff, as these businesses are seen to be overcharging the most.
Businesses have been able to add on surcharges to these type of purchases in Australia since January 2003. This was part of RBA regulatory interventions in the first place, as it originally allowed merchants to surcharge in order to recover the costs of accepting card payments. The surcharges can be ad valorem (in proportion to the value of the transaction) or a fixed dollar amount.
A current example is that taxi fares using a Cabcharge terminal, whether they be paid by charge, credit or debit card, are surcharged at the same ad valorem level of 5%, as a processing fee. Not all the goods and services suppliers who accept card payments chose to impose surcharges on their customers, but a significant and seemingly ever increasing of them do surcharge.
The Australian airlines are well known for their fixed dollar surcharges. Qantas charges a card payment fee (per passenger, per booking) of $2.50 for debit and $7.00 for credit, on domestic flights and $10 for debit and $30 for credit, on international flights.
JetStar charge a booking and service fee (per passenger, per flight) of $8.50 domestic and up to $12.50 for international, whilst Virgin charges a Fee of $7.70 for payments made by credit or debit card. These examples of surcharging have caused much angst amongst consumers and the recent Financial System Inquiry had over 5,000 submissions to its final report, complaining about surcharging, particularly by airlines.
But how will the new standards be enforced? In February, The Australian Competition and Consumer Commission (ACCC) was given the power to issue infringement notices worth up to just over $100,000 to listed corporations who charge their customers excess payment card surcharges
These are defined as charges that exceed the costs of acceptance of payment cards. It remains to be seen if the size of these penalties deters merchants from excessive surcharging.
In May, the RBA published new standards as to the average cost a merchant is permitted to charge for accepting credit or debit cards. These apply to the following so-called card schemes, EFTPOS; MasterCard credit and debit; Visa credit and debit and American Express companion cards, issued by Australian banks.
Under the new rules the average cost of accepting a debit or credit card is defined in percentage terms of cost of the transaction. This will vary by merchant, but it means that merchants will not be able to levy fixed dollar surcharges.
The permitted surcharge for an individual merchant will be based on an average of their card costs over a 12 month period. In the interests of transparency, the financial institution who processes each merchant’s transactions, will be required to provide regular statements of the average cost of acceptance for each of the card schemes.
This information will of course also be important for the ACCC in any cases where enforcement is required if merchants are surcharging excessively.
Now that surcharges are well defined by the RBA, the risk is that surcharging will become a normal extra charge like GST, an unintended consequence of the new rules. Also why should merchants be allowed to charge their customer a surcharge for such payments, which are surely just another cost of doing business, just as is their utility bills and employee wages?
The ACCC is currently finalising guidance material for consumers and merchants which will provide further information on the ACCC’s enforcement role and how consumers can make complaints if they believe that a surcharge is excessive.
Surcharges on card payments have certainly already provoked rage amongst consumers, the final question is, will the next iteration of surcharge standards make surcharging the norm?
Author: Steve Worthington, Adjunct Professor, Swinburne University of Technology
The Federal Reserve Board has announced it has not objected to the capital plans of 30 bank holding companies participating in the Comprehensive Capital Analysis and Review (CCAR). The Board objected to two firms’ plans. One other firm’s plan was not objected to, but the firm is being required to address certain weaknesses and resubmit its plan by the end of 2016.
CCAR, in its sixth year, evaluates the capital planning processes and capital adequacy of the largest U.S.-based bank holding companies, including the firms’ planned capital actions such as dividend payments and share buybacks and issuances. Strong capital levels act as a cushion to absorb losses and help ensure that banking organizations have the ability to lend to households and businesses even in times of stress.
When considering a firm’s capital plan, the Federal Reserve considers both quantitative and qualitative factors. Quantitative factors include a firm’s projected capital ratios under a hypothetical scenario of severe economic and financial market stress. Qualitative factors include the strength of the firm’s capital planning process, which incorporate the risk management, internal controls, and governance practices that support the process. The Federal Reserve may object to a capital plan based on quantitative or qualitative concerns. If the Federal Reserve objects to a capital plan, a firm may not make any capital distribution unless expressly authorized by the Federal Reserve.
“Over the six years in which CCAR has been in place, the participating firms have strengthened their capital positions and improved their risk-management capacities,” Governor Daniel K. Tarullo said. “Continued progress in both areas will further enhance the resiliency of the nation’s largest banks.”
The Federal Reserve did not object to the capital plans of Ally Financial, Inc.; American Express Company; BancWest Corporation; Bank of America Corporation; The Bank of New York Mellon Corporation; BB&T Corporation; BBVA Compass Bancshares, Inc.; BMO Financial Corp.; Capital One Financial Corporation; Citigroup, Inc.; Citizens Financial Group; Comerica Incorporated; Discover Financial Services; Fifth Third Bancorp; Goldman Sachs Group, Inc.; HSBC North America Holdings, Inc.; Huntington Bancshares, Inc.; JP Morgan Chase & Co.; Keycorp; M&T Bank Corporation; MUFG Americas Holdings Corporation; Northern Trust Corp.; The PNC Financial Services Group, Inc.; Regions Financial Corporation; State Street Corporation; SunTrust Banks, Inc.; TD Group US Holdings LLC; U.S. Bancorp; Wells Fargo & Company; and Zions Bancorporation. M&T Bank Corporation met minimum capital requirements on a post-stress basis after submitting an adjusted capital action.
The Federal Reserve did not object to the capital plan of Morgan Stanley, but is requiring the firm to submit a new capital plan by the end of the fourth quarter of 2016 to address certain weaknesses in its capital planning processes. The Federal Reserve objected to the capital plans of Deutsche Bank Trust Corporation and Santander Holdings USA, Inc. based on qualitative concerns. The Federal Reserve did not object to any capital plans based on quantitative grounds.
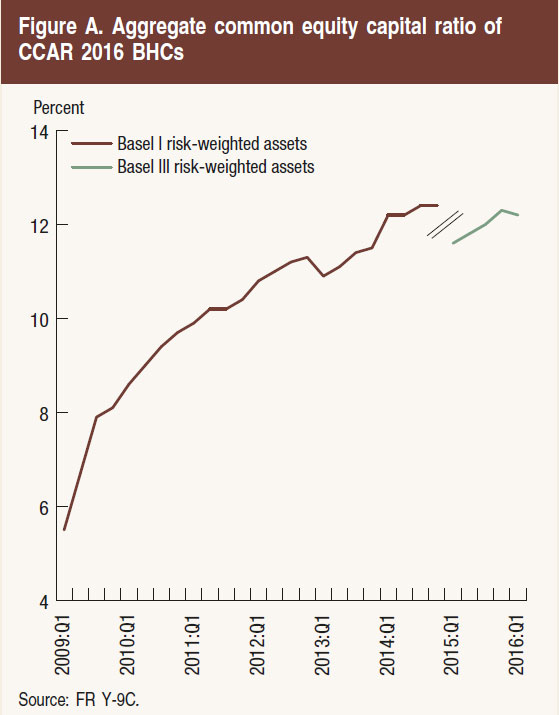
U.S. firms have substantially increased their capital since the first round of stress tests led by the Federal Reserve in 2009. The common equity capital ratio–which compares high-quality capital to risk-weighted assets–of the 33 bank holding companies in the 2016 CCAR has more than doubled from 5.5 percent in the first quarter of 2009 to 12.2 percent in the first quarter of 2016. This reflects an increase of more than $700 billion in common equity capital to a total of $1.2 trillion during the same period.