Is The Root Cause Of High House Prices What You Think It Is?

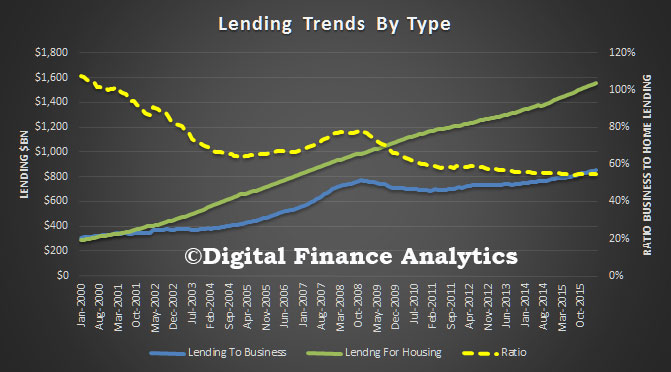
A snapshot of data from the RBA highlights the root cause of much of the economic issues we face in Australia. Back at the turn of the millennium, banks were lending relatively more to businesses than to households. The ratio was 120%. Roll this forward to today, and the ratio has dropped to below 60%. In other words, for every dollar lent now it is much more likely to go to housing than to business. This is a crazy scenario, as we have often said, because lending to business is productive – this generates real productive growth – whilst lending for housing simply pumps up home prices, bank balance sheets and household balance sheets, but is not economically productive to all.

Lending-MixThere are many reasons why things have changed. The finance sector has been deregulated, larger companies can now access capital markets directly and so do not need to borrow from the bank, generous tax breaks (negative gearing and capital gains) have lifted the demand for loans for housing investment, and the Basel capital ratios now make it much cheaper for banks to lend against secured property compared to business. In fact the enhanced Basel ratios were introduced in the early 2000’s and this is when we see lending for housing taking off.

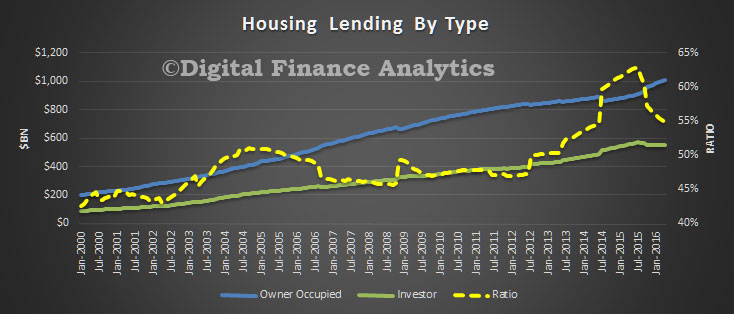
So how much of the mix is explained by tax breaks for investors? If we look at the ratio of home lending for owner occupation, to home lending for investment, there has been an increase. In 2000, it was around 45%, now its 55% (with a peak above 60% last year). This relative movement though is much smaller compared with the switch away from lending to business.  Something else is driving it.

RBA-Mix-HousingWe therefore argue that whilst the election focus has been on proposed cuts to negative gearing and capital gains versus a company tax cut, the root cause issue is still ignored. And it is a biggie. The international capital risk structures designed to protect depositors, is actually killing lending to business, because it makes lending for housing so much more capital efficient. Whilst recent changes have sought to lift the capital for mortgages at the margin, it is still out of kilter. As a result, banks seek to out compete for mortgages and offer discounts and other incentives to gain share, whilst lending to business is being strangled. This is exacerbated by companies being more risk adverse, using high project hurdle thresholds (despite low borrowing rates) and smaller businesses being charged relatively more – based on risk assessments which are directly linked to the Basel ratios. Our SME surveys underscore how hard it is for smaller business to get loans at a reasonable price.

The run up in house prices is a direct result of more available mortgage funding, and this in turn leaves first time buyers excluded from the market. But it is too simple to draw a straight line between negative gearing and first time buyer exclusion. The truth is much more complex.

We are not convinced that a corporate tax cut, or a further cut in interest rates will stimulate demand from the business sector. Nor will reductions in negative gearing help that much. We need to re-balance the relative attractiveness of lending to business versus lending for housing.  The only way to do this (short of major changes to the Basel ratios) is through targeted macro-prudential measures. In essence lending for housing has to be curtailed relative to lending to business. And that is a whole new box of dice!


RBNZ Enhances Mortgage Reporting – 40% New Loans Interest Only

The New Zealand Reserve Bank has introduced new statistics on residential mortgage lending by payment type (i.e. interest-only and principal-and-interest). ‘Investor’ and ‘owner-occupiers’ are defined by the intended use of borrowed funds. A particular loan application may include a portion of both interest only and principal-and-interest payment terms. Figures in the new table represent the balance of new and existing lending for each payment type, not the number of loans.

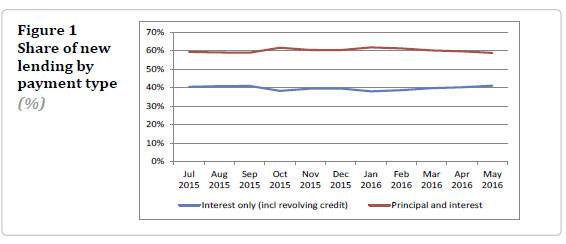
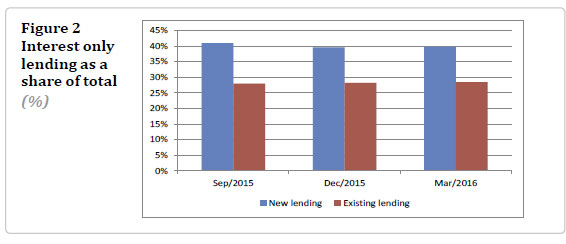
In May 2016, almost 60 percent of all new mortgage lending was on principal-and-interest payment terms, while 40 percent was on interest-only payment terms. These proportions have been fairly stable since July 2015 when the data was first available. RBNZ-Int1Interest-only loans tend to convert to principal-and-interest loans after a period of time. In March 2016, 40 percent of new lending was on interest-only payment terms. However on the banks’ loan books only 28 percent of all existing mortgages are on interest-only payment terms. These proportions have been fairly steady over time.

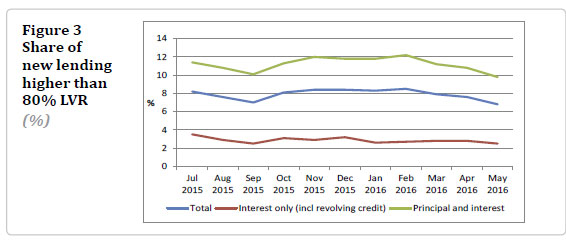
RBNZ-Int2Interest-only lending is less likely to be high loan-to-value ratio (LVR greater than 80 percent) compared to principal-and-interest lending. The proportion of high LVR new lending has
declined slightly for all payment types since data was first available in July 2015. The portion of high LVR lending for all existing mortgages is somewhat higher than for new lending (12.9 percent compared to 7.9 percent in March 2016) but this has also been declining over time. The lower ‘high-LVR’ portion on new lending is due to the LVR restrictions, which will gradually filter through to existing lending as new lending is added to the banks’ loan books.

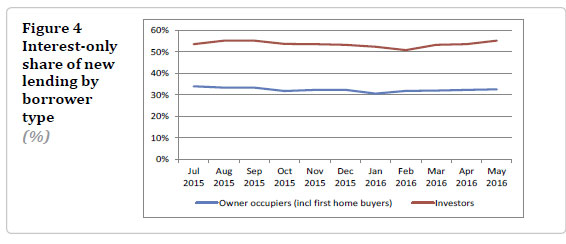
RBNZ-Int3In May 2016, about 55 percent of new lending for investor purposes was on interest-only terms compared to about 33 percent for owner-occupier purposes.These proportions have
been fairly steady over time. Only 1 percent of interest-only lending for investor purposes is above 80 percent LVR and this has been declining over time.

RBNZ-Int4

Property price to income ratio is rising in Sydney, Melbourne and Canberra

From CoreLogic.

Utilising quarterly household income data from the Australian National University, CoreLogic has developed quarterly measurements of the ratio of property prices to annual household income.  This data is extremely valuable when looking to measure housing affordability.  The measure is available at a number of different geographies from SA2 regions (generally about the size of a suburb or group of suburbs) all the way up to GCCSA (capital city and rest of state) regions.  When looking at the analysis it is important to note that a higher ratio means housing is less affordable and a lower ratio indicates better affordability.

Chart 1
With property prices varying greatly between each of the capital cities it is interesting to note that the variation in household incomes in nowhere near as large.  In March 2016, Hobart had the lowest median dwelling price at $337,250 and Sydney had the highest median price at $775,000.  Meanwhile, household incomes range from as low as $1,175/week in Hobart to $2,118/week in Darwin.  Obviously the differences in property prices and incomes impact on housing affordability, so let’s take a look at each of the capital cities and the ratio of prices to income over time.

Outside of Sydney, Melbourne and Canberra housing affordability is improving with each capital city having a current ratio which indicates affordability has been worst in the past.  The problem is that almost 2 out of every 5 Australians live in either Sydney or Melbourne and these two cities have also been the epicentres of employment and economic growth over recent years.  Deteriorating housing affordability in Sydney and Melbourne impacts on significantly more people than deteriorating housing affordability elsewhere around the country.

This measure of affordability provides a high level overview of the relative housing affordability across the capital cities, but it is important to remember that geographically across each city the affordability story can be dramatically different.  Furthermore, this analysis does not take into consideration interest rates which can make housing affordability more affordable.  While interest rates are undoubtedly a consideration for buyers, they must also consider that interest rates can fluctuate dramatically over the life of a mortgage.

How to make sense of mortgage backed securities

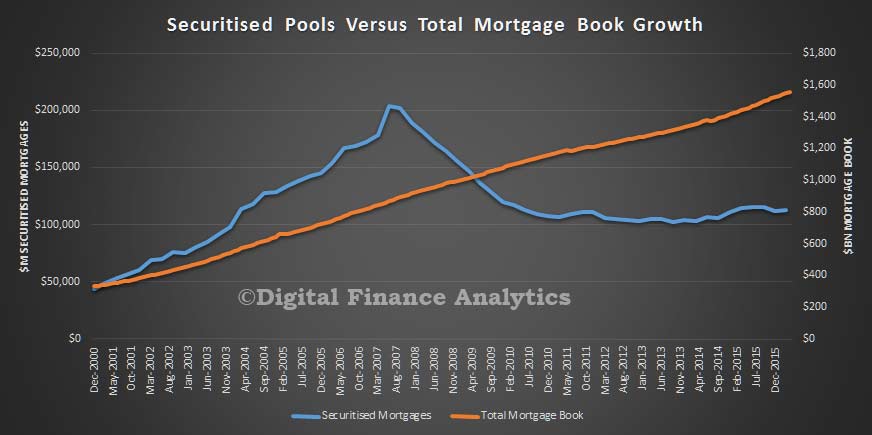
A piece in The Real Estate Conversation, in which DFA is quoted.  “Ratings agency Standard & Poor’s says that RMBS now represent around 10% of Australian housing credit funding and has been trending upward since 2009”. Worth noting that whilst there has been growth since 2009, in absolute numbers, it remains way down from before the GFC.  You can read about our analysis on the impact of non-banks and their need to find other funding options.

Mortgage-Book

Films like The Big Short have shaped many people’s view of residential mortgage backed securities (RMBS).

Like all types of investing, RMBS come with their share of risks and they’re easy for Hollywood to dramatise. However, James Austin, chief financial officer of local non-bank lender Firstmac, says RMBS unfairly carry the load for everything that went wrong in the US in 2007.

“The reality is that in the US, RMBS was simply the tool,” says Austin. “It’s a bit like a builder blaming his hammer. In actual fact it’s the loans themselves and the way those loans were written that were the problem, not the underlying structure or tool.”

The lack of regulation in US markets prior to the global financial crisis also contributed to the mishandling of mortgage backed securities. This is important to understand when considering RMBS in Australia, which is a very different market.

The scoop on securities

RMBS serve two main functions: on the one hand they give investors access to the mortgage market, while on the other they help financial institutions free up or raise capital. Home loans are traditionally private transactions that stay on a lender’s balance sheet for the duration of the mortgage, which means all the capital that’s paid remains tied up.

However, by pooling many loans together into a ‘security’, which is basically a bond (or IOU) that’s legally backed by home loans, this capital is moved off the lender’s books and made available. So, in short, RMBS are debt securities that investors can purchase from financial firms, with a view to earning interest on the entire pool.

There are also different classes of securities called tranches, which are just packages of loans. These let investors target a segment of home loans based on their quality and duration.

“The bond will have a rating from the rating agency, so as an investor you can trade off your risk appetite with the return you want to get,” says principal of consultancy Digital Finance Analytics, Martin North. “For example, you might decide to go for a junk bond [high risk – high yield] with a very a high coupon, but if people in that tranche started defaulting on their mortgages, then that bond would become worthless.

“Whereas a triple-A [low risk – low yield] bond puts you right at the top of the tree and you’d need to have major ruptures in the marketplace to lose your coupon.”

As such, returns on RMBS will vary depending on both the size of the issuance and the tranche you buy into. For example, Firstmac recently completed a $500m sale of RMBS, which produced about a 3.35% return in its AAA tranche, over a weighted average life of around 3-4 years.

Meanwhile, Firstmac’s High Livez RMBS fund, which is a retail fund available to regular investors, holds RMBS from big banks such as Commonwealth Bank and Westpac and has achieved a total return of 6.66% per year since inception in 2011, according to Firstmac. It’s worth noting that RMBS yields can be impacted by general market appetite, interest rate levels and the cost of insurance that’s put in place by the issuing company, among other things.

Who’s investing?

Given that many lenders use RMBS, investors in them can span a number of groups, including super funds, insurance companies, high net wealth investors and the government. The Big Short touched on several of these investors, including government sponsored mortgage company, Fannie Mae.

In Australia, the government’s support of the RMBS market is equally important. According to Austin, RMBS were funding $50-60 billion worth of Australian home loans per year before the GFC, which equated to about 20-25% of all home loans. This was almost completely erased by the financial crisis however, and that’s when the Australian Government stepped in with a $20 billion programme to support RMBS.

Ratings agency Standard & Poor’s says that RMBS now represent around 10% of housing credit funding locally and has been trending upward since 2009.

Risky business

Many local experts don’t see securities markets of other countries as all that comparable to Australia because of our regulatory framework, which is crucially supported by lender’s mortgage insurance on loans issued for more than 80% of the purchase price. This helps to maintain a lower level of mortgage arrears and historically low numbers of defaults.

S&P says that Australian regulators focus on prudent lending standards and this also provides an important safeguard to the local market. There are other factors that make RMBS favourable to local investors, such as Australia’s strong migration levels, which underpin the constant demand for housing, and an ongoing shift away from other financial sectors like mining, says S&P.

At the same time, Australian borrowers must pass strict credit checks by lenders and show other assets in their name, whereas some US home loans are non-recourse, meaning that the only security for RMBS investors in those instances are the properties themselves. When homes plummeted in value during the GFC, many borrowers just walked away.

“In Australia you can’t walk away,” says Austin. “They [authorities] will still come after your other assets or garnish your wages. Australians pay their mortgages, as a result.”

Additionally, Australian loans are only serviced by the lender and are not passed onto other parties, the way they typically are in the US.

Where are RMBS now?

North says that up until the GFC there was momentum in securitised mortgages in Australia, but that since 2008 issuances have been relatively modest.

Still, at the end of 2015 S&P reported a significant upswing in the issuance of RMBS over the last two years, due to a variety of factors that include increased domestic and offshore investor interest. Overall, more than $20bn worth of RMBS were issued in Australia last year, as per S&P.

By contrast, this year hasn’t started as strongly, with around $5bn issued as of April 30, S&P reports. Managing director and lead analytical manager at S&P, Kate Thomson says that global uncertainty in response to China’s slowdown, as well as the Brexit referendum in the UK, APRA’s proposals for APS 120 and Basel regulations, Transparent and Standardised (“STS”) Securitisations in Europe, and amendments to the EU Capital Requirements Regulation have all impacted RMBS growth lately.

Nonetheless, there are still major players in Australia, including Commonwealth Bank and Macquarie Bank, which are the top two RMBS issuers over the 12 month to March 31, S&P says. Other notable issuers include Westpac, ING and Citigroup, and smaller firms like Pepper Home Loans, Firstmac, Heritage Bank and Liberty Bank.

So there’s still a range of opportunities in RMBS for different investors and while it may not be as prominent a vehicle as it once was, the concept is still interesting, says North.

“It [RMBS] manages capital differently, turning cash flow into capital,” he says. “And so if the market ever freed up, it could reassert itself.”

US Households Now Less Likely to Say Using Credit Is OK

Interesting observations about household credit from the US Federal Reserve. In general, fewer households are responding that it is a good idea to buy things on credit. The share with positive answers decreased from 32.4 percent in 2004 to 29.7 percent in 2007 to 25.2 percent in 2013. A similar pattern is observed for answers about vacation, coat/jewelry, car and educational expense categories. The only category with an increase in the share with positive answers is “living expenses.”

Overall, the results suggest that households’ attitude toward credit has changed, signaling a reduction in credit demand. This is an important topic for further research, because the policy recommendations are very different if the reduction in household credit was caused by a reduction in the availability of credit (credit supply) or by households’ attitude toward credit.

In previous articles, we saw that household debt has been declining and why debt has dropped since the financial crisis. Total household debt, which peaked in 2009, stabilized at 13 percent below the previous peak in the first quarter of 2013. One of the most relevant questions regarding this trend is: Was it caused by supply or demand factors?

While credit supply factors capture the behavior of lenders (banks and other financial institutions), credit demand factors represent the willingness of households to borrow. In this blog post, we present data on households’ attitude toward credit to evaluate potential changes in credit demand.

We used data from the Survey of Consumer Finances (SCF). This survey asks households questions on credit attitudes. In particular, households are asked if they think it is generally a good or bad idea for people to buy things by borrowing or on credit. The survey also asked specifically about borrowing money:

  • To cover the expenses of a vacation trip
  • To cover living expenses when income is cut
  • To finance the purchase of a fur coat or jewelry
  • To finance the purchase of a car
  • To finance educational expenses

The figure below shows the percentage of individuals who answered that it is generally a good idea to buy things on credit.

BuyonCredit


Four ways Brexit will hit UK Households personal finances

From The Conversation.

British people have woken up to the news that their country has voted to leave the European Union. Along with this, there has been turmoil in financial markets – the pound has hit a 30-year low and the FTSE dropped more than 8%.

Though the Brexit process will probably take two years (and the UK will remain a full member of the EU in the meantime), some aspects of the decision will affect British people straight away.

1. The pound in your pocket

There is inevitably going to be a period of uncertainty and turmoil. As the referendum result emerged, the pound fell 10% against the US dollar on the foreign exchange markets and 7% against the Euro. If this persists, things the UK imports, such as oil (affecting domestic fuel prices and petrol), foreign cars, coffee, bananas and clothing, will cost more. Overall, then, the general price level may rise meaning that your income will not stretch quite so far.

If you’re holidaying abroad over the coming months and haven’t bought your currency yet, the weaker pound means you’ll also now pay more.

2. Your job and income

A weak pound affects industry as well and so may impact on jobs. Company costs will rise if they import their raw materials and most firms will be hit by higher fuel prices. But the fall in sterling makes it easier for exporters to sell their goods and services abroad. So some jobs and wages may be more at risk, while recruitment rises in other areas.

Longer term, economists have been remarkably consistent in predicting that UK growth is likely to be lower outside the EU than it would have been inside. Businesses do not like uncertainty, so they may put off investing in new plant, machinery and jobs, as being outside the EU trading bloc may make trading with other countries more difficult and some firms may decide to quit the UK. This could mean that jobs and wages will be lower than they might otherwise have been, though not necessarily lower than today.

Before the referendum, Chancellor George Osborne threatened a post-Brexit emergency Budget that would cut public spending and raise taxes. This seems an unlikely immediate response since it would further depress the UK economy just when it is reeling with uncertainty and MPs across all parties were quick to say they would not support such measures. A new prime minister, due from October, may well appoint a new chancellor with his or her own ideas.

3. Your savings and pensions

Uncertainty while markets adjust and firms decide how to respond means the UK stock market is likely to be volatile for some time. Anyone who has recently retired and opted to take an income using drawdown (periodic cashing in of a pension fund still invested in the stock market) may have to take tough decisions about drawing less income now or risk running out of retirement savings later on.

Pensioners may face some complications. shutterstock.com

Savers have suffered since the global financial crisis of 2008 with rock-bottom interest rates. It’s unclear what might happen to these. On the one hand, rising consumer prices may push interest rates up; and credit rating agencies have said they may downgrade UK government debt which means the government would have to raise interest rates to persuade savers to buy its debt. But, if the economy struggles to grow, the Bank of England – which has said it stands ready to deploy any measures to maintain financial stability – might embark on new rounds of quantitative easing to keep interest rates low to encourage economic growth.

4. Your home and mortgage

While savers would welcome a rise in interest rates, this would increase mortgage repayments for borrowers and could even trigger repossessions. The International Money Fund has predicted that UK house prices could drop sharply post-Brexit. You might be concerned about that if you are in one of the six out of ten UK households that own their own home. But this could be good news for younger generations who have been struggling to afford a home.

Author: Jonquil Lowe, Lecturer in Personal Finance, The Open University

Did Bank of England governor speech shore up confidence in Brexit UK?

From The Conversation.

Bank of England Governor Mark Carney was admirably quick to read the unfolding economic dangers of a Brexit when the referendum result was declared. While stock markets and sterling plummeted amid developing financial stress, the governor’s statement immediately brought to mind the famous “whatever it takes [to save the euro]” intervention by European Central Bank chief Mario Draghi at the height of the eurozone crisis in July 2012.

Carney started by making clear that the British banks are safe since their capital requirements are now ten times higher than before the 2008-2009 financial crisis. The purpose of these high requirements is to ensure banks will be able to pay off their depositors, which aims to reduce the risk of a banking panic.

Indeed, the UK banks have been stress-tested against more adverse scenarios than what the Treasury thought that Brexit might trigger. The scenarios included residential property prices falling by over 30% and the level of GDP falling by 4% at the same time as a 5% rise in unemployment.

The governor was obviously seeking to reassure the public that whatever the economic/financial headwinds after the Brexit vote, British banks are rock solid and won’t see a repeat of the queues outside Northern Rock branches nine years ago.

Carney was absolutely right to do this. Lack of confidence in domestic banks often triggers recessions as depositors withdraw money, which restrict the banks’ ability to lend and keep the economy growing. This can be particularly lethal when combined with capital flight, which is where nervous investors offload a country’s currency and assets priced in the currency for fear that it is falling in value.

In Britain’s case, there were reasons on the ground to justify the intervention. British customers have queued outside banks to ditch sterling in an attempt to “hedge” against Brexit. And the news of sterling dropping like a stone on the night of the count was a strong signal that investor confidence was deserting the UK.

The worries of these investors are well summed up by the IMF’s warnings over Brexit:

[It] could entail sharp drops in equity and house prices, increased borrowing costs for households and businesses, and even a sudden stop of investment inflows into key sectors such as commercial real estate and finance.

The UK’s record-high current account deficit and attendant reliance on external financing exacerbates these risks. Such market reactions could sharply contract economic activity, further depressing asset prices in a self-reinforcing cycle.

The liquidity weapon

As well as the reassurances about strong banks, Mark Carney also said the Bank of England is prepared to inject up to £250bn of liquidity for financial institutions to keep the economy going in these difficult times ahead. Without doubt, this is substantial financial help amounting to some two-thirds of the £375bn that the central bank has already pumped into the system in the form of quantitative easing in recent years.

Carney also referred to “extensive contingency planning” with Chancellor George Osborne throughout the night, as well as mentioning potential “additional measures” such as providing substantial liquidity in foreign currency if it was needed. That might desperately be needed by British companies trading internationally which might be exposed to large fluctuations in exchange rates because of turbulence with sterling.

Yet the governor deliberately didn’t spell out what any other measures might be. One option might be to cut the base rate down to zero or even charge banks for “parking” their cash with the Bank of England. The European Central Bank is already doing this to encourage European banks to continue lending to the private sector.

Carney was right not to reveal his full defensive armour yet. Suffice for the time being to let both the public and the markets know he has other policy weapons in place and is ready to be tested if the economic conditions make it necessary.

Cameron steps down

The governor’s speech came shortly after David Cameron resigned. The British prime minister was trying to show a very brave face by delaying his departure to October. This makes absolute economic and political sense because the captain of a sinking (UK) ship has a moral obligation to be the last one to abandon it.

Cameron’s last stand. Matt Dunham/PA

Yet in truth, the eurosceptic Tories would hardly trust him to start the Brexit negotiations with the EU when he has fought passionately to stay in. He therefore might lose his job much earlier than he thinks. Not that this would have made any difference to the markets – his defeat made his departure unavoidable. The only thing that might have further traumatised the markets would have been if he had not resigned.

But despite Carney and Cameron’s efforts to steady the markets, they could do nothing to disguise the UK’s lack of preparation or plans for handling the Brexit negotiations. There are many possible options for trade deals with the EU but no clear direction.

The Brexit camp, particularly Justice Secretary Michael Gove, has attacked the economic “experts” who overwhelmingly warned of the huge economic and financial risks of such a move. They warned that four UK companies would lose out for every one that benefits from leaving the EU.

The odd argument of the Brexit camp is that these experts have to be wrong because they did not predict the 2008-09 financial crisis. “Once wrong, always wrong,” in other words. Now that Mark Carney has had to step in while the politicians try and work out what happens next, we will know pretty soon whether we economists are going to be wrong this time around. Don’t be surprised if we haven’t seen the last intervention from the Bank of England.

Authors:Costas Milas,Professor of Finance, University of Liverpool; Gabriella Legrenz,Senior lecturer in economics, Keele University


US Bank Stress Tests Highlight Improving Resilience – Fitch

The first stage of this year’s US bank stress tests highlights improving resilience with solid results despite a severely harsher scenario that included a more severe downturn than previous tests and negative short-term US Treasury rates, Fitch Ratings says. All 33 US bank holding companies passed the minimum capital ratio requirements. Tested firms overall generally performed better, posting higher capital ratios and smaller declines in capital ratios than in the past.

The largest global banks generally performed better than last year, although they still account for over half of projected losses under the severely adverse scenario, since they are subject to global market shock and counterparty default component. Pre-provision net revenue (PPNR) projections were noticeably higher this cycle, particularly for the five largest global trading and universal banks – Goldman Sachs, JP Morgan, Morgan Stanley, Citigroup and Bank of America. This more than offset higher losses from the stress scenario and may mean that some large global firms that typically revised capital plans post-DFAST won’t do so this year.

The test hit Morgan Stanley hardest in terms of capital erosion, although very high starting risk-weighted capital ratios gives it greater flexibility. It is more constrained by the leverage ratio, which had a projected minimum of 4.9%, leaving only a 90bp cushion above the requirement.

Among other weaker performers, two firms in the midst of M&A performed significantly worse than last year. Capital ratios for Huntington Bancshares may have taken a hit from the pending FirstMerit acquisition, resulting in a projected minimum common equity tier 1 (CET1) ratio of 5% – the lowest of all 33 banks. The First Niagara merger may be a key driver for the erosion of KeyCorp’s CET1 ratio to minimum 6.4%. These banks and others close to the 4.5% CET1 minimum threshold may constrain their capital return requests.

For firms that fared well quantitatively, the threat of a capital plan rejection for qualitative reasons under the second stage – Comprehensive Capital Adequacy Review (CCAR) – is still a significant hurdle. Modeling negative interest rates is likely to be more challenging for regional banks than global banks, like Citigroup, that already operate in markets with negative rates. The qualitative assessment may also bring up issues for new participants. Both are foreign-owned banks, which historically haven’t performed as well in the CCAR.

Credit card issuers and trust and processing banks performed well with the least capital erosion. However, their pre-provision net revenue projections were down compared to 2015, probably because of negative rate assumptions depressing interest income, which particularly impacts processing banks. Bank of New York Mellon and State Street’s PPNR projections fell around 20%-30%. Still, as in previous cycles, these firms showed projected net income over the nine quarters of the stress horizon, in contrast to net losses for firms with other business models.

Negative rates also had more impact on regional banks. The Fed said that firms more focused on traditional lending activities were more affected by this assumption.

Almost three quarters of the $526 billion in losses projected under the severely adverse scenario stemmed from loans, while 21% arose from trading and counterparty positions subject to the global market shock and counterparty default component. Projected loan loss rates varied significantly from 3.2% on domestic first lien mortgages to 13.4% on credit cards. The loss rate for domestic commercial real estate loans improved by 160bp to 7%, the first rise since 2012. The rate for commercial and industrial (C&I) loans deteriorated, jumping 90bp to 6.3%. C&I loan growth has been strong and the weaker performance may reflect energy sector weakness within these portfolios.

Statement from the Governor of the Bank of England following the EU referendum result

Statement from the Mark Carney, Governor of the Bank of England

The people of the United Kingdom have voted to leave the European Union. Inevitably, there will be a period of uncertainty and adjustment following this result. There will be no initial change in the way our people can travel, in the way our goods can move or the way our services can be sold. And it will take some time for the United Kingdom to establish new relationships with Europe and the rest of the world.

Some market and economic volatility can be expected as this process unfolds.  But we are well prepared for this.  The Treasury and the Bank of England have engaged in extensive contingency planning and the Chancellor and I have been in close contact, including through the night and this morning. The Bank will not hesitate to take additional measures as required as those markets adjust and the UK economy moves forward. These adjustments will be supported by a resilient UK financial system – one that the Bank of England has consistently strengthened over the last seven years.

The capital requirements of our largest banks are now ten times higher than before the crisis. The Bank of England has stress tested them against scenarios more severe than the country currently faces. As a result of these actions, UK banks have raised over £130bn of capital, and now have more than £600bn of high quality liquid assets. Why does this matter? This substantial capital and huge liquidity gives banks the flexibility they need to continue to lend to UK businesses and households, even during challenging times. Moreover, as a backstop, and to support the functioning of markets, the Bank of England stands ready to provide more than £250bn of additional funds through its normal facilities. The Bank of England is also able to provide substantial liquidity in foreign currency, if required. We expect institutions to draw on this funding if and when appropriate, just as we expect them to draw on their own resources as needed in order to provide credit, to support markets and to supply other financial services to the real economy. In the coming weeks, the Bank will assess economic conditions and will consider any additional policy responses.

Conclusion. A few months ago, the Bank judged that the risks around the referendum were the most significant, near-term domestic risks to financial stability. To mitigate them, the Bank of England has put in place extensive contingency plans. These begin with ensuring that the core of our financial system is well-capitalised, liquid and strong. This resilience is backed up by the Bank of England’s liquidity facilities in sterling and foreign currencies. All these resources will support orderly market functioning in the face of any short-term volatility. The Bank will continue to consult and cooperate with all relevant domestic and international authorities to ensure that the UK financial system can absorb any stresses and can concentrate on serving the real economy. That economy will adjust to new trading relationships that will be put in place over time. It is these public and private decisions that will determine the UK’s long-term economic prospects. The best contribution of the Bank of England to this process is to continue to pursue relentlessly our responsibilities for monetary and financial stability. These are unchanged. We have taken all the necessary steps to prepare for today’s events. In the future we will not hesitate to take any additional measures required to meet our responsibilities as the United Kingdom moves forward.

A Brexit Is Confirmed

With the UK vote count complete, 48.1% are for remaining a member of the European Union and 51.9% to leave. A number of factors explain why remain slipped from being a reasonable cert by a (small) majority to defeat. The larger than expected turn-outs at 72.2%, in northern England, and among lower socioeconomic groups tipped the balance towards an exit. Remain under performed in areas where they were expected to be strong, but were still ahead in the London area and Scotland.  The financial markets continue to exhibit significant volatility as traders reset their their expectations, some would say they are panicking! It looks like a wild ride will continue for some time.

Here is the Pound US Dollar Chart for the last few hours.  Down 9.3%!

http://930e888ea91284a71b0e-62c980cafddf9881bf167fdfb702406c.r96.cf1.rackcdn.com/data/tvc_d2ee76bc962bb981cb9c8e4b12bf1006.png