Westpac cuts business and home loan interest rates

Westpac today announced a reduction in its variable home loan (owner occupied) and residential investment property loan rates by 0.25%. It also announced a reduction in variable rate small business loans by 0.25%. The effective date is 23 May, 2016.

This will bring the headline owner occupier home loan variable rate to 5.43% per annum (comparison rate 5.57% per annum*) and the headline residential investment property variable rate to 5.70% per annum (comparison rate 5.84% per annum*).

George Frazis, Chief Executive of the Consumer Bank said today’s decision was good news for home loan customers and those looking to buy a new home. “Helping more Australians’ move into home ownership remains the top priority for
Westpac’s Consumer Bank, and today’s announcement is good news for customers.”

BOQ cuts rates

Following the Reserve Bank of Australia (RBA) board meeting on Tuesday 3 May, BOQ today announced it will pass on the full 25 basis point rate cut to its variable home loan customers.

CEO and Managing Director, Jon Sutton said the decision to cut rates came after careful consideration of a range of factors, including BOQ’s position in a highly competitive market.

“While funding markets remain volatile, we have made the decision to lower our rates to ensure we maintain the right balance between growth, risks and margins over the longer term while also considering the needs of our customers,” he said.

Variable home loans for owner occupier and investor customers will be cut by 25 basis points. With a new carded rate of just 4.47% BOQ’s lead product Clear Path will remain one of the most competitively priced variable mortgages for owner occupiers on the market.

The new variable rates will be effective 18 May 2016.

NAB passes on 0.25% p.a. cut to home loan customers

NAB today announced it will reduce its variable rate for home loans by 0.25% p.a.

This announcement means NAB’s Variable Rate for Home Loans (Standard Variable Rate) will reduce from 5.60% p.a. to 5.35% p.a.

NAB customers with a Standard Variable Rate home loan will save an average of $47-a-month on their monthly home loan principal and interest repayments based on a $300,000 loan over a 30-year term.

NAB Group Executive Personal Banking Gavin Slater said in making the decision to change interest rates, the bank considers a range of factors.

“The circumstances of each decision will always vary and we must take into account factors such as competition, regulatory capital requirements and funding costs,” Mr Slater said.

“Today’s decision balances the needs of our home loan customers with our shareholders.”

Today’s change applies to Owner Occupier and Residential Investment variable rate home loans.

  • For owner occupiers with NAB’s Variable Rate for Home Loans (Standard Variable Rate) the rate will reduce from 5.60% p.a. to 5.35% p.a.
  • For residential investors with NAB’s Variable Rate for Residential Investment Home Loans the rate will reduce from 5.75% p.a. to 5.50% p.a.

NAB will also reduce its rate on standard variable business rate lending products by 0.25% p.a.

The new rates will be effective from Monday 16 May 2016.

RBA Cuts Cash Rate

At its meeting today, the Board decided to lower the cash rate by 25 basis points to 1.75 per cent, effective 4 May 2016. This follows information showing inflationary pressures are lower than expected.

The global economy is continuing to grow, though at a slightly lower pace than earlier expected, with forecasts having been revised down a little further recently. While several advanced economies have recorded improved conditions over the past year, conditions have become more difficult for a number of emerging market economies. China’s growth rate moderated further in the first part of the year, though recent actions by Chinese policymakers are supporting the near-term outlook.

Commodity prices have firmed noticeably from recent lows, but this follows very substantial declines over the past couple of years. Australia’s terms of trade remain much lower than they had been in recent years.

Sentiment in financial markets has improved, after a period of heightened volatility early in the year. However, uncertainty about the global economic outlook and policy settings among the major jurisdictions continues. Funding costs for high-quality borrowers remain very low and, globally, monetary policy remains remarkably accommodative.

In Australia, the available information suggests that the economy is continuing to rebalance following the mining investment boom. GDP growth picked up over 2015, particularly in the second half of the year, and the labour market improved. Indications are that growth is continuing in 2016, though probably at a more moderate pace. Labour market indicators have been more mixed of late.

Inflation has been quite low for some time and recent data were unexpectedly low. While the quarterly data contain some temporary factors, these results, together with ongoing very subdued growth in labour costs and very low cost pressures elsewhere in the world, point to a lower outlook for inflation than previously forecast.

Monetary policy has been accommodative for quite some time. Low interest rates have been supporting demand and the lower exchange rate overall has helped the traded sector. Credit growth to households continues at a moderate pace, while that to businesses has picked up over the past year or so. These factors are all assisting the economy to make the necessary economic adjustments, though an appreciating exchange rate could complicate this.

In reaching today’s decision, the Board took careful note of developments in the housing market, where indications are that the effects of supervisory measures are strengthening lending standards and that price pressures have tended to abate. At present, the potential risks of lower interest rates in this area are less than they were a year ago.

Taking all these considerations into account, the Board judged that prospects for sustainable growth in the economy, with inflation returning to target over time, would be improved by easing monetary policy at this meeting.

Negative Interest Rates: A Tax in Sheep’s Clothing

Negative interest rates are taxes in sheep’s clothing. Few economists would ever claim that raising taxes on households will stimulate spending. So why would they think negative interest rates will?

From St Louis Fed Blog.

If you pick up any principles of economics textbook, there will typically be a discussion of taxes and tax incidence. Tax incidence describes who bears the burden of a tax. For example, suppose the government levies a payroll tax on a firm. The burden of the tax may be borne by the firm, the workers or the firm’s customers.

How can this be if the firm is responsible for paying the tax? The firm may bear the burden of the tax by accepting lower after-tax profits. However, the firm can pass the tax onto its workers by paying them lower wages or hiring fewer workers. The firm can also pass the tax onto its customers by charging them a higher price for the firm’s output. In general, all parties bear some portion of the tax.

Similarities to Taxes on Banks

This logic also applies to a tax levied on banks. Banks hire inputs (in this case, deposits), which are used to produce output (loans). The bank charges a price for its output (the interest rate on the loan) and pays wages to its inputs (the interest rate on deposits).

The spread between the loan rate and the deposit rate determines the profit margin for the firm on a loan (ignoring default costs and other costs for ease of exposition). So any tax imposed on banks will be borne by the bank, the depositors and/or the borrowers. The firm can bear the burden of the tax by accepting lower profits. However, the bank can also pass the tax onto depositors by paying a lower interest rate on deposits and/or pass the tax onto borrowers by charging them a higher interest rate on loans.

Negative Interest Rates

This brings us to negative interest rates. Many foreign central banks—such as the European Central Bank, the Bank of Japan and the Swiss National Bank—have implemented negative interest rates on bank reserves as a policy tool to stimulate demand for goods and services. If a bank holds a dollar of reserves, the central bank may take, say, half a cent.

The hope is that a negative interest rate will induce firms to lend out the reserves by charging a lower interest rate on loans. In short, “use it or lose it.” More lending would stimulate spending on goods and services, which would lead to higher output and upward pressure on inflation.

A Tax on Reserves

But a negative interest rate is just a tax on the banks’ reserves. The tax has to be borne by someone:

  • The banks can choose not to pass it on and just have lower after-tax profits. This will depress the share price of banks and weaken their balance sheets by having lower equity values.
  • The banks can pass the tax onto depositors by paying a lower interest rate on deposits or charging them fees for holding the deposits. In either case, depositors have less income to spend on goods and services.
  • The bank can pass the tax onto borrowers by charging them a higher interest rate on a loan or higher fees for processing the loan. In either case, it is more costly to finance purchases of goods and services by borrowing.

None of this sounds very “stimulative” for consumer spending. But then, no tax ever is.

Negative Interest Rates in Other Countries

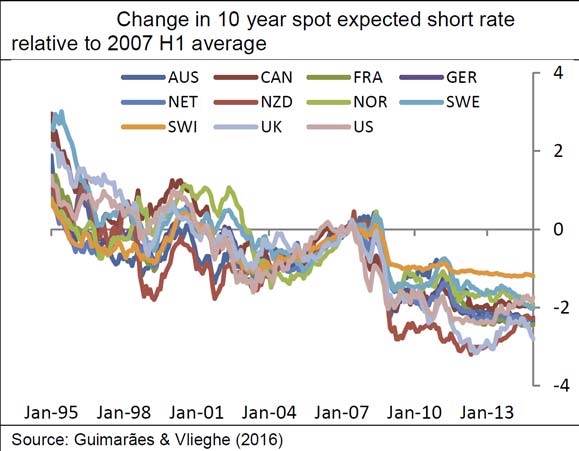
What has happened so far in countries that have tried negative interest rates? The figures below provide answers. As seen in the first chart, bank stock prices have definitely taken a hit. After initially continuing their downward trends, interest rates on mortgages have now risen in Germany and Switzerland (the second chart). Banks have been very reluctant to charge negative deposit rates for fear of a backlash from customers (the third chart).

At the end of the day, negative interest rates are taxes in sheep’s clothing. Few economists would ever claim that raising taxes on households will stimulate spending. So why would they think negative interest rates will?

NegRatesBankStockDecline

MortgageRates

HouseholdDepRates

Home Values Up; Rental Yields Down – CoreLogic RP data

From CoreLogic RP Data.

The CoreLogic April Home Value Index results show the trend for capital gains has dropped from the peaks of 2015 with dwelling values continuing to track higher across each of the capital cities over the first four months of this year.

In April, the pace of capital gains rebounded from the relatively flat numbers recorded in March, with dwelling values increasing by an average of 1.7 per cent across the CoreLogic combined capitals’ index. The latest figures now take the combined capital city dwelling values measure 3.3 per cent higher over the first four months of 2016.

Across the country, housing market trends remain mixed, however, CoreLogic Research Director Tim Lawless noted that the improvement in the rate of capital gains has been ‘broad-based’ during 2016 with every capital city except Perth recording a lift in dwelling values over the calendar year to date.

“The results show value growth moved at a faster pace compared with the final three months of 2015 when capital city dwelling values slid 1.4 per cent lower off the back of weaker market conditions in Sydney and Melbourne.”

“While we’ve seen capital gains moderate substantially after peaking last year in Sydney and Melbourne, dwelling values continue to trend higher, just not as fast. The annual rate of growth in Sydney peaked at 18.4 per cent in July last year and has since moderated back to slightly less than half the peak rate of growth, at 8.9 per cent over the most recent twelve month period,” Mr Lawless said.

Index Results as at April 30, 2016

2016-05-02--INDICES

Melbourne’s housing market continues to show a level of resilience to a slowing trend, however the annual growth rate has fallen from a recent peak of 14.2 per cent to the current annual growth rate of 10.1 per cent; Melbourne was the only capital city to see double digit growth over the past twelve months.

Perth and Darwin remain as the only two capital city markets to experience a decline in home values over the past twelve months, with Perth values down 2.1 per cent and Darwin values 3.7 per cent lower. Mr Lawless said, “With recent month-on-month increases in home values in these two cities, the declining trend rate is now levelling. This may be an early sign that these markets are beginning to find their cyclical trough after more than a year of annual declines.”

Over the current growth cycle, which commenced broadly in June 2012, capital city dwelling values have moved 34.4 per cent higher, led by a 52.7 per cent rise in Sydney home values, and a 37.1 per cent lift in Melbourne values. Mr Lawless said, “This result highlights the two-tiered nature of Australia’s housing market.”

Brisbane experienced the third highest rate of dwelling value growth over the growth cycle to date; dwelling values in the city are now up 18 per cent. According to Mr Lawless, Australia’s regional markets also exhibited a lift in house values over the year to date. “While house values across the non-capital city markets have generally underperformed compared with the capital city regions, regional house values moved 2.4 per cent higher over the first quarter of the year.”

ABC Four Corners Does The Housing Boom

Last night the ABC aired a programme on the housing boom. It focused on the impact property investors are having on driving home prices higher and making access to property ever more difficult for owner occupied purchasers who are trying to enter the market. Whilst there was little that was new to followers of this blog, one segment looking at the high rate of vacant units in the Melbourne high-rise developments was striking.

Also, there was evidence of applications being “tweaked” to make incomes higher, such that a loan would pass underwriting muster. Some are suggesting this is a prevalent practice, and links to poor bank culture.

You can read the transcript across at the ABC site, and watch the programme (if you are not Geo-blocked).

Here is the segment on Melbourne’s ghost apartments.

I think the missing element for me was the fact that this is an intentional strategy, led by the Reserve Bank to make housing, and households do the heavy lifting as the mining boom fades. No surprise then that loan to income ratios are off.

The long term implications of this policy have yet to come home to roost.

Westpac 1H 2016 Results Underscores Tighter Banking Environment

Westpac Group has announced First Half results for 2016.   Whilst statutory net profit was $3,701 million, up 3% over the prior corresponding period it was 16% down from 2H15. Cash earnings were $3,904 million, up 3% from 1H15, but down 3% from 2H15. Cash earnings per share was 118.2 cents, down 2% on 1H15 and down 7% on 1H16. Cash return on equity (ROE) was down 166 basis points from 1H15. and down 172 basis points from 2H15, to 14.2%. The interim, fully franked dividend was 94 cents per share (cps), up 1% on the 2015 interim dividend and in line with the 2015 final dividend. They lifted the payout ratio to around 80%.

The bank is having to work hard to maintain momentum, with the lower rates on deposits, the main lever. Tighter lending standards are showing in the Australian mortgage book, as are rising delinquencies. There are headwinds in the Institutional Bank and New Zealand. The question becomes, is it sustainable to pay current dividend rates into the future? Will 2H16 impairment charges be lower as the bank suggests? What will the next capital lifting initiatives be (they were silent on this, indicating they were in the top quartile of banks globally), given we expect ratios will be going higher.

Lending and customer deposit growth of 6% and 5% respectively. Net interest income was $7,653 million, up 10%, with net interest margin up 9 basis points. Total lending rose 6% from March 2015, with above system growth in Australian mortgages, up 8%, and Australian business lending rising 6%. Lending in New Zealand increased 7% in NZ dollars. The bank is heavily reliant on the performance of its mortgage book in Australia. Customer deposits increased $21.7 billion, or 5%, with the deposit to loan ratio at 69%.

WBC6-May-2016Excluding Treasury and Markets, net interest margins were up 6 basis points. But NIM in New Zealand and Institutional Bank fell. Actually the biggest contribution was from reducing interest rates on deposits.

WBC3-May-2016Non-interest income of $2,966 million was down 4%. Excluding infrequent and volatile items, most of the decline was due to lower Australian credit card interchange income and lower institutional fee income in line with more subdued debt origination

An improved expense to income ratio of 41.6%, down 3 basis points from 2H15, with expenses up 4%, mostly related to higher investment including increased technology and professional services costs

Stressed assets to total committed exposures falling 9 basis points to 1.03%. But impairment charges increased $326 million due to lower write-backs, increased provisions for a small number of larger institutional facilities, and from a modest rise in consumer delinquencies. An increase in the stressed exposures ratio of 4 basis points over Second Half 2015 principally reflects a rise in consumer delinquencies, including in geographies more affected by the slowdown in mining.  We see mortgage deliquencies rising in WA and QLD (but a rise shows in all states, from a low base).

WBC4-May-2016The credit quality of the Group’s portfolio was little changed since First Half 2015 with stressed exposures to total committed exposures of 1.03%, down from 1.12%. But Westpac Institutional Bank (WIB) was affected by lower net interest margins and significantly higher impairment charges related principally to four large exposures which added $252 million to provisions. Impaired assets remained low at 0.26% of total committed exposures, but was up 2 basis points over the year, while the provision coverage of impaired assets has remained high at 48%.

The Group raised around $6 billion in equity over calendar 2015, lifting the Group’s common equity Tier 1 ratio to 10.5%, up 171 basis points. On an internationally comparable basis, Westpac’s CET1 ratio was 14.7% and comfortably in the top quartile of banks globally.

WBC1-May-2016There were no new capital raising initiatives announced this time, but the impact of the earlier entitlement offer can be seen in the results – lifting the capital ratio by 96 basis points.

WBC5-May-2016Looking at the segmentals:

  • Consumer Bank continued to grow the value of the franchise, with more customers and above system lending growth contributing to a 15% rise in core earnings and a 16% rise in cash earnings. However, the impact of higher capital for mortgages reduced returns in this business. The business has continued to invest in improving service by transforming the network through the upgrade of 22 branches over the half, enhancements to self-serve options including more Smart ATMs, and increasing the functionality of its online platforms. We discuss the Australian mortgage book below.
  • Business Bank grew core earnings by 5%, with good growth in lending. Non-interest income grew 3%, mostly through higher merchant revenue supported by the roll-out of new state-of-the-art payment terminals. Cash earnings were lower, down 3%, due to higher impairment charges. While asset quality has improved, a reduction in write-backs and an increase in auto delinquencies contributed to a $118 million increase in impairments.
  • BT Financial Group continues to be a leading provider of wealth solutions in Australia, with a Funds Under Administration (FUA) share of 19.6%. BTFG saw cash earnings little changed over the year with business growth offset by a reduction in Funds Management earnings mostly due to lower markets and the partial sale of BTIM in Second Half 2015. The business continued to benefit from good flows into FUM and FUA, while continued success in Private Wealth has seen lending increase 8%. Insurance has also continued to expand with Life in-force premiums up 12%.
  • Westpac Institutional Bank delivered cash earnings of $517 million, down $136 million. The lower result was driven by a $201 million increase in impairment charges, a reduction in fund performance fees, and lower margins. The division maintained its leading market position, growing customer numbers and generating good flows in FX. However, the more challenging market conditions from high levels of global liquidity continues to place pressure on margins. While asset quality was maintained, including a further reduction in stressed assets, downgrades to a small number of exposures was the main contributor to the higher impairment charge.
  • Westpac New Zealand’s cash earnings were up 2% to NZ$445 million. The business has continued to grow broadly in line with system while steadily expanding its wealth and insurance business. However, intense competition for new lending and a shift to lower spread fixed rate mortgages has compressed margins. Notwithstanding deteriorating financial conditions in the dairy sector, asset quality has remained sound and consumer delinquencies remain near historic lows, contributing to continued low impairment charges.

Finally, we look at the Australian mortgage book, because this is such a large part of the banks business. Lending standards have been tightened. We see considerable growth, with a reduction in investment loans – after adjustments to 7.2% from 9.9% in September 2015.

WBC2-May-2016They provided some detail in the portfolio, with 94% of the portfolio with a dynamic LVR of below 80% and 72% of borrowers ahead with repayments (many because they have an offset account). A greater flow of mortgages are coming via the broker channel ~50%. The average loan size is still rising and the average LVR falling a little. Actual mortgage losses are stilling at 2 basis points.

WBC9-May-2016Looking at the investment portfolio, the average LVR of new loans is now 67%, down from 70% 1H15. The +90 day delinquency rates are at 38 basis points, compared with 31 basis points in 2H15. 62% of households are ahead with repayments (including offsets), down from 65% in 2H15.

WBC10-May-2016Westpac is now working on a minimum floor rate of 7.25% and they have tightened serviceability criteria and have stopped lending to most non-resident customers.

WBC8-May-2016

Australian Major Bank Credit Metrics Under Pressure – Moody’s

From Business Insider.

Australia’s asset cycle has peaked, according to credit rating agency Moody’s Investor Services. And that means the risk weight capital our major banks hold will come under pressure.

The agency also says that the looming increase in risk weightings on the average mortgage risk weights as a result of the Australian banking regulator’s, APRA, edict that “risk weights for IRB banks will rise to at least 25%, from the current 15-18% level” will also put downward pressure on the majors CET1 (Common Equity Tier One) ratio’s.

The good news for the banks, their shareholders, and the Australian financial system is that Moody’s believes, based on its scenario and sensitivity analysis, that “the potential decline in the banks’ capital metrics as a result of changes to risk weights will be limited”.

Ilya Serov, Moody’s senior vice president, added in the report that:

Even in a highly stressed scenario, and before factoring in any potential for organic capital generation, the major banks’ CET1 ratios will remain above 8.0%, a level which is the combination of the regulatory minimum CET1 plus Capital Conservation and Domestic Systemically Important Bank (D-SIB) buffers.

That doesn’t guarantee the banks won’t have to raise more capital at some point. But it certainly suggests the work they have already done in raising capital in preparation for the changes in regulation will keep them above the 8% trigger level.

Under each of the scenarios Moody’s ran a comparison of the impact of the upper end of Australian banks 2009 experience when the corporate “impaired and past due exposure ratio” hit 2.5%. In the second scenario Moody’s took the average of the banks 2009 experience – as opposed to upper-end of experience as it’s base input. It then included the increase in mortgage weights into this scenario.

Moody’s says: “The key cyclical pressure on risk-weighted capital ratios will come from an upward revision in credit risk weights as asset quality weakens. This is a reversal of the situation which has existed since the GFC’s nadir in 2008/09 which with the ‘decline in the major banks’ CRWA, as asset quality improved after the global financial crisis, has been the primary organic driver of their improving risk-weighted capital ratios.”

While Moody’s stressed this was not a credit rating note in the end though the company still sounds pretty upbeat on the big banks capital positions.

“The moderate degree of deterioration in capital levels indicated by our sensitivity analysis is in line with our view that Australia’s major banks remain in a strong position to maintain their strong credit profiles against a likely weakening in their asset performance” Moody’s said.

Bank Home Lending Credit Growth Continues

The latest data from APRA reporting home lending to end March shows total ADI balances grew by $9.5 bn to $1,441,253, a rise of 0.67% in the month, which is an annualised rate of 7.9%. Superficially, $8.2.billion was for owner occupation and $1.3 billion for investment home purchase but the RBA warned that $1.5 bn was due to loan reclassification between OO and INV loans so there is still noise in the system.

There was little net market share movement among the larger players. CBA still has the largest share of owner occupation loans, and Westpac of investment loans.

APRA-March-2016---Home-SharesThe value of portfolio movements shows the focus on owner occupied lending, compared with investment loans. Perhaps.ANZ’s fall in investment loans could signal a reclassification?

APRA-March-2016---Home-Share-MovcementsLooking at the growth in investment loans in terms of the APRA 10% speed limit, calculating movements on a 3 month annualised basis, against a market movement of 1.33%, NAB has growth above system, whilst the other major players are below system. Some smaller players continue to write high volumes of investment loans.

Investment-Growth-April-2016-By-Bank

Finally we look at the relative share by loan type. This chart takes the relative percentages for owner occupied and investment loans by bank. It does not show the relative value, but the relative share (which we think is a more important lens).

Share-Splits-Mar-2016-APRAWe will not post on the deposit or credit card portfolios as there is little to see this month.