Bendigo and Adelaide Bank Update

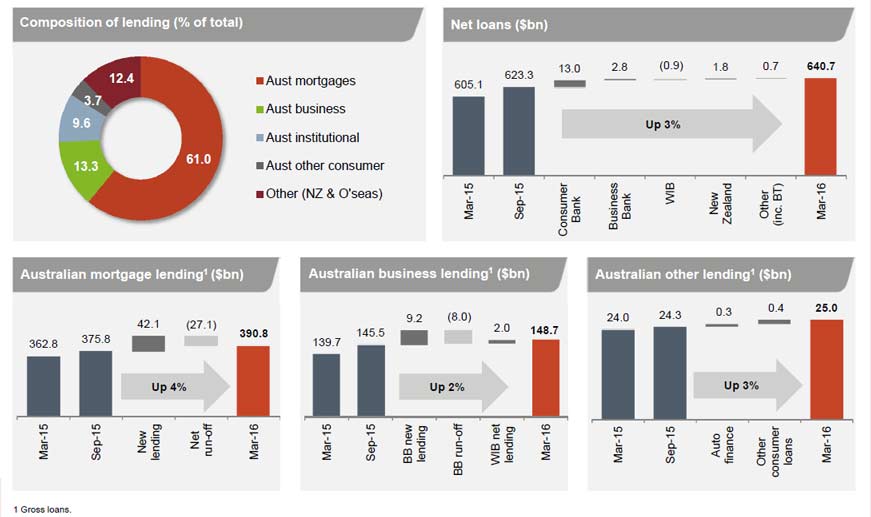
In their business strategy and trading update today, they recapped on lending growth which  has been below system, and that they have a cost to income ratio which is still high (~2% above Suncorp).

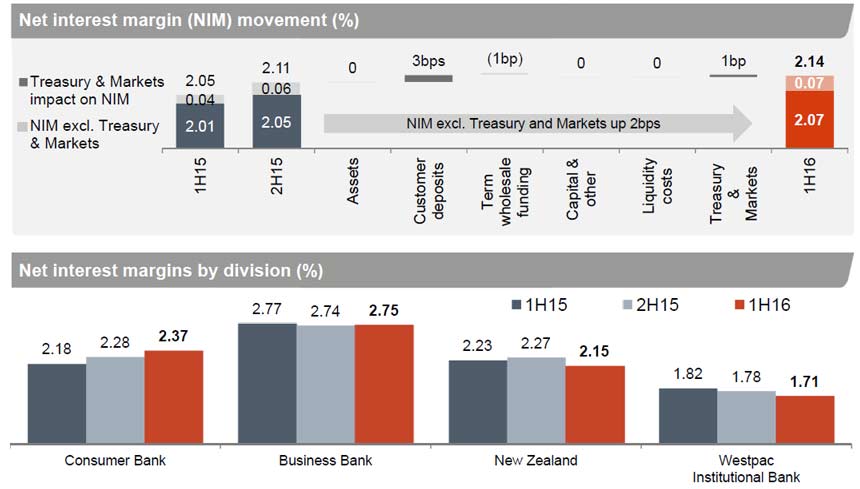
Ben4NIM is under some pressure.

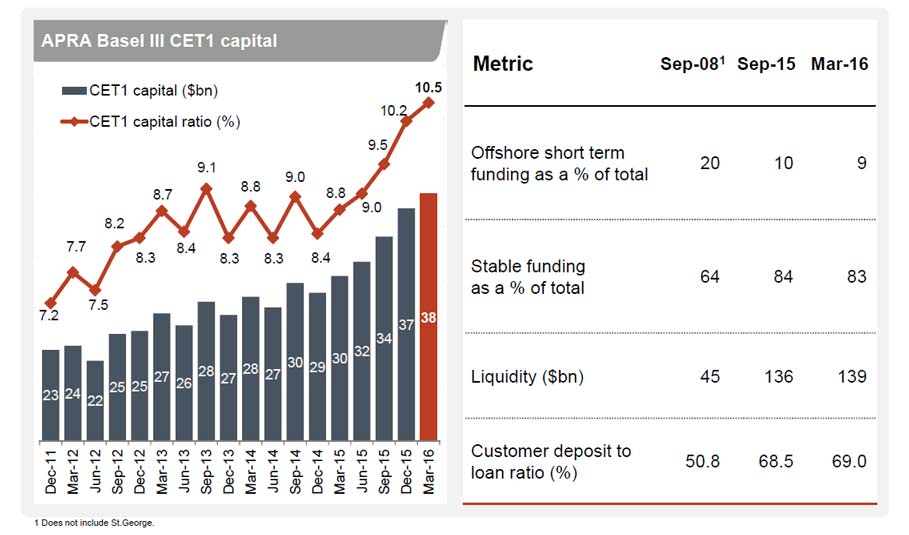
Ben6However, the bank is quite well positioned from a funding perspective. 81% is deposit funded, could go higher, this is significant because RMBS market funding pricing is line ball at the moment. They have moved from 20% to 6% RMBS, and this has created a capital headwind, so they will most likely focus on senior funding.

Ben7In terms of Strategy, Bendigo and Adelaide Bank, describes its aim to build around customer engagement and staff engagement, with an expectation that digital channels and customer centricity will out.

Ben3They are driving towards 24/7 digital platform, underpinned by their core banking system. Their vision is to be the most customer connected bank with a focus on customer service and the strengthening of core relationships.

Ben5However it is clear they are banking on benefits of moving from standard to advanced IRB capital model. Whilst they may wish to move to this basis, and this may be a phased implementation, it will be APRA who is holding the implementation cards. There is a benefit as their current mortgage risk weighting is about 39 basis points, whereas the major banks have a 25 basis point target by July 2016.

Homesafe will continue to be a drag on the business if property valuations in the major centres fall as the portfolios have to be marked to market, they of course had upside in the good times! 3Q16 Homesafe contribution was -$1.6m pre-tax. There are 2,500 contracts in the portfolio, average $125,000 funded.

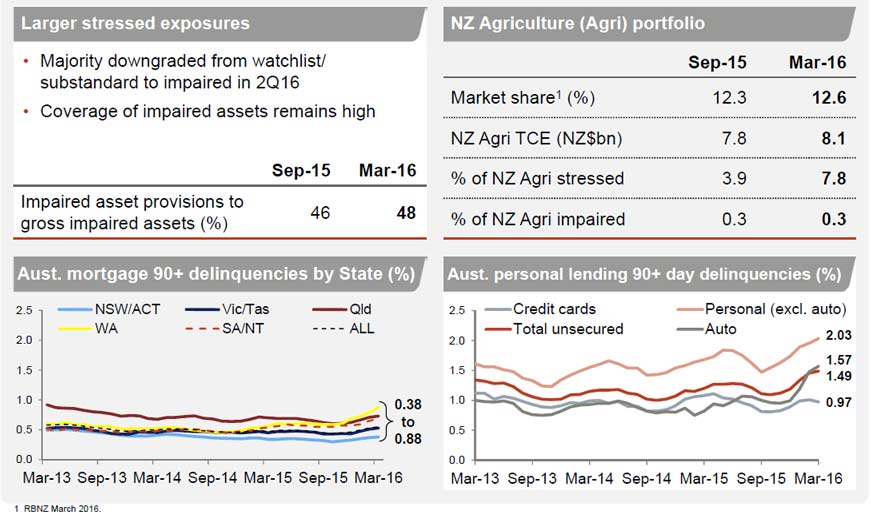
Ben8Lending will be important and they wish to grow their books, with a focus on mortgages and small business (both highly contested areas). Arrears on mortgages and business seem under control.

Ben9Ben10They have a significant investment path in order to build the digital platform and IRB models. Restructure costs will be $2m or more in the half. The question will be whether the benefits out way the costs. You cannot really argue with the strategy, (though, it is not really a mobile first strategy), but its all about effective execution in a highly contested environment. The high customer satisfaction ratings will certainly assist.


Where Did The 10% Investor Mortgage Growth Speed Limit Come From?

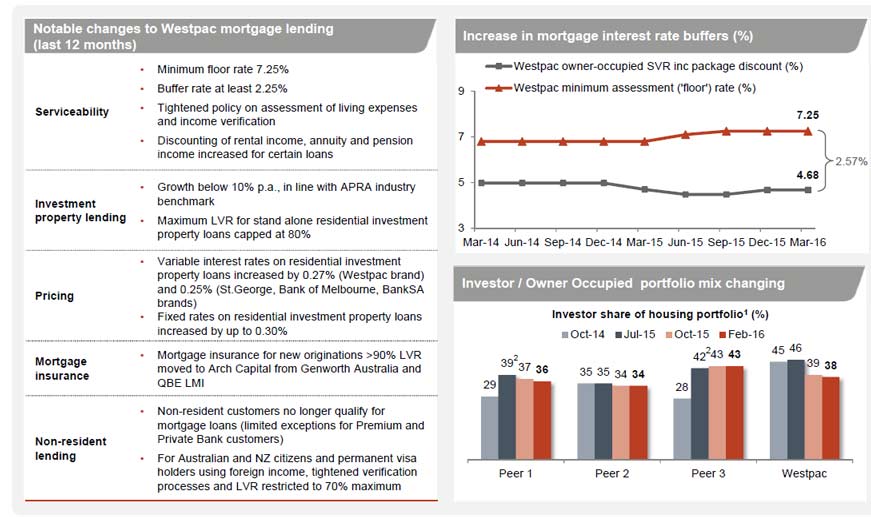
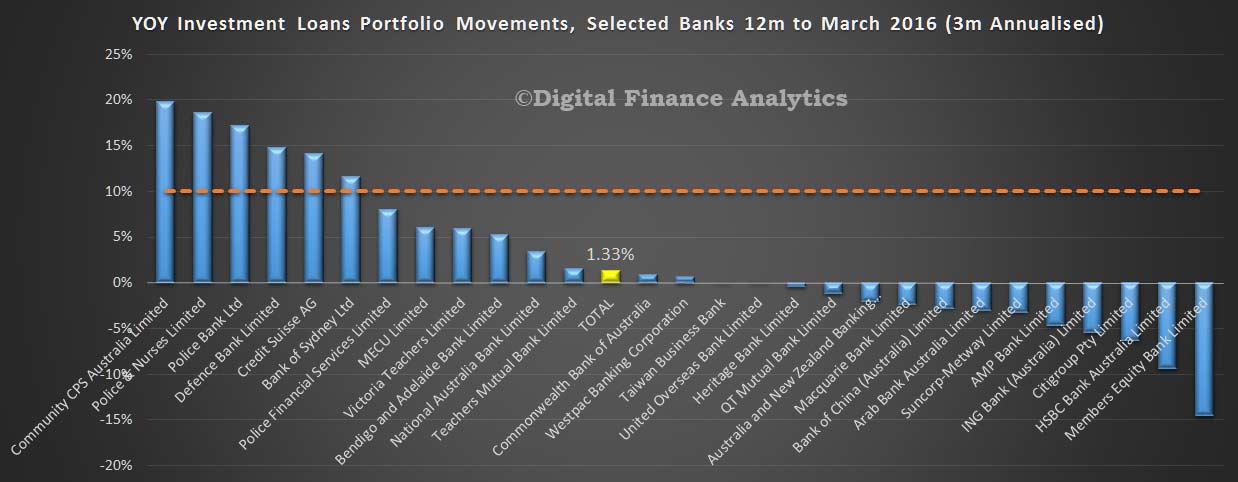
An interesting FOI disclosure from the RBA tells us something about the discussions which went on within the regulators in 2014 and beyond, as they considered the impact of the rise in investor loans. Eventually of course APRA set a 10% speed limit, and we have see the growth in investment loans slow significantly and underwriting standards tightened.

Back then, they discussed the risks of investment lending rising, especially in Melbourne.

Macroeconomic: Extra speculative demand can amplify the property price cycle and increase the potential for prices to fall later. Such a fall would affect household spending and wealth. This effect is likely to be spread across a broader range of households than the investors that contributed to the heightened activity.

Concentration risk: Lending has been concentrated in Sydney and Melbourne, creating a concentrated exposure in these cities. The risk could come from a state-based economic shock, or if the speculative upswing in demand brings forth an increase in construction on a scale that leads to a future overhang of supply. In Sydney, the risk of oversupply appears limited because of the pick-up in construction follows a period of limited new supply and it has been spread geographically and by dwelling type. While the unemployment rate has picked up a little over the past 18 months, the overall economic environment in NSW is in a fairly good state. In Melbourne, there has been a greater geographic concentration of higher-density construction in inner-city areas. Some developments have a concentration of smaller-sized apartments that may only appeal to some renters, or purchasers in the secondary market. Economic conditions are not as favourable in Victoria and the unemployment rate is 6.8%.

Low interest rate environment: While a pick-up in risk appetite of households is to some extent an expected outcome given the low interest rate environment, their revealed preference is to direct investment into the housing market.  Historically low interest rates (combined with rising housing prices and strong price competition in the mortgage market) means that some households may attempt to take out loans that they would not be able to comfortably service in a higher interest rate environment. APRA’s draft Prudential Practice Guide (PPG) emphasises that ADIs should apply an interest rate add-on to the mortgage rate, in conjunction with an interest rate floor in assessing a borrower’s capacity to service the loan. In order to maintain the risk profile of borrowers when interest rates are declining, the size of the add-on needs to increase (or the floor needs to be sufficiently high).

Lending standards: In aggregate, banks’ lending standards have been holding fairly steady overall; lending in some loan segments has eased a little, while lending in some other segments has tightened up a bit. The main lending standard of concern is the share of interest-only lending, both to owner-occupiers and investors. For investors, 64% of banks’ new lending is interest-only loans and for owner-occupiers the share is 31%. The typical interest-only period is 5 years, but some banks allow the interest-only period to extend to 15 years. During this period, the loan is amortising more slowly than a loan that requires principal and interest (P&I) payments. If housing prices should fall, this increases the risk that the loan balance may exceed the property value (negative equity). There is some risk that the borrower could face difficulty servicing the higher P&I payments when the interest-only period ends, although this is typically mitigated by banks assessing interest-only borrowers on their ability to make P&I payments.

Of course the regulators found underwriting standards were more generous than they thought, at times in 2015 more than half of all new loans were investment loans, and recently banks have reclassified loans, causing the absolute proportion of investment loans to rise. Things were whose than they thought.

Next they discussed how to set the “right” growth rate:

How to calibrate the benchmark growth rate?  Household debt has been broadly stable as a share of income for about a decade. National aggregate ratios are not robust indicators of a sector’s resilience because the distribution of debt and income can change over time. But as a first pass, it is reasonable to expect that the current level of the indebtedness ratio is sustainable in a range of macroeconomic circumstances. Therefore there does not seem to be a case to set the benchmark growth rate significantly below the rate of growth of household income, in order to achieve a material decline in the indebtedness ratio. With growth in nominal household disposable income running at a little above 3 per cent, this sets a lower bound for possible benchmarks at around 3 per cent. Current growth in investor credit, at nearly 10 per cent, suggests an upper bound around 8 per cent to achieve
some comfort about the leverage in this market. Within this range, there are several options for the preferred benchmark rate for investor housing credit growth (including securitised credit).

a) Around 4½ per cent, based on projected household disposable income growth over calendar 2015. This could be justified as being consistent with stabilising the indebtedness ratio. However, it would be procyclical, in that it would be responding to a period of slow income growth by insisting that credit growth also slow. It would also be materially slower than the current rate of owner-occupier credit growth, which so far has not raised systemic concerns.

b) Around 6 per cent, based on a reasonable expectation of trend growth in disposable income, once the effects of the decline in the terms of trade have washed through. It is also broadly consistent with current growth in owner-occupier housing credit, which as noted above has not been seen as adding materially to systemic risk.

c) 7 per cent, consistent with the system profile for residential mortgage lending already agreed as part of the LCR/CLF process. Unless owner-occupier lending actually picks up from its current rate, however, the growth in investor housing credit implied by the CLF projections would be stronger than this. It is therefore not clear that these projections should be the basis for the preferred benchmark.

Staff projections suggest that only a moderate decline in system investor loan approvals would be required to meet a benchmark growth rate for investor housing credit in the 5–7 per cent range for calendar 2015. The exact size of the decline depends partly on assumptions about repayments through churn, refinancing and amortisation in the investor housing book. For a reasonable range of values for this implied repayment rate, and assuming that investor housing credit growth remains at its current rate for the remainder of 2014, the required decline in investor approvals is of the order of 10–20 per cent. This would take the level of investor housing loan approvals back to that seen a year ago. It is worth noting that investor loan approvals would have to increase noticeably from here to sustain the current growth rate of investor housing credit, even though the implied repayment rate is a little below its historical average. Since credit is not available at a state level, the benchmark can only be expressed as a national growth rate. The flow of loan approvals at a state level can be used as a cross-check to ensure that the benchmark incentive has had its greatest effects in the markets that have been strongest recently.

When the 10% cap (note this is higher than those bands discussed above) was announced, some Q&A’s provide some insights into their thinking.

Isn’t 10 per cent a bit soft?  We are not trying to kill the market stone dead. Investor housing credit is currently running at a bit under 10 per cent. Some lenders will have investor credit growth well below this benchmark anyway, so if all lenders do end up at least a little under this benchmark, which we hope they will, then aggregate growth in investor credit will be noticeably below 10 per cent. Setting a benchmark for individual institutions is not the same thing as setting it for an aggregate, and APRA has allowed for that.

Where did the 10 per cent benchmark come from?  This was a collective assessment by the Council agencies. We took the view that we did not want to clamp down on the market excessively. We also took the view that in the long run, household credit can expand sustainably at a rate something like the rate of trend nominal household income growth, maybe a bit more or less in shorter periods. Trend income growth is below 10 per cent, more like 6 per cent or thereabouts. But it was important to make an allowance for the fact that some lenders will undershoot the benchmark, so the aggregate result will likely be slower than that.

But isn’t household income growth likely to be below average in the next few years, because of the end of the mining boom?  Maybe, but we don’t want to be procyclical and clamp down on credit supply more when the economy growing below trend.

This of course confirms the regulators were wanting to use household debt as an economic growth engine (interesting, see the recent post “Why more-finance-is-the-wrong-medicine-for-our-growth-problem” )

We also see a significant slow down in household income growth, yet credit growth, especially housing has been stronger, creating higher risks if interest rates or unemployment was to rise. Raises the question, were the regulators too slow to act, and did they calibrate their interventions correctly? We will see.


Risks to Global Financials Stability Have Increased – IMF

The IMF just released the latest edition of its Global Financial Stability Report.  It’s 118 pages makes grim reading. They highlight a number of elevated risks, and advocate more proactive policies, including the adoption of macroprudential measures. They highlight elevated funding risks to banks, risks to banking models from the ultra low interest rates, and disruption to global asset markets. Significantly, the indicators are that interest rates are likely to fall, not rise.

IMF-GFS-2016-1Risks to global financial stability have increased since the October 2015 Global Financial Stability Report. In advanced economies, the outlook has deteriorated because of heightened uncertainty and setbacks to growth and confidence.

Disruptions to global asset markets have added to these pressures. Declines in oil and commodity prices have kept risks elevated in emerging market economies, while greater uncertainty about China’s growth transition has increased spillovers to global markets. These developments tightened financial conditions, reduced risk appetite, raised credit risks, and stymied balance sheet repair, undermining financial stability.

Many market prices dropped dramatically during the turmoil in January and February, moving asset valuations to levels below those consistent with macroeconomic fundamentals that suggest a steady but slowly improving growth path (see the April 2016 World Economic Outlook). Instead, heightened market volatility and risk aversion may have reflected rising economic, financial, and political risks as well as weakened confidence in policies. The recovery in asset prices since February has reversed much of these losses and lowered volatility. Market sentiment has been supported by higher oil and commodity prices, stronger data out of the United States, and supportive actions by central banks. But the net impact of the turmoil has been a shock to confidence, with negative repercussions for financial stability.

The main message of this report is that additional measures are needed to deliver a more balanced and potent policy mix for improving the growth and inflation outlook and securing financial stability. In the absence of such measures, market turmoil may recur. In such circumstances, rising risk premiums may tighten financial conditions further, creating a pernicious feedback loop of fragile confidence, weaker growth, lower inflation, and rising debt burdens. Disruptions to global asset markets could increase the risks of tipping into a more serious and prolonged slowdown marked by financial and economic stagnation. In a situation of financial stagnation, financial institutions responsible for the allocation of capital and mobilization of savings might struggle with impaired balance sheets for an extended period of time. Financial soundness could become eroded to such an extent that both economic growth and financial stability are adversely affected in the medium term. In such a scenario, world output could fall by 3.9 percent relative to the baseline by 2021.

Policymakers need to build on the current economic recovery and deliver a stronger path for growth and financial stability by tackling a triad of global challenges—legacy challenges in advanced economies, elevated vulnerabilities in emerging markets, and greater systemic market liquidity risks. Progress along this path will enable the world’s economies to make a decisive break toward a strong and healthy financial system and a sustained recovery. In such a scenario, world output could expand by 1.7 percent relative to the baseline by 2018.

Advanced economies must deal with crisis legacy issues. Banks in advanced economies have become safer in recent years, with stronger capital and liquidity buffers and progress in repairing balance sheets. Despite these gains, banks came under market pressure at the start of the year, reflecting concerns about the profitability of banks’ business models in a weak economic environment. Approximately 15 percent of banks in advanced economies (by assets) face significant challenges in attaining sustainable profitability without reform.

IMF-GFS-2016-2 In the euro area, market pressures also highlighted long-standing legacy issues, indicating that a more complete solution to European banks’ problems cannot be further postponed. Elevated nonperforming loans urgently need to be tackled using a comprehensive strategy, and excess capacity in the euro area banking system will have to be addressed over time. In the United States, mortgage markets—which were at the epicenter of the 2008–09 crisis—continue to benefit from significant government support. Authorities should reinvigorate efforts to reduce the dominance of Fannie Mae and Freddie Mac and continue with reforms of these institutions.

Chapter 3 shows that across advanced economies, the contribution of the insurance sector—particularly life insurers—to systemic risk has increased, although not yet to the level of the banking sector. This increase is largely a result of growing common exposures to aggregate risk, partly because insurers’ interest rate sensitivity has risen and partly because of higher correlations across asset classes. In the event of an adverse shock, therefore, insurers are unlikely to fulfill their role as financial intermediaries at a time when other parts of the financial system are also struggling to do so. These findings suggest that a more macroprudential approach to supervision and regulation of insurance companies should be taken. Measures could include regular macroprudential stress testing or the adoption of countercyclical capital buffers. Steps that would complement a push for stronger macroprudential policies include the international adoption of capital and transparency standards for the sector. In addition, the different behavior of smaller and weaker insurers warrants attention by supervisors.

Emerging markets need to bolster their resilience to global headwinds. Emerging market economies are faced with a difficult combination of slower growth, weaker commodity prices, and tighter credit conditions, amid more volatile portfolio flows. This mixture has kept financial and economic risks elevated. So far, many economies have shown remarkable resilience to this more difficult domestic and external environment, as policymakers have made judicious use of buffers in strengthened policy frameworks.

Commodity-related firms are cutting capital expenditures sharply as high private debt burdens reinforce risks to credit and banks. Commodity exporting countries and those in the Middle East and the Caucasus are particularly exposed to strains across the real economy and the financial sector. The nexus between state-owned enterprises (SOEs) and sovereigns has intensified, and could increase fiscal and financial stability risks in countries with repayment pressures. More broadly, debt belonging to nonfinancial corporations with reduced ability to repay have risen to $650 billion, or 12 percent of total corporate debt of listed firms considered in this report. Bank capital buffers are generally adequate, but will likely be tested by weaker earnings and the downturn in the credit cycle.

Emerging market economies generally have the tools to boost their resilience and counter the effects of lower commodity prices and the slowdown in growth and capital flows. Authorities in emerging market economies should continue to use their buffers and policy space, where available, to smooth adjustment and strengthen sovereign and bank balance sheets. This includes using external buffers, fiscal and monetary policy, and macroprudential and supervisory frameworks, among other tools. Countries with insufficient buffers and limited policy space should act early by adjusting macroeconomic policies to address their vulnerabilities, including by seeking external support.

China’s economic rebalancing is gaining traction. The country has made notable progress in rebalancing its economy toward new sources of growth and addressing some financial sector risks. In addition, stricter regulation of shadow banking activities has helped steer the composition of financing toward bank loans and bond issuance. Nevertheless, China’s rebalancing is inherently complex, and commitment to a more ambitious and comprehensive policy agenda is urgently needed to stay ahead of rising vulnerabilities.

Slowing growth has eroded corporate sector health, with falling profitability undermining the debt servicing capacity of firms holding some 14 percent of the debt of listed companies, adding to balance sheet stresses across the system. A comprehensive plan to address the corporate debt overhang would assist a steady deleveraging process. Corporate deleveraging should be accompanied by a strengthening of banks and social safety nets, especially for displaced workers in overcapacity sectors. A comprehensive restructuring program to deal with bad assets and strengthen banks should be developed swiftly, along with a sound legal and institutional framework for facilitating bankruptcy and debt-workout processes.

Chapter 2 finds that spillovers of emerging market shocks to equity prices and exchange rates have risen substantially, and now explain more than a third of the variation in asset returns. This underscores the importance for policymakers in both advanced economies and emerging markets of taking account of economic and policy developments in emerging market economies when assessing domestic macro-financial conditions.

Financial integration, more than economic size and trade integration, is key to an emerging market economy’s role as receiver and emitter of financial spillovers. The level of integration explains, for example, why purely financial contagion from China remains less significant even as the impact of Chinese growth shocks is increasingly important for equity returns in both emerging market and advanced economies. As China’s role in the global financial system continues to grow, clear and timely communication of its policy decisions and transparency about its policy goals and strategies consistent with their achievement will be ever more important. Given the evident relevance of corporate leverage and mutual fund flows in amplifying spillovers of shocks, shaping macroprudential surveillance and policies to contain systemic risks arising from these channels will be vital.

The resilience of market liquidity should be enhanced. As discussed in previous reports, a comprehensive approach to reducing risks of liquidity runs on mutual funds and strengthening the provision of market liquidity services is needed to avoid the risk of amplifying market shocks.

The stakes are high. First, rising risks of weakening growth and more instability must be avoided. Then, growth must be strengthened and financial stability improved beyond the baseline. An ambitious policy agenda is required, comprising a more balanced and potent policy mix, including stronger financial reforms together with continuing monetary accommodation. Increased confidence in policies will help reduce vulnerabilities, remove uncertainties, and touch off a virtuous feedback loop between financial markets and the real economy.

Why it is good policy, not bad politics, to ignore bad modelling on negative gearing

From The Conversation.

Negative gearing and capital gains tax are a looming battleground in the federal election. The debate was heightened last month by the release of modelling by consultants BIS Shrapnel purporting to show that reforms would lead to rent increases of between 4% and 10%. If correct, this would scare any political party.

An article in The Australian on Tuesday revealed that the ALP had seen this modelling before it released its policy to wind back the tax breaks on negative gearing and capital gains,

The ALP should be applauded for proceeding nevertheless. The report was clearly going to be inconvenient. But it was also not worth the paper on which it was printed.

The report implied that a $2 billion increase in tax would reduce economic activity by $19 billion a year. The report’s model also suggested that every additional house or apartment would increase the size of the Australian economy by $2.6 million.

None of this is remotely plausible, and consequently, it is difficult to believe anything else that the modelling or the report has to say.

Nonetheless, this report is still being discussed a month later – so it clearly needs some more critical analysis.

Tax changes will clearly reduce the after tax benefits for property investors. The key question is whether the market responds by reducing the price of housing, or by increasing rents, or by absorbing a reduction in returns.

Most likely, the price of housing will fall somewhat, investor returns will reduce a little, and rents will barely move. This is why.

Changes to negative gearing and capital gains tax will increase taxes for investors and lower their returns. Normally this would lead to lower asset prices.

But the outlook for home-buyers is different. The benefits for a home-buyer (of living in the home) won’t change. The price of the home will be a little lower due to the changes in negative gearing and capital gains tax. Therefore the return on assets (the benefits divided by the price) will be a little higher for home-buyers.

Combining the effects of the changes for investors and home-owners leads to an average after tax return on housing that is about the same as today. There will be more home-owners and correspondingly fewer investors – but higher rates of home ownership are the political goal.

The outcome might be different if the supply of new housing dried up. If there were fewer incentives to develop new homes, then eventually rents would increase.

However, our best guess is that tax changes will have little effect on housing construction. The supply of new housing is mainly restricted by planning rules rather than a lack of returns. In any case, reforms to negative gearing are likely to reduce the price of developable land, but they won’t change the returns on development.

BIS Shrapnel assume otherwise. They believe that changes to negative gearing rules will reduce the price and therefore the profitability of property developments, but not the price of developable land. And so they assert that tax changes will lead to less residential development, and therefore higher rents in the long run. Their report assumed that the price of developable land wouldn’t change based on three claims.

First claim: if the price of developable housing land fell, sites would instead be used for commercial purposes. But as a firm that advises clients on property development, BIS Shrapnel should know that in most localities land provides a much higher return per square metre when turned into residences than when used for commercial purposes. Indeed, there are concerns that too much of the Melbourne and Sydney CBDs is being converted to residential rather than commercial uses. There isn’t much evidence of enormous pent-up demand for commercial development.

Second claim: landholders will be reluctant to sell at lower prices. This is simply wishful thinking. Prices don’t rise just because sellers would like them to do so.

Third claim: it will be more expensive to aggregate sites for development. But lower prices as a result of negative gearing reform will affect all residential properties, irrespective of whether they have already been developed, or have potential to be aggregated further.

Instead of assuming that tax changes will only affect the price of development, it is much more plausible that changes in after tax returns to investors will primarily lead to lower land prices. This won’t hurt the profitability of development, the supply of rental property will continue, and the impacts on rents will be minimal.

Even if tax changes did affect the profitability of development, it’s all small beer. Quick sanity checks (the kind of things that property developers do to ensure that their modellers don’t lose them a fortune) show that the effect of negative gearing changes on property prices will be less than 2 per cent across the Australian market.

One way to think about it is that negative gearing and capital gains tax provide investors in real estate with a tax benefit of about $3 billion a year; that annual benefit converts to an asset value of about $55 billion; and all Australian residential property is worth a little over $5 trillion. If negative gearing were abolished entirely the lost value would be $55 billion, just over 1 per cent of $5 trillion of property value.

Another way to crunch the numbers shows that negative gearing and capital gains tax changes would reduce the after tax returns on real estate investment assets by about 7 per cent. But this wouldn’t affect all housing assets – only 30 per cent are investment properties, and the rest are owner occupied. So across the market, return on assets – and therefore asset values –would fall by about 2 per cent. Or in the unlikely event that investors succeed in passing on tax costs, rents would rise by at most 2 per cent.

BIS Shrapnel presented the ALP with a claim that tax changes would increase rents by 4 to 10 per cent. But that claim was several times larger than fundamentals would suggest. It used a model that was not publicly available. It was allied with a series of manifestly ridiculous economic results. And it all rested on an unjustifiable assumption that tax changes won’t affect land prices.

The ALP was right to ignore such flawed analysis. It is a relief to discover that – sometimes – a political party’s policy cannot be bought off just by commissioning a flawed report with scary numbers.

Author: John Daley, Chief Executive Officer , Grattan Institute

Real Estate Investment In Australia From China Doubled Last Year – FIRB

China foreign investment in real estate in Australia doubled that last year, according to the Foreign Investment Review Board (FIRB) in their annual report for the year 2014-2015. Total foreign investment approvals across all categories were worth $194.6 billion. No applications were rejected last year, though some were approved only with conditions.

Looking at the real estate sector, we see significant growth in applications compared with previous years.

FIRB-2014-1Approved investment in real estate (comprising commercial and residential proposals) was $96.9 billion in 2014-15 (compared with $74.6 billion in 2013-14). Residential approvals rose from $34.7 billion in 2013-14 to $60.75, of which $49.25 billion were for development.

Looking at the state analysis, VIC leads the way in terms of the number and value of approvals. For example VIC had $20.6 billion of developments for approval, compared with $16.24 billion in NSW.

FIRB-2014-2The FIRB report includes a state analysis by type of development

FIRB-2014-3Our analysis shows the largest proportion of new dwelling approvals in NSW, compared with VIC and QLD. On the other hand, VIC had the highest proportion of existing property and vacant land approvals.

FIRB-2014-4The Country data provided by the FIRB report does not separate residential real estate from commercial property. That said, the data shows China as the largest investor, based on number of approvals and value. In the previous year, China originated 14,716 approvals, compared with 25,431 in 2014-15 overall, whilst real estate was worth $12.4 billion in 2013-14 compared with $24.3 billion in 2014-15.

FIRB-2014-5


Basel III Progress Assessment Published

The Bank for International Settlements (BIS) has released the 10th status report on the adoption of the Basel regulatory framework. We summarise the elements within Basel III and their target dates, and the status of Basel III in Australia. The complexity of the overall approach is highlighted. It also shows the journey to Basel III is far from complete. Today the IMF Working Paper highlighted the deficiency in the approach in connection with mortgage finance.  We are not convinced more complexity is necessarily better.

As of March 2016, all 27 member jurisdictions have final risk-based capital rules, LCR regulations and capital conservation buffers in force, 24 have issued final rules for the countercyclical capital buffers and 23 have issued final or draft rules for their domestic SIBs framework. With regard to the global SIBs framework, all members that are home jurisdictions to G-SIBs have the final framework in force. Members are now turning to the implementation of other Basel III standards, including the leverage ratio and the net stable funding ratio (NSFR).

Regarding the consistency of regulatory implementation, the Committee has published its assessment reports on 24 members – Australia, Brazil, Canada, China, nine members of the European Union, Hong Kong SAR, India, Japan, Saudi Arabia, Mexico, Russia, Singapore, South Africa, Switzerland, Turkey and the United States – regarding their implementation of Basel risk-based capital regulations.

The Basel III framework builds on and enhances the regulatory framework set out under Basel II and Basel 2.5.

Basel III Capital: In December 2010, the Committee released Basel III, which set higher levels for capital requirements and introduced a new global liquidity framework. Committee members agreed to implement Basel III from 1 January 2013, subject to transitional and phase-in arrangements.

  • Capital conservation buffer: The capital conservation buffer is phased in between 1 January 2016 and year-end 2018, becoming fully effective on 1 January 2019.
  • Countercyclical buffer: The countercyclical buffer is phased in parallel to the capital conservation buffer between 1 January 2016 and year-end 2018, becoming fully effective on 1 January 2019.
  • Capital requirements for equity investment in funds: In December 2013, the Committee issued the final standard for the treatment of banks’ investments in the equity of funds that are held in the banking book, which will take effect from 1 January 2017.
  • Standardised approach for measuring counterparty credit risk exposures (SA-CCR): In March 2014, the Committee issued the final standard on SA-CCR, which will take effect from 1 January 2017. It will replace both the Current Exposure Method (CEM) and the Standardised Method (SM) in the capital adequacy framework, while the IMM (Internal Model Method) shortcut method will be eliminated from the framework.
  • Securitisation framework: The Committee issued revisions to the securitisation framework in December 2014 to strengthen the capital standards for securitisation exposures held in the banking book, which will come into effect in January 2018.
  • Capital requirements for bank exposures to central counterparties: In April 2014, the Committee issued the final standard for the capital treatment of bank exposures to central counterparties, which will come into effect on 1 January 2017.

Basel III leverage ratio: In January 2014, the Basel Committee issued the Basel III leverage ratio framework and disclosure requirements. Implementation of the leverage ratio requirements began with bank-level reporting to national supervisors until 1 January 2015, while public disclosure started on 1 January 2015. The Committee will carefully monitor the impact of these disclosure requirements. Any final adjustments to the definition and calibration of the leverage ratio will be made by 2017, with a view to migrating to a Pillar 1 (minimum capital requirements) treatment on 1 January 2018 based on appropriate review and calibration.
Basel III liquidity coverage ratio (LCR): In January 2013, the Basel Committee issued the revised LCR. It came into effect on 1 January 2015 and is subject to a transitional arrangement before reaching full implementation on 1 January 2019.7
Basel III net stable funding ratio (NSFR): In October 2014, the Basel Committee issued the final standard for the NSFR. In line with the timeline specified in the 2010 publication of the liquidity risk framework, the NSFR will become a minimum standard by 1 January 2018.
G-SIB framework: In July 2013, the Committee published an updated framework for the assessment methodology and higher loss absorbency requirements for G-SIBs. The requirements came into effect on 1 January 2016 and become fully effective on 1 January 2019. To enable their timely implementation, national jurisdictions agreed to implement by 1 January 2014 the official regulations/legislation that establish the reporting and disclosure requirements.
D-SIB framework: In October 2012, the Committee issued a set of principles on the assessment methodology and the higher loss absorbency requirement for domestic systemically important banks (D-SIBs). Given that the D-SIB framework complements the G-SIB framework, the Committee believes it would be appropriate if banks identified as D-SIBs by their national authorities were required to comply with the principles in line with the phase-in arrangements for the G-SIB framework, ie from January 2016.
Pillar 3 disclosure requirements: In January 2015, the Basel Committee issued the final standard for revised Pillar 3 disclosure requirements, which will take effect from end-2016 (ie banks will be required to publish their first Pillar 3 report under the revised framework concurrently with their year-end 2016 financial report). The standard supersedes the existing Pillar 3 disclosure requirements first issued as part of the Basel II framework in 2004 and the Basel 2.5 revisions and enhancements introduced in 2009.
Large exposures framework: In April 2014, the Committee issued the final standard that sets out a supervisory framework for measuring and controlling large exposures, which will take effect from 1 January 2019.

The structure of the attached table has been revamped (effective from October 2015) to monitor the adoption progress of all Basel III standards, which will come into effect by 2019.

Australian-Basel-2016


Trend Housing Finance Falls In February

Data from the ABS today shows that the trend housing finance flows in February excluding alterations and additions fell 0.4%. Owner occupied housing commitments fell 0.6%, while investment housing commitments was flat. Owner occupied loans were worth $21 billion, and Investment loans were worth $11.5 billion. The proportion of loans for investment purposes (excluding for refinance) rebounded to 45.4%. Investment housing loans are still in demand.

Housing-Finance-Feb-2016-TrendHowever, the more dodgy seasonally adjusted data showed that the total value of dwelling finance commitments excluding alterations and additions rose 2.6%. This volatile series is often the one picked up in the press, but the ABS specifically warns about the seasonally adjusted numbers:

Market reactions to regulatory measures implemented by APRA in 2015 has resulted in increased volatility in some of the seasonally adjusted estimates included in this publication, particularly the value of finance commitments for owner occupied housing and investor housing. Care should be taken in interpreting the movements for this reference period, as the seasonally adjusted estimates may be revised in future periods.

Refinancing of existing loans continues to lift as a proportion of all owner occupied loans, from 34.2% to 34.6% of all loans. This reflects the intense focus in the market on refinance by the banks, and the deep discounting on offer.  But the value of loans for the purchase of existing property fell 2.9%, whilst the value of refinanced loans fell 1.6%.

Value-By-Month-Feb-2016

In trend terms, the number of commitments for owner occupied housing finance were flat in February 2016 whilst the number of commitments for the purchase of new dwellings fell 1.5%, the number of commitments for the construction of dwellings fell 0.2%, and the number of commitments for the purchase of established dwellings rose 0.1%.

In original terms, the number of first home buyer commitments as a percentage of total owner occupied housing finance commitments fell to 14.7% in February 2016 from 15.1% in January 2016.

FTB-Feb-2016

The adjusted first time buyer data which includes a count of first time buyers going direct to the investment sector fell slightly, whilst the number of first time owner occupied buyers lifted by 16.3%, from 6,669 to 7,757. The average first time buyer loan fell again by 3.9%, from $338,000 to 327,500, reflecting tighter lending criteria. The average loan size for other borrowers also fell 4.2% from $374,300 to $358,500.

DFA-FTB-Tracker-Feb-2016

Lending momentum appears to be slowing across most states, though WA, already lower, moved up slightly.

State-Change-Feb-2016 So overall, momentum is easing a little, but demand for refinance is being stoked by the deep discounts on offer, investment property is still being purchase (including by some first time buyers), whilst the average loans values are down in response to the regulatory intervention. Lack of top line loan growth, if it continues, will have serious implications for bank profitability, and house prices. Also, consider those who hold loans currently outside today’s lending criteria, when the banks were lending more freely. Will some of those come home to roost?

Latest Edition Of The Quiet Revolution Shows Mobile First Strategy Now Essential

Digital Finance Analytics has today released the updated edition of our flagship household banking channel report, “The Quiet Revolution”, which is available free on request.

Quiet-Revolution-2016-CoverIn this report we examine the latest trends in banking channel use across our household segments. The move towards digital channels continues apace. We have reached a tipping point where “Mobile First” strategies should be the order of the day.

Digital Finance Analytics executes weekly omnibus surveys across a statistically representative set of households nationally. We collect data from 500 each week, and maintain a national database of 26,000 households. The data is then collated and analysed by segment. The channel aspects of the research look across the – search, apply, buy, transact and service – value chains. We also examine trends over time, and consumer device preferences. We rate channel preference using an algorithm which scores both what consumer has been doing in the last year, and an assessment of their desired future preference for channels and functionality.

The Quiet Revolution report contains a summary of the findings. Note that more detailed material, at a product level is available on a commercial basis.

Looking at channel usage on a segmented basis, compared with the last report from 2013-4, it is clear that online migration continues to deepen, and has spilled over into segments which traditionally were branch aligned. This is because of the rapid adoption of smart devices and “apps” which make online interaction easier. Banks are now providing a range of functionality on iOS, Android and Windows platforms. There is still a gap however between what is on offer and what is desired.

We find that younger households continue to be strongly aligned to online, whereas battlers and disadvantaged groups are more branch centric. Older wealthier groups prefer online, whereas older seniors and multicultural groups are still more branch orientated. There have been significant increases in time online between 2013 and 2016, especially among those segments will lower online penetration rates. Young consumers are connected on average for more than 110 hours each week, and nearly 85% of this time is spent with social media, video or other media and blogs. Web sites and internet banking only take a small amount of their time. Even battlers, who are spending less time online, still spend more than 75% of their time on social media and video sites.

We also examine trends across our digital segmentation, between those who are digital Natives (always used digital), Migrants (learning to use digital) and Luddites (not willing or able to use digital). The segments are distributed across the age ranges and shows the migration underway. Most younger households are natively digital, and the number of Luddites will continue to reduce, naturally. The financial footprints of these three segments are different. On average digital Natives have a  higher income than digital Migrants, who in turn have larger incomes than Luddites.

Digital Finance Analytics captures detailed financial footprint data in our surveys, and we are able to use this information to estimate a relative industry profit score by segment. We find that on average Luddites have a lower profit score compared with Natives and Migrants. Indeed, Migrants have the highest score. We found that the banking product mix varied by segment and in the report we explore the product mix in more detail.

High cost branches are being used more by lower profit customers. Given the migration underway we would expect to see a reduction in branch footprints. However, our analysis reveals this is not so for many of the major players. We conclude that so far many banks are not responding to the digital revolution by closing branches, although some have reconfigured them into smaller and more efficient units. In terms of closures, ANZ stands out as leading the way.

We also examined the prospective impact of Robo-Advice from a household perspective using data from our household surveys. We have found that currently those who have received financial advice already, and who are most digitally aware would readily consider Robo-Advice services. Our conclusion is that rather than growing and extending advice to more Australian households, the first impact of Robo-Advice will be to cannibalise existing advisor relationships.

Also, there are many different potential offerings which should be constructed on a Robo-Advice basis, as the needs of young affluent, are very different from say exclusive professionals. So effective segmentation of the offers will be essential, and different personas will need to be incorporated into the systems being developed.

So, in summary, The Quiet Revolution highlights that existing players need to be thinking about how they will deploy appropriate services through digital channels, as their customers are rapidly migrating there. We see this migration to digital more advanced amongst higher income households but momentum continues to spread. So players which are slow to catch the wave will be left with potentially less valuable customers longer term. Players need to adapt more quickly to the digital world. We are way past an omni-channel (let them choose a channel) strategy. We need to adopt a “mobile-first” strategy. Such digital migration needs to become central strategy because the winners will be those with the technical capability, customer sense and flexibility to reinvent banking in the digital age. The bank branch has limited life expectancy. Banks should be planning accordingly.

Request the report [31 pages] using the form below. You should get confirmation your message was sent immediately and you will receive an email with the report attached after a short delay.

Note this will NOT automatically send you our research updates, for that register here. You can find details of our other research programmes here.

[contact-form to=’mnorth@digitalfinanceanalytics.com’ subject=’Request The Quiet Revolution Report II – 2016′][contact-field label=’Name’ type=’name’ required=’1’/][contact-field label=’Email’ type=’email’ required=’1’/][contact-field label=’Email Me The Report’ type=’radio’ required=’1′ options=’Yes Please’/][contact-field label=’Comment if You Like’ type=’textarea’/][/contact-form]

The previous edition is still available, in which we discuss the digital branding of incumbents and challengers, using our thought experiment.

The “deadly embrance” between housing, house prices, and bank mortgages

An interesting IMF working paper “Mitigating the Deadly Embrace in Financial Cycles: Countercyclical Buffers and Loan-to-Value Limits” examines the limitations of Basel III in the home loan market, and makes the point that the risk-weighted focus, even with enhancement, does not cut the mustard especially in a rising or falling property market. Indeed, there is a “deadly embrance” between housing, house prices, and bank mortgages which naturally leads to housing boom and bust cycles, which can be very costly for the economy and difficult for central banks to manage. They find that macroprudential measures may assist, but even then the deadly embrace remains.

The financial history of the last eight centuries is replete with devastating financial crises, mostly emanating from large increases in financial leverage.  The latest example, the Global Financial Crisis of 2008-09, saw the unwinding of a calamitous run-up in leverage by banks and households associated with the housing market. As a result, the financial supervision community has acknowledged that microprudential regulations alone are insufficient to avoid a financial crisis. They need to be accompanied by appropriate macroprudential policies to avoid the build-up of systemic risk and to weaken the effects of asset price inflation on financial intermediation and the buildup of excessive leverage in the economy.

The Basel III regulations adopted in 2010 recognize for the first time the need to include a macroprudential overlay to the traditional microprudential regulations. Beyond the requirements for capital buffers, and leverage and liquidity ratios, Basel III regulations include CCBs between 0.0 and 2.5 percent of risk-weighted assets that raise capital requirements during an upswing of the business cycle and reduce them during a downturn. The rationale is to counteract procyclical-lending behavior, and hence to restrain a buildup of systemic risk that might end in a financial crisis. Basel III regulations are silent, however, about the implementation of CCBs and their cost to the economy, leaving it to the supervisory authorities to make a judgment about the appropriate timing for increasing or lowering such buffers, based on a credit-to-GDP gap measure. This measure, however, does not distinguish between good versus bad credit expansions and is irrelevant for countries with significant dollar lending, where exchange rate fluctuations can severely distort the credit-to-GDP gap measure.

One of the limitations of Basel III regulations is that they do not focus on specific, leverage-driven markets, like the housing market, that are most susceptible to an excessive build-up of systemic risk. Many of the recent financial crises have been associated with housing bubbles fueled by over-leveraged households. With hindsight, it is unlikely that CCBs alone would have been able to avoid the Global Financial Crisis, for example.

For this reason, financial supervision authorities and the IMF have looked at additional macroprudential policies. For the housing market, three additional types of macroprudential regulations have been implemented: 1) sectoral capital surcharges through higher risk weights or loss-given-default (LGD) ratios;3 2) LTV limits; and 3) caps on debt-service to income ratios (DSTI), or loan to income ratios (LTI). Use of such macroprudential regulations has mushroomed over the last few years in both advanced economies and emerging markets. At end-2014, 23 countries used sectoral capital surcharges for the housing market, and 25 countries used LTV limits. An additional 15 countries had explicit caps on DSTI or LTI caps. The experience so far has been mixed.in a sample of 119 countries over the 2000-13 period find that, while macroprudential policies can help manage financial cycles, they work less well in busts than in booms. This result is intuitive in that macroprudential regulations are generally procyclical and can therefore be counterproductive during a bust when bank credit should expand to offset the economic downturn.

Macroprudential regulations are often directed at restraining bank credit, especially to the housing market. They do not, however, take into account the tradeoffs between mitigating the risks of a financial crisis on the one side and the cost of lower financial intermediation on the other. In addition, given that these measures are generally procyclical, they can accentuate the credit crunch during busts. More generally, an analytical foundation for analyzing these tradeoffs has been lacking. MAPMOD has been designed to help fill this analytical gap and to provide insights for the design of less procyclical macroprudential regulations.

The MAPMOD Mark II model in this paper includes an explicit housing market, in which house prices are strongly correlated with banks’ credit supply. This corresponds to the experience prior and during the Global Financial Crisis. This deadly embrace between bank mortgages, household balance sheets, and house prices can be the source of financial cycles. A corollary is that the housing market is only partially constrained by LTV limits as the additional availability of credit itself boosts house prices, and thus raises LTV limits.

The starting point of the MAPMOD framework is the factual observation that, in contrast to the loanable funds model, banks do not wait for additional deposits before increasing their lending. Instead, they determine their lending to the economy based on their expectations of future profits, conditional on the economic outlook and their regulatory capital. They then fund their lending portfolio out of their existing deposit base, or by resorting to wholesale funding and debt instruments. Banks actively seek new opportunities for profitable lending independently of the size or growth of their deposit base—unless constrained by specific regulations.

In MAPMOD, Mark II, we extend the original model by introducing an explicit housing market. We use the modular features of the model to analyze partial equilibrium simulations for banks, households, and the housing market, before turning to general equilibrium results. This incremental approach sheds light on the intuition behind the model and simulation results.

The housing market is characterized by liquidity-constrained households that require financing to buy houses. A house is an asset that provides a stream of housing services to households. The value of a house to each household is the net present value of the future stream of housing services that it provides plus any capital gain/loss associated with future changes in house prices. We define the fundamental house price households are willing to pay to buy a house the price that is consistent with the expected income/productivity increases in the economy. If prices go above the fundamental house price reflecting excessive leverage, we refer to this as an inflated house price. The supply of houses for sale in the market is assumed to be fixed each period. House prices are determined by matching buyers and sellers in a recursive equilibrium with expected house prices taken as given. We abstract from many real-world complications such as neighborhood externalities, geographical location, square footage or other forms of heterogeneity.

Bank financing plays a critical role in the determination of house prices in the model. If banks provide a larger amount of mortgages on an expectation of higher household income in the future, demand for housing will go up, thus inflating house prices. Conversely, if banks reduce their loan exposure to the housing market, demand for houses in the economy will be reduced, leading to a slump in house prices. House prices therefore move with the credit cycle in MAPMOD, Mark II, just as in the real world.

Nonperforming loans and foreclosures in the housing market occur when households are faced with an idiosyncratic, or economy-wide, shock that affects their current LTV or LTI characteristics. Banks will seek to reduce the likelihood of losses by requiring a sufficiently high LTV ratio to cover the cost of foreclosure. But they will not be able to diversify away the systemic risk of a general fall in house prices in the economy. Securitization of mortgages in MAPMOD is not allowed. And even if banks were able to securitize mortgages, other agents in the economy would need to carry the systemic risk of a sharp fall in house prices. At the economy-wide level, the systemic risk associated with the housing market is therefore not diversifiable. The evidence from the Global Financial Crisis on securitization and credit default swaps confirms that this is the case, regardless of who holds mortgage-backed securities.

This paper presented a new version of MAPMOD (Mark II) to study the effectiveness of macroprudential regulations. We extend the original MAPMOD by explicitly modeling the housing market. We show how lending to the housing market, house prices, and household demand for housing are intertwined in the model in a what we call a deadly embrace. Without macroprudential policies, this naturally leads to housing boom and bust cycles. Moreover, leverage-driven cycles have historically been very costly for the economy, as shown most recently by the Global Financial Crisis of 2008–09.

Macroprudential policies have a key role to play to limit this deadly embrace. The use of LTV limits for mortgages in this regard is ineffective, as these limits are highly procyclical, and hold back the recovery in a bust. LTV limits that are based on a moving average of historical house prices can considerably reduce their procyclicality. We considered a 5 year moving average, but the length of the moving average used should probably vary based on the specific circumstances of each housing market.

CCBs may not be an effective regulatory tool against credit cycles that affect the housing market in particular, as banks may respond to higher/lower regulatory capital buffers by reducing/increasing lending to other sectors of the economy.

A combination of LTV limits based on a moving average and CCBs may effectively loosen the deadly embrace. This is because such LTV limits would attenuate the housing market credit cycle, while CCBs would moderate the overall credit cycle. Other macroprudential policies, like DSTI and LTI caps, may also be useful in this respect, depending on the specifics of the financial landscape in each country. It is, however, important to recognize that all these macroprudential policies come at a cost of dampening both good and bad credit cycles. The cost of reduced financial intermediation should be taken into account when designing macroprudential policies.

Note: IMF Working Papers describe research in progress by the author(s) and are published to elicit comments and to encourage debate. The views expressed in IMF Working Papers are those of the author(s) and do not necessarily represent the views of the IMF, its Executive Board, or IMF management.


Less Model Reliance Should Reduce Bank Ratio Variation – Fitch

The Basel Committee on Banking Supervision has proposed that banks should stop using models to calculate capital for some hard-to-model portfolios and face significant constraints on model usage for others. If adopted, this should reduce variation in capital adequacy ratios across banks, says Fitch Ratings. But this increases the need for the Committee to develop a more risk-sensitive standardised approach (SA).

The proposals, published earlier this month for consultation until 24 June, eliminate the use of Internal Ratings Based (IRB) models for low-default exposures to banks, financial institutions, and large corporates with assets in excess of EUR50bn. This means that all banks would use the revised SA for calculating risk weightings on these asset types.

Low-default portfolios are difficult to model because data is limited and historic default experience is low. Such data is needed for reliable IRB modelling. Although not included in these proposals, sovereign exposures are also regarded as low default, and we think it is likely that the Committee might adopt a similar approach for this portfolio once its sovereign risk-weight review is concluded.

The Committee’s proposals would still allow IRB modelling for exposures to smaller corporates and for retail customers, subject to restrictions to narrow the range of outcomes.

For example, proposals to increase minimum probability of default (PD) assumptions for retail mortgages to 5bp from 3bp could increase risk weights on these portfolios by 50% if all else remains equal. For corporates with revenues above EUR200m but assets below EUR50bn, models are still allowed, but loss-given default assumptions (LGD) on unsecured senior lending will be fixed at 45%. Currently, banks can use internal model estimates to calculate capital charges for these exposures that may be less conservative. The introduction of a minimum floor to the models will mean outputs are more comparable across banks.

For the first time, the Committee revealed its thoughts on the calibration of an aggregate permanent risk-weighted, asset-capital floor based on the revised SA, to be in the range of 60% to 90%. This will limit the benefit to banks from lower risk weights generated by their IRB models, compared with the revised SA weightings.

If the Committee’s proposals are adopted, the revised SA will become far more important than the IRB approach for calculating capital requirements. Reducing banks’ reliance on internal models could boost public confidence in regulatory capital ratios, and enable creditors to make better informed decisions.

Banks have developed IRB models at significant cost and we expect them to lobby hard to maintain incentives to continue to use the modelled approaches. The Committee does not intend to raise overall capital requirements for banks, but we think these proposals could lead to an increase in capital requirements for low-risk weight portfolios. Some banks might question their continued investment in internal models, although we think many might still use them for their own risk management. We think this would be useful because models can create more robust risk-management frameworks.

An earlier Basel Committee study signalled notable differences in how banks estimate key model parameters including PD and LGD for the same exposures. The review concluded that a significant source of risk-weighted asset variation was due to different modelling choices between banks, such as the definition of default, and adjustment for cyclical effects. In contrast, the SA reduces variability because it prescribes set risk weights for different risk categories.