
Australia’s asset cycle has peaked, according to credit rating agency Moody’s Investor Services. And that means the risk weight capital our major banks hold will come under pressure.
The agency also says that the looming increase in risk weightings on the average mortgage risk weights as a result of the Australian banking regulator’s, APRA, edict that “risk weights for IRB banks will rise to at least 25%, from the current 15-18% level” will also put downward pressure on the majors CET1 (Common Equity Tier One) ratio’s.
The good news for the banks, their shareholders, and the Australian financial system is that Moody’s believes, based on its scenario and sensitivity analysis, that “the potential decline in the banks’ capital metrics as a result of changes to risk weights will be limited”.
Ilya Serov, Moody’s senior vice president, added in the report that:
Even in a highly stressed scenario, and before factoring in any potential for organic capital generation, the major banks’ CET1 ratios will remain above 8.0%, a level which is the combination of the regulatory minimum CET1 plus Capital Conservation and Domestic Systemically Important Bank (D-SIB) buffers.
That doesn’t guarantee the banks won’t have to raise more capital at some point. But it certainly suggests the work they have already done in raising capital in preparation for the changes in regulation will keep them above the 8% trigger level.
Under each of the scenarios Moody’s ran a comparison of the impact of the upper end of Australian banks 2009 experience when the corporate “impaired and past due exposure ratio” hit 2.5%. In the second scenario Moody’s took the average of the banks 2009 experience – as opposed to upper-end of experience as it’s base input. It then included the increase in mortgage weights into this scenario.
Moody’s says: “The key cyclical pressure on risk-weighted capital ratios will come from an upward revision in credit risk weights as asset quality weakens. This is a reversal of the situation which has existed since the GFC’s nadir in 2008/09 which with the ‘decline in the major banks’ CRWA, as asset quality improved after the global financial crisis, has been the primary organic driver of their improving risk-weighted capital ratios.”
While Moody’s stressed this was not a credit rating note in the end though the company still sounds pretty upbeat on the big banks capital positions.
“The moderate degree of deterioration in capital levels indicated by our sensitivity analysis is in line with our view that Australia’s major banks remain in a strong position to maintain their strong credit profiles against a likely weakening in their asset performance” Moody’s said.
Category: Economics and Banking

Bank Home Lending Credit Growth Continues
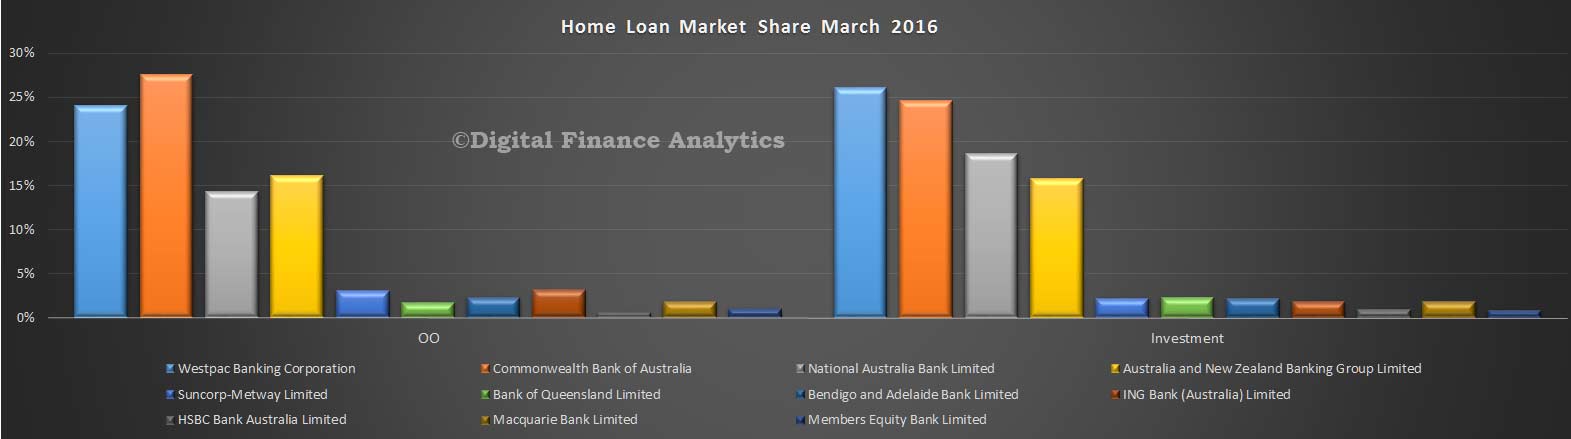
The latest data from APRA reporting home lending to end March shows total ADI balances grew by $9.5 bn to $1,441,253, a rise of 0.67% in the month, which is an annualised rate of 7.9%. Superficially, $8.2.billion was for owner occupation and $1.3 billion for investment home purchase but the RBA warned that $1.5 bn was due to loan reclassification between OO and INV loans so there is still noise in the system.
There was little net market share movement among the larger players. CBA still has the largest share of owner occupation loans, and Westpac of investment loans.
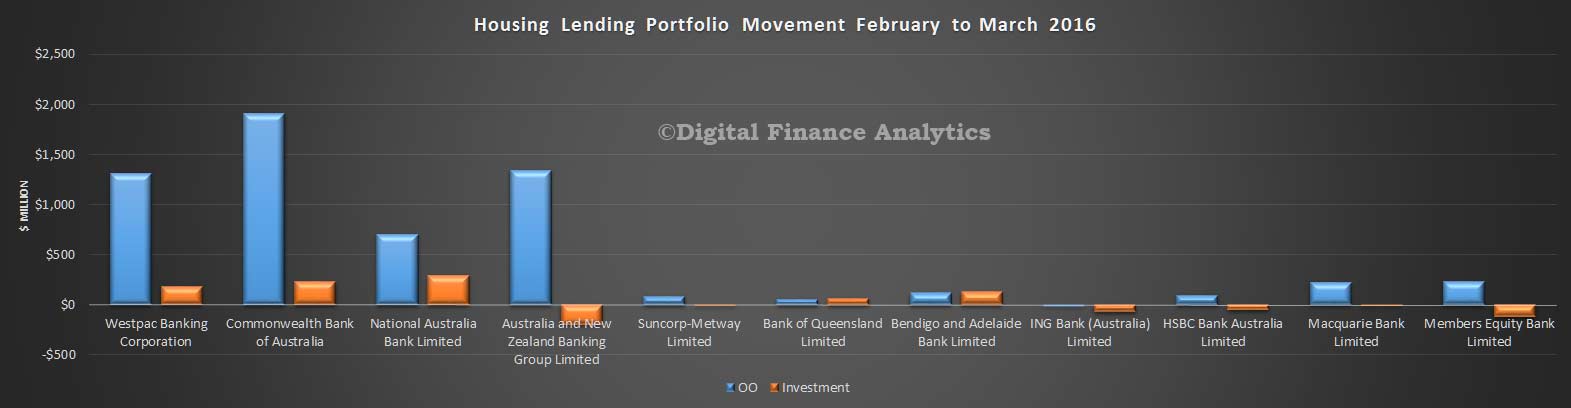
 The value of portfolio movements shows the focus on owner occupied lending, compared with investment loans. Perhaps.ANZ’s fall in investment loans could signal a reclassification?
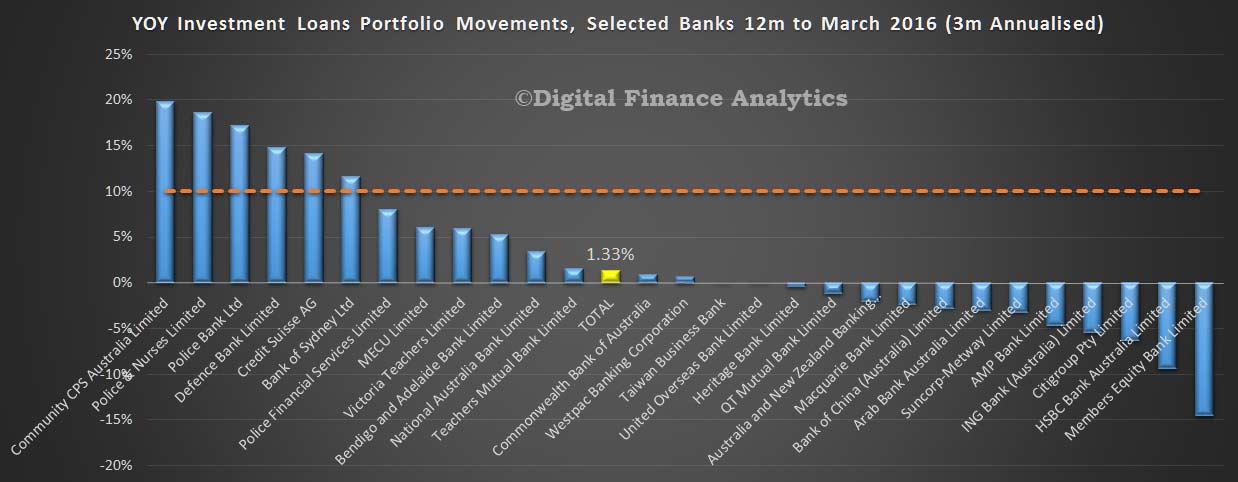
 Looking at the growth in investment loans in terms of the APRA 10% speed limit, calculating movements on a 3 month annualised basis, against a market movement of 1.33%, NAB has growth above system, whilst the other major players are below system. Some smaller players continue to write high volumes of investment loans.
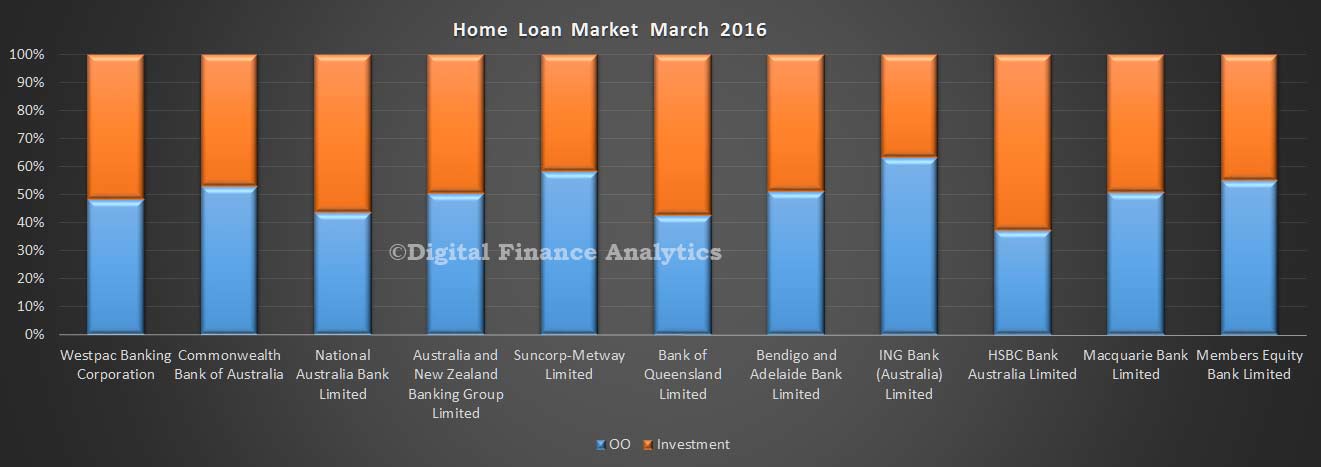
Finally we look at the relative share by loan type. This chart takes the relative percentages for owner occupied and investment loans by bank. It does not show the relative value, but the relative share (which we think is a more important lens).
 We will not post on the deposit or credit card portfolios as there is little to see this month.
OO Home Lending Drives Mortgages To A Record $1.55 Trillion
The RBA released their credit aggregates to end March today. Housing lending grew 0.5% in March and reflects an annual rate of 7.2% – well above inflation! Business credit grew by 0.3% or $2.6 billion (annualised 6.5%) and personal credit fell 0.3% or $0.6 billion, and represents an annualised fall of 1%. We are still not seeing real relative growth in the important business investment sector.
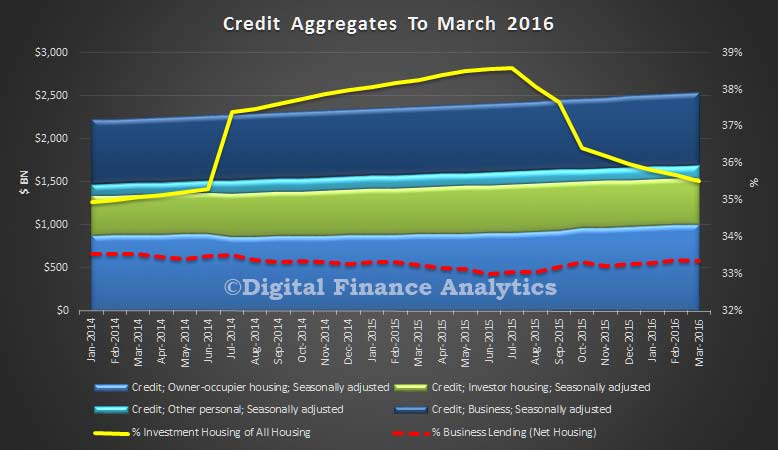 So, housing momentum is driving banks lending books. Seasonally adjusted lending for owner occupation grew 0.76%, or $7.5 billion, whilst lending for investment homes grew just 0.08%. Total growth was 0.5% or $7.7 billion to a new record of $1,547.6 billion. One third of loans are for investment purposes, though there is still some movement and reclassification. The RBA says:
Following the introduction of an interest rate differential between housing loans to investors and owner-occupiers in mid-2015, a number of borrowers have changed the purpose of their existing loan; the net value of switching of loan purpose from investor to owner-occupier is estimated to have been $39 billion over the period of July 2015 to March 2016 of which $1.5 billion occurred in March. These changes are reflected in the level of owner-occupier and investor credit outstanding. However, growth rates for these series have been adjusted to remove the effect of loan purpose changes.
Such strong growth in home lending will make the RBA pause for thought before they cut the cash rate again – household debt continues to sky rocket, at a time when incomes are static. Not a good formula for enduring financial stability. Cutting rates will have little impact on personal credit (which is still falling) or business borrowing (driven more by confidence and future prospective growth). This should temper the knee-jerk calls for a cut following the lower than expected inflation number earlier in the week.
We will post separately on the APRA numbers, also released today.
Westpac halts property loans to foreigners
Westpac has announced it will no longer loan money to foreigners wishing to purchase residential property in Australia.
The bank and its subsidiaries (St George, Bank SA and Bank of Melbourne) ceased property lending to all non-residents and temporary visa holders as of April 26. Westpac is the third major bank to clamp down in this way, following announcements from ANZ and Commonwealth Bank earlier in April.
Australian and New Zealand citizens whose main source of income is from overseas will also be affected. They are restricted to loans for new housing only, with the maximum amount that Westpac will lend them falling from 80% to 70% of the total purchase price.
An email sent by Westpac to mortgage brokers said, “At Westpac, helping Australians to achieve their goal of owning a home or investment property is core to our purpose.
“For these reasons, Westpac will no longer lend to offshore customers who are not citizens or residents of Australia with an eligible visa.”
The news may spark fears of a slowdown in residential construction, with developers potentially taking a hit. In particular, Meriton has been targeting the Chinese market and may have to rethink strategy.
MFAA CEO Siobhan Hayden said of Westpac’s decision, “Westpac’s policy change… reflects a prudent decision for a more balanced portfolio at this time and reduced exposure for the bank.”
Where To For Perth Home Prices?
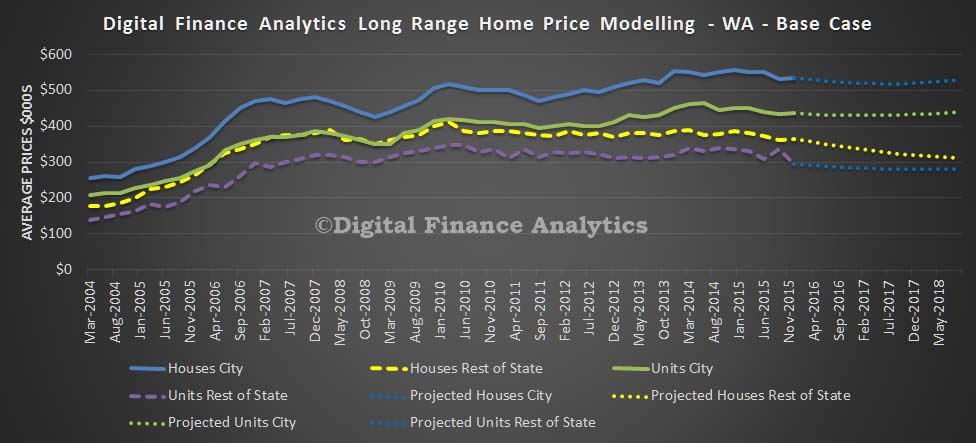
We continue our series of home price modelling by state. Today we look at WA. You can read about our modelling and scenarios.
In our base case to mid 2018, we expect to see the average house price in Perth fall by 1.4% to $528,000 and the average unit price in Perth rise by 0.7% to $438,000. In the regional areas, the average house price will fall by 14.6% to $312,000 and units will fall 5.3% to $279,000.
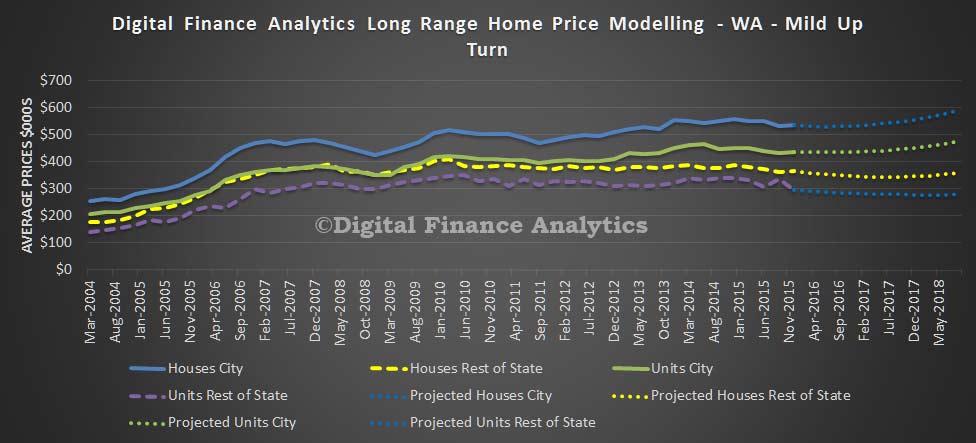
 If economic activity picks up to mid 2018, we expect to see the average house price in Perth rise by 10.1% to $589,000 and the average unit price in Perth rise by 9.5% to $477,000. In the regional areas, the average house price will fall by 2.3% to $357,000 and units will fall 5.6% to $279,500.
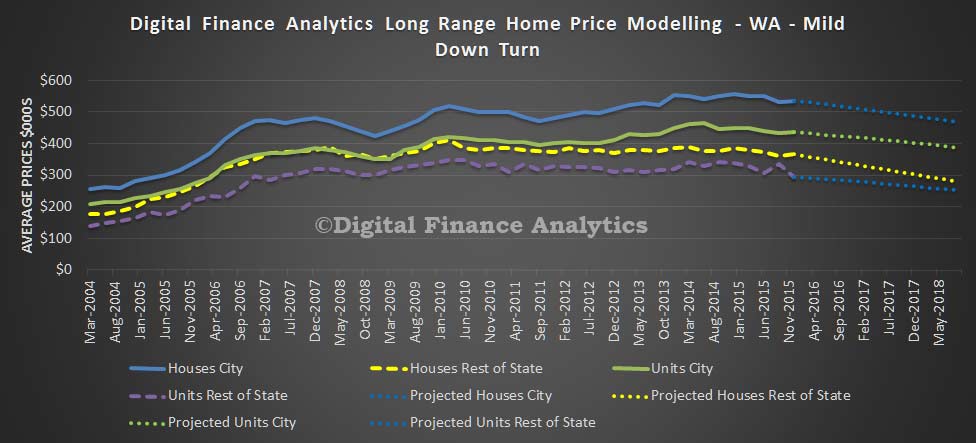
 If economic activity slows to mid 2018, we expect to see the average house price in Perth fall by 12.6% to $467,000 and the average unit price in Perth fall by 11.2% to $386,000. In the regional areas, the average house price will fall by 23.6% to $279,000 and units will fall 14.8% to $251,000.
 If economic activity falls significantly to mid 2018, we expect to see the average house price in Perth fall by 27.9% to $386,000 and the average unit price in Perth fall by 20.1% to $347,000. In the regional areas, the average house price will fall by 35.0% to $237,000 and units will fall 29.4% to $208,000.
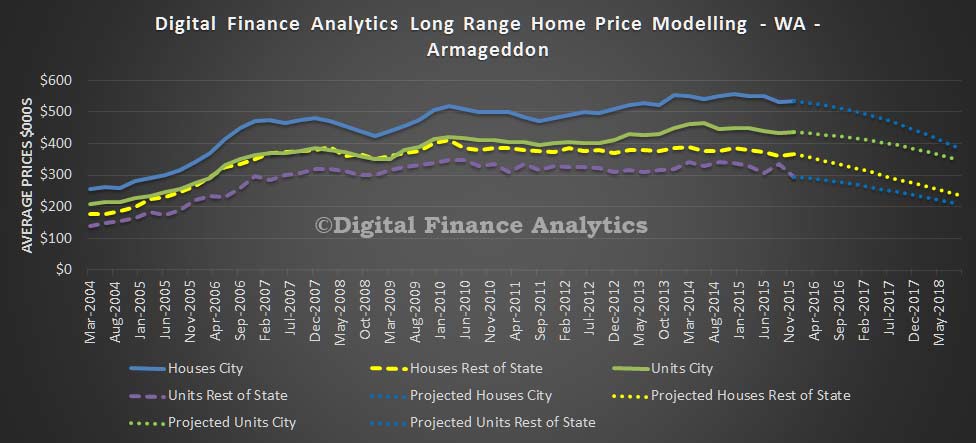 This shows the WA market is quite fragile, despite considerable construction momentum, and interest from first time buyers. The modelling is designed to show relative sensitivity rather than making absolute predictions.
Where To With Brisbane Home Prices?
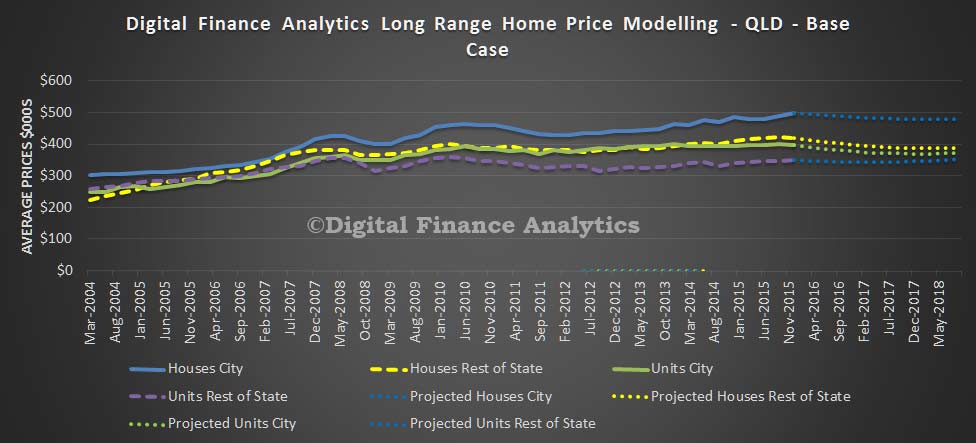
Continuing our modelling of future home prices, as described in our earlier post, today we look at QLD and run the analysis against our various scenarios.
In our base case to mid 2018, we expect to see the average house price in Brisbane fall by 3.9% to $481,000 and the average unit price in Brisbane fall by 6.2% to $372,000. In the regional areas, the average house price will fall by 7.6% to $388,000 and units will rise 0.7% to $353,000.
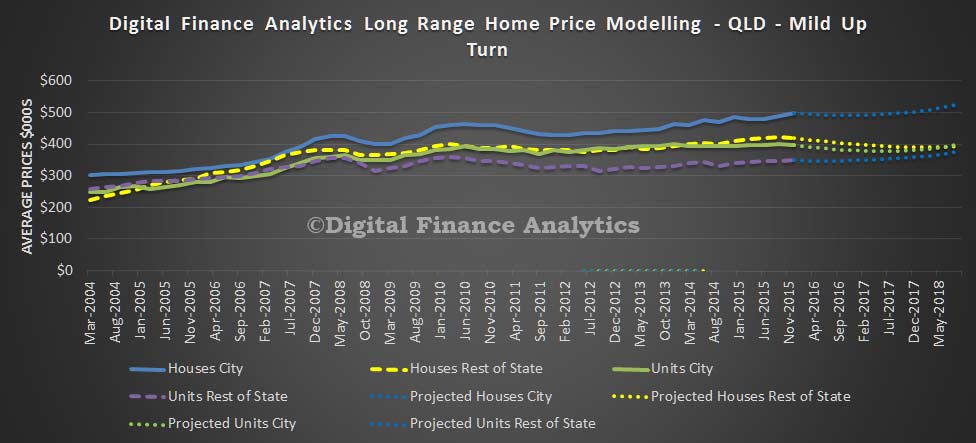
 If economic activity picks up to mid 2018, we expect to see the average house price in Brisbane rise by 5.3% to $526,000 and the average unit price in Brisbane rise by 0.6% to $399,000. In the regional areas, the average house price will fall by 5.9% to $395,000 and units will rise 7.9% to $378,000.
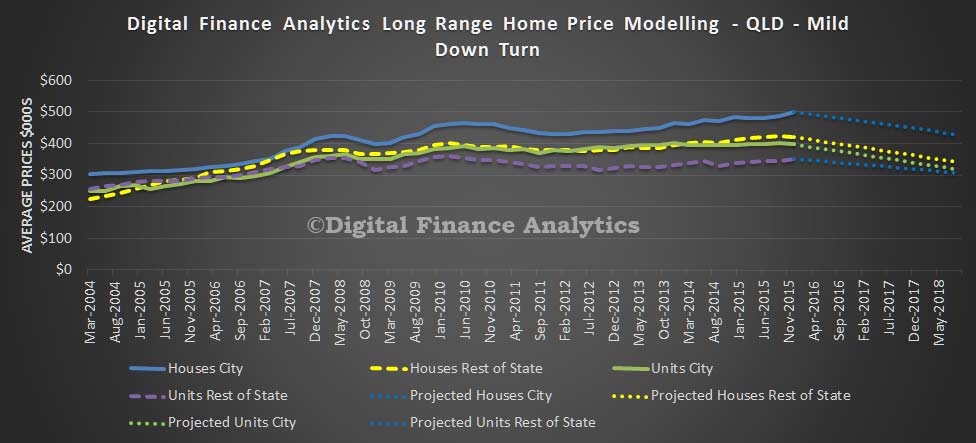
 If economic activity slows to mid 2018, we expect to see the average house price in Brisbane fall by 14.6% to $427,000 and the average unit price in Brisbane fall by 20.1% to $317,000. In the regional areas, the average house price will fall by 18.9% to $340,000 and units will fall 12.4% to $307,000.
 Finally, if economic activity falls significantly to mid 2018, we expect to see the average house price in Brisbane fall by 21.7% to $391,000 and the average unit price in Brisbane fall by 29.5% to $280,000. In the regional areas, the average house price will fall by 29.2% to $297,000 and units will fall 24.6% to $264,000.
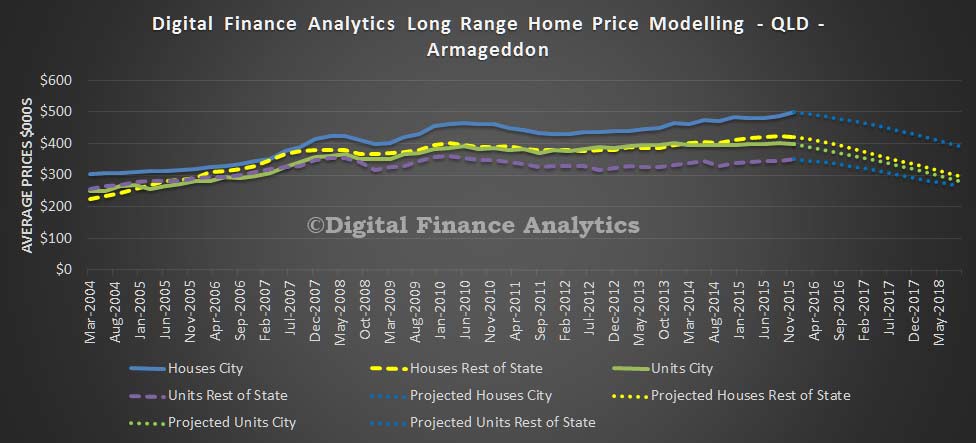 Essentially, regional areas in QLD are more exposed to economic down turns than Brisbane. Also, investment property purchases are a large proportion of transactions, and these are very sensitive to economic variables. Whilst this modelling will be wrong, it does give an indication of relative sensitives.
Tomorrow we will look at Western Australia.
Mortgage Delinquencies Higher – S&P
The mortgage arrears rate for Australian home owners is the highest it’s been in more than a year the latest Standard & Poor’s (S&P) Rating Services Mortgage Performance Index (SPIN) shows. That’s the fourth consecutive month in which arrears have risen and S&P said that the increase was across all loan types.
The SPIN is a measure of arrears in Australian residential mortgage-backed securities (RMBS)- effectively bonds issued by banks, and other lenders, in the Australian market – which are supported by the underlying cash flows of a pool of home loans. It’s not the whole market, but because of APRA rules around the performance of these securities they can be taken as representative of the entire Australian national home loan book.
So the good news is that only around 1.11% of prime RMBS were in arrears as of February 29, SPIN showed. That was up from 1.07% in January and well off the low of 0.91% in September last year.
S&P said that a large part of the result is seasonal.
“Some of the increase reflects a decline in outstanding loan balances, there is also a seasonal component at play,” S&P said noting that “arrears typically increase in January and February, reflecting the effects of Christmas spending, holidays, and January sale periods”.
S&P also said “Low doc” loans and non-conforming loans also rose to 4.55% and 4.91% respectively while by lender type the data showed that the rise was across all lenders.
“Regional banks recorded the highest arrears of all originator types, reaching 2.15% in February, up from 2.04% a month earlier. The nonbank financial institutions meanwhile recorded the lowest arrears of all originator types, at 0.76%, up from 0.75% in January”.
The uptick in regional bank loans no doubt reflects the mortgage stress highlighted by the Reserve Bank in its Financial Stability Review earlier this month.
The RBA said that while “overall stress in banks’ household loan portfolios remain low… an exception to this general theme is that regions heavily reliant on the mining sector have experienced large falls in housing prices and deteriorations in credit performance”.
Overall Australia still has very low arrears and Australian consumers have large mortgage offset buffers, as well as many borrowers being well ahead of scheduled payments. But the trend is your friend as they say. Or in this case maybe not.

BIS Updates Standards For Interest Rate Risk In The Banking Book
The Basel Committee on Banking Supervision has today issued standards for Interest Rate Risk in the Banking Book (IRRBB). The key enhancements to the 2004 Principles include:
- More extensive guidance on the expectations for a bank’s IRRBB management process in areas such as the development of interest rate shock scenarios, as well as key behavioural and modelling assumptions to be considered by banks in their measurement of IRRBB;
- Enhanced disclosure requirements to promote greater consistency, transparency and comparability in the measurement and management of IRRBB. This includes quantitative disclosure requirements based on common interest rate shock scenarios;
- An updated standardised framework, which supervisors could mandate their banks to follow or banks could choose to adopt; and
- A stricter threshold for identifying outlier banks, which is has been reduced from 20% of a bank’s total capital to 15% of a bank’s Tier 1 capital.
The document runs to 50 pages but here is a summary of the main points:
-
Interest rate risk in the banking book (IRRBB) is part of the Basel capital framework’s Pillar 2 (Supervisory Review Process) and subject to the Committee’s guidance set out in the 2004 Principles for the management and supervision of interest rate risk (henceforth, the IRR Principles). The IRR Principles lay out the Committee’s expectations for banks’ identification, measurement, monitoring and control of IRRBB as well as its supervision.
-
IRRBB refers to the current or prospective risk to the bank’s capital and earnings arising from adverse movements in interest rates that affect the bank’s banking book positions. When interest rates change, the present value and timing of future cash flows change. This in turn changes the underlying value of a bank’s assets, liabilities and off-balance sheet items and hence its economic value. Changes in interest rates also affect a bank’s earnings by altering interest rate-sensitive income and expenses, affecting its net interest income (NII). Excessive IRRBB can pose a significant threat to a bank’s current capital base and/or future earnings if not managed appropriately.
-
Three main sub-types of IRRBB are defined for the purposes of these Principles:
- Gap risk arises from the term structure of banking book instruments, and describes the risk arising from the timing of instruments’ rate changes. The extent of gap risk depends on whether changes to the term structure of interest rates occur consistently across the yield curve (parallel risk) or differentially by period (non-parallel risk).
- Basis risk describes the impact of relative changes in interest rates for financial instruments that have similar tenors but are priced using different interest rate indices.
- Option risk arises from option derivative positions or from optional elements embedded in a bank’s assets, liabilities and/or off-balance sheet items, where the bank or its customer can alter the level and timing of their cash flows. Option risk can be further characterised into automatic option risk and behavioural option risk.
All three sub-types of IRRBB potentially change the price/value or earnings/costs of interest rate-sensitive assets, liabilities and/or off-balance sheet items in a way, or at a time, that can adversely affect a bank’s financial condition
-
The Committee has decided that the IRR Principles need to be updated to reflect changes in market and supervisory practices since they were first published, and this document contains an updated version that revises both the Principles and the methods expected to be used by banks for measuring, managing, monitoring and controlling such risks.
-
These updated Principles were the subject of consultation in 2015, when the Committee presented two options for the regulatory treatments of IRRBB: a standardised Pillar 1 (Minimum Capital Requirements) approach and an enhanced Pillar 2 approach (which also included elements of Pillar 3 – Market Discipline). The Committee noted the industry’s feedback on the feasibility of a Pillar 1 approach to IRRBB, in particular the complexities involved in formulating a standardised measure of IRRBB which would be both sufficiently accurate and risk-sensitive to allow it to act as a means of setting regulatory capital requirements. The Committee concludes that the heterogeneous nature of IRRBB would be more appropriately captured in Pillar 2.
-
Nonetheless, the Committee considers IRRBB to be material, particularly at a time when interest rates may normalise from historically low levels. The key updates to the Principles under an enhanced Pillar 2 approach are as follows:
- Greater guidance has been provided on the expectations for a bank’s IRRBB management process, in particular the development of shock and stress scenarios (Principle 4) to be applied to the measurement of IRRBB, the key behavioural and modelling assumptions which banks should consider in their measurement of IRRBB (Principle 5) and the internal validation process which banks should apply for their internal measurement systems (IMS) and models used for IRRBB (Principle 6).
- The disclosure requirements under Principle 8 have been updated to promote greater consistency, transparency and comparability in the measurement and management of IRRBB. Banks must disclose, among other requirements, the impact of interest rate shocks on their change in economic value of equity (∆EVE) and net interest income (∆NII), computed based on a set of prescribed interest rate shock scenarios.
- The supervisory review process under Principle 11 has been updated to elaborate on the factors which supervisors should consider when assessing the banks’ level and management of IRRBB exposures. Supervisors could also mandate the banks under their respective jurisdictions to follow the standardised framework for IRRBB (eg if they find that the bank’s IMS does not adequately capture IRRBB). The standardised framework has been updated to enhance risk capture.
- Supervisors must publish their criteria for identifying outlier banks under Principle 12. The threshold for the identification of an “outlier bank” has also been tightened, where the outlier/materiality test(s) applied by supervisors should at least include one which compares the bank’s ∆EVE with 15% of its Tier 1 capital, under a set of prescribed interest rate shock scenarios. Supervisors may implement additional outlier/materiality tests with their own specific measures. There is a strong presumption for supervisory and/or regulatory capital consequences, when a review of a bank’s IRRBB exposure reveals inadequate management or excessive risk relative to a bank’s capital, earnings or general risk profile.
-
Consistent with the scope of application of the Basel II framework, the proposed framework would be applied to large internationally active banks on a consolidated basis. Supervisors have national discretion to apply the IRRBB framework to other non-internationally active institutions.
-
The document is structured as follows. Section I provides an introduction to IRRBB. Section II presents the revised Principles, which replace the 2004 IRR Principles for defining supervisory expectations on the management of IRRBB. Principles 1 to 7 are of general application for the management of IRRBB, covering expectations for a bank’s IRRBB management process, in particular the need for effective IRRBB identification, measurement, monitoring and control activities. Principles 8 and 9 set out the expectations for market disclosures and banks’ internal assessment of capital adequacy for IRRBB respectively. Principles 10 to 12 address the supervisory approach to banks’ IRRBB management framework and capital adequacy. Section III states the scope of application and Section IV sets out the standardised framework which supervisors could mandate their banks to follow, or a bank could choose to adopt. The Annexes provide a set of terminology and definitions that will provide a better understanding of IRRBB to both banks and supervisors and further details on the standardised interest rate shocks.
-
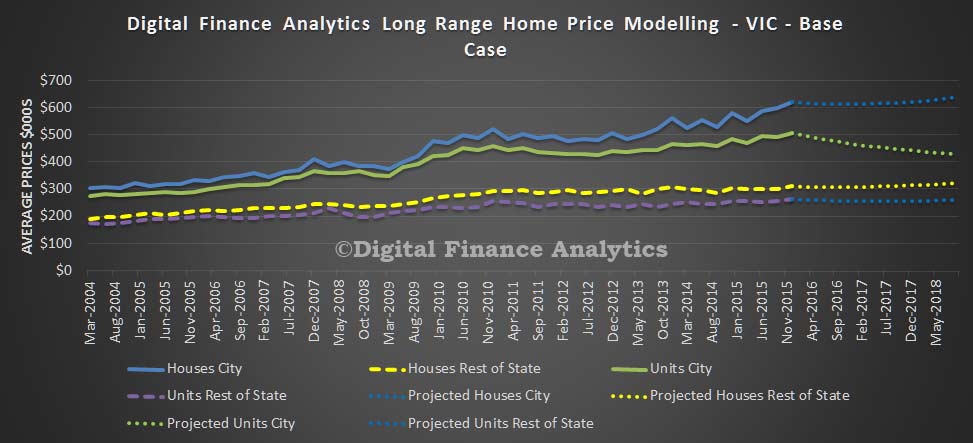
Where to With Melbourne Home Prices?
Continuing our econometric modelling of home prices trends, today we examine Melbourne. As we discussed our model takes account of a range of factors and runs a series of future scenarios out to mid 2018. We look at prices both within Melbourne and also across the state and split the analysis into houses and units.
In our base case to mid 2018, we expect to see the average house price in Melbourne rise by 2.8% to $639,000 and the average unit in Melbourne fall by 15.1% to $429,000. In regional areas, the average house price will rise 3.5% to $321,000 and units will fall by 0.4% to $260,000. The oversupply of units in the CBD explain the projected price falls.
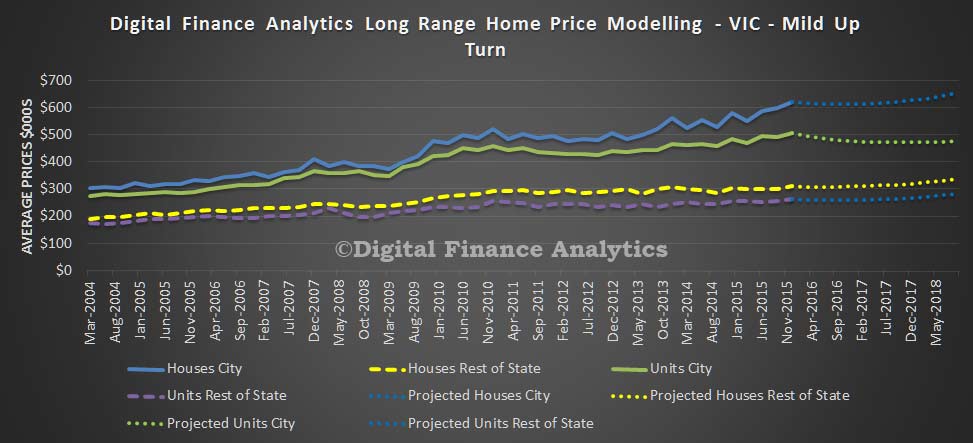
 If economic momentum becomes stronger, to mid 2018, the average house price in Melbourne will rise by 5.1% to $653,000 and the average unit in Melbourne will fall by 5.7% to $476,000. In regional areas, the average house price will rise 3.4% to $337,000 and units will rise by 7.9% to $282,000. The rise in Melbourne will continue despite lower demand for investment property and static incomes. Over supply of units in the CBD will depress unit prices.
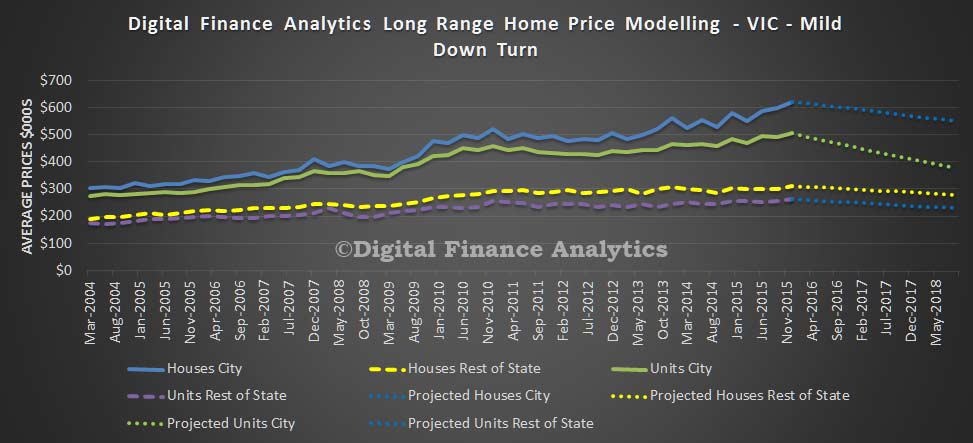
 If economic momentum falls, to mid 2018, we expect to see the average house price in Melbourne fall by 11.6% to $549,000 and the average unit in Melbourne fall by 25.2% to $378,000. In regional areas, the average house price will fall 10.6% to $277,000 and units will fall by 12.6% to $228,000. In this scenario, growth remains low, unemployment moves higher, incomes remain flat, and demand for property slows.
 If economic momentum falls significantly, to mid 2018, we expect to see the average house price in Melbourne fall by 29.2% to $439,000 and the average unit in Melbourne fall by 38.4% to $311,000. In regional areas, the average house price will fall 28% to $223,000 and units will fall by 18.8% to $221,000. In this scenario, cash interest rates are cut further, unemployment rises, income falls in real terms, and demand for property falters. This is our Armageddon scenario.
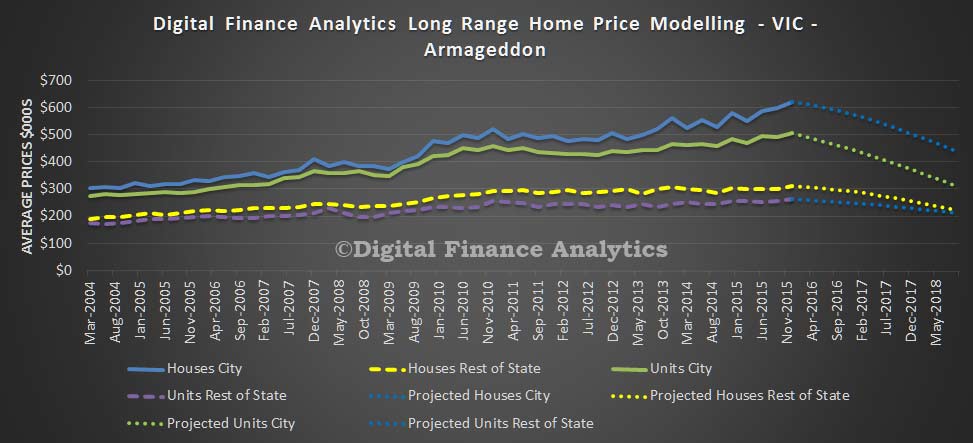 We see that the main area of risk centres on units in Melbourne, especially those within the CBD and surrounds. Supply is rising fast, at a time when demand is not matched.
And a caveat, this modelling will be wrong, but it does give an indication of relative sensitives. Next time we will look at Brisbane and QLD.
Unintended Consequences of Macroprudential
An IMF working paper, just released examines the impact of macroprudential policy. They conclude that implementing macroprudential does reduce the expansion of bank credit, but this is offset by a growth in non-bank credit and foreign bank lending, so the overall braking effect is less severe than expected. This substitution effect needs to be incorporated into the policy settings to deliver the desired credit growth management. Here is a summary.
Macroprudential policy is alive and kicking. It is being used actively both in emerging market economies and—following the global financial crisis—in advanced economies. It includes measures that apply directly to lenders, such as countercyclical capital buffers or capital surcharges, and restrictions that apply to borrowers, such as loan-to-value (LTV) and loan-to-income (LTI) ratio caps. Most macroprudential measures activated around the globe between 2000 and 2013 apply to the banking sector only, including borrower-based measures.
The widespread use of macroprudential policy is aimed at reducing systemic risks. Yet the use of national sector-based measures may be subject to a boundary problem, causing substitution flows to less regulated parts of the financial sector. Specifically, macroprudential policy may have the consequence of shifting activities and risks both to: (i) foreign entities (e.g., bank branches and cross-border lending); and (ii) nonbank entities (e.g., shadow banking, also referred to as market-based financing). Whereas several papers have estimated intended effects of macroprudential policies (MaPs) on variables such as credit growth and housing prices, and whether measures leak to foreign banks, cross-sector substitution effects have—to the best of our knowledge—not yet been tested empirically.
This paper aims to fill this gap. It investigates whether macroprudential policies lead to substitution from bank-based financial intermediation to nonbank intermediation. In addition, it uses event study methodology to shed light on the timing of the effects of policy measures on bank and nonbank intermediation around activation dates. Moreover, we contribute to the literature by distinguishing between the effects of quantity versus price-based instruments and lender versus borrower-based instruments, given that the effects may differ. We also check whether results differ for advanced economies (AEs) versus emerging market economies (EMEs) and bank versus market-based financial systems.
Our results support the hypothesis that macroprudential policies reduce bank credit growth. In our sample, in the two years after the activation of MaPs, bank credit growth falls on average by 7.7 percentage points relative to the counterfactual of no measure. This effect is much stronger in EMEs than in AEs. Beyond this, our results suggests that quantity-based measures have much stronger effects on credit growth than price-based measures, both in advanced and emerging market economies. In cumulative terms, quantity measures slow bank credit growth by 8.7 percentage points over two years relative to the counterfactual of no policy change.
Our main contribution to the literature relates to substitution effects: we find that the effect of MaPs on bank credit is always substantially higher than the effect on total credit to the private sector. Whereas bank credit growth falls on average by 7.7 percentage points relative to the counterfactual of no measure, total credit growth falls by 4.9 percentage points on average. The reason for this is the increase in nonbank credit growth. We also find significant differences between country groups and instruments. First, substitution effects are stronger in AEs. This is in line with expectations given their more developed financial systems, with a larger role for market-based finance. Second, substitution effects are much stronger in the case of quantity restrictions, which are more constraining than price-based measures. Finally, we find strong and statistically significant effects on specific forms on nonbanking financial intermediation, such as investment fund assets.
Our paper builds on a rapidly expanding literature. While the concept of macroprudential policy can be traced back at least to the late 1970’s, it has become a common part of the policy lexicon in the first decade of this millennium. The global financial crisis has led not only to much more interest in the macroprudential approach, but also to active use of macroprudential instruments around the world.
The active use of instruments has spawned a growing empirical literature on the effectiveness of macroprudential policies, in individual country, regional and global settings. The most comprehensive study, who uses an IMF survey to document macroprudential policies in 119 countries over the 2000–13 period. They find that the implementation of such instruments is generally associated with the intended lower impact on credit, but that the effects are weaker in financially more developed and open economies.
In addition, to its intended effects, macroprudential policy may leak. Macroprudential policy may also increase crosssector substitution. A recent study by the IMF finds that more stringent capital requirements are associated with stronger growth of shadow banking. Our paper uses both net flow measures and an event study methodology to shed light on the size and timing of cross-sector substitution effects. Our empirical framework builds on work that has sought to explain credit growth, for instance to understand credit rationing and the monetary transmission mechanism. We control for macroeconomic fundamentals to filter out effects of policy on credit growth in a crosscountry panel setting.
Our results do not allow us to assess whether substitution effects reduce or increase systemic risks. A lowering of systemic risks may be expected, as risks may shift to institutions that are less leveraged and less subject to maturity mismatch. But this need not be the case, as market failures and systemic risks may also arise outside the regulated banking sector.
Overall, our findings underline the relevance of such a broad approach to monitoring and addressing systemic risks, especially for advanced economies. Earlier findings on cross-border leakages indicate that macroprudential policy should not take a narrow national perspective, as this would fail to internalize cross-border substitution effects. Our results on cross sector substitution complement these findings, and suggest that macroprudential policy should not take a narrow sectoral perspective.
Note: IMF Working Papers describe research in progress by the author(s) and are published to elicit comments and to encourage debate. The views expressed in IMF Working Papers are those of the author(s) and do not necessarily represent the views of the IMF, its Executive Board, or IMF management.