Australia’s Most Hated Fees Revealed

ATM fees frustrate Australians more than other banking and credit card fees and travel booking fees according to new research from ING DIRECT. Almost all Australians will take some action to avoid paying ATM fees – half will walk 10 minutes out of their way to get to a free ATM and 42 per cent will buy something they don’t need to get cash out.Almost half of the people who hate travel fees feel they are being ripped off. Top 5 accepted fees include Wi-Fi, restaurant service charges and mobile data roaming

Almost three quarters of people (72 per cent) who hate ATM fees say that it is because they believe it’s a service that should be free.

Psychologist Amanda Gordon explained, every day millions of people are feeling the frustration of paying fees and charges they think are unfair.

“Fee frustration may not seem significant, but these feelings of resentment can impact our ability to maintain a positive outlook in other aspects of our lives. Financial issues are regularly raised as a cause of stress for Australians, particularly among young women. Interestingly, ING DIRECT’s research shows that millennials and women were more likely to feel frustrated or angry about paying fees.”

“Bad spending habits are hard to break. Just like other habits, we need to become aware of what we are doing, stop following that same well-worn pathway without thinking, and actually notice where our money is going, rather than just complaining that it is disappearing. The best way for Australians to get ahead is to consciously and regularly focus on their finances by practicing money mindfulness,” said Gordon.

Apathy costing Australians dearly when it comes to paying unnecessary fees

John Arnott from ING DIRECT said people should not have to pay fees to access their own money.

“When you think about the total cost Australians pay in fees and charges it can have quite an impact on the family budget, which is already strained for many people.”

“Australians waste $500 million on ATM charges each year so it’s no surprise that’s the fee that tops the list. Our research shows almost all Australians will take some action to avoid ATM fees, but still too many people are paying. If you make two or three withdrawals a week, you are talking more than $300 a year, which is $300 too much,” he said.

Top ten fees Aussies find hardest to bear

  1. ATM fees
  2. Bank monthly account fees
  3. Booking fees for events and tickets
  4. Credit card surcharge fees
  5. Credit card annual fee
  6. Travel fees (e.g. airline booking fees)
  7. Fee for receiving a paper statement by mail
  8. Charge to use public toilets
  9. Road toll charges
  10. Late payment fees

Top five fees Aussies accept

  1. Wi-Fi fees
  2. Restaurant service charges
  3. Mobile data roaming charges
  4. Parking meter fees
  5. Currency conversion fees

Mortgage delinquencies to rise in 2016

From Australian Broker.

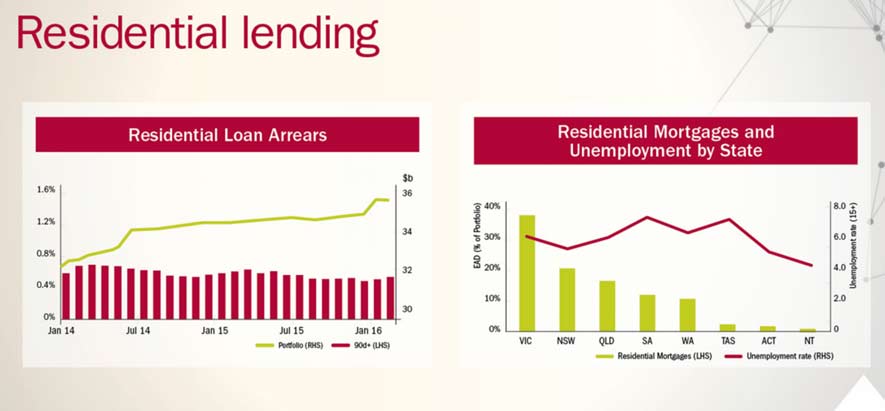
A slowdown in house price growth coupled with sluggish economic conditions will result in an increase in mortgage delinquencies in Australia during 2016, according to one global credit rating firm.

According to Moody’s Investor Services, the proportion of Australian residential mortgages more than 30 days in arrears was 1.20% in November 2015, compared with 1.19% in November 2014, and that is expected to rise again in the coming year.

“We expect the Australia-wide delinquency rate for mortgages showing more than 30 days in arrears to increase in 2016, but remain at a low level,” Moody’s assistant vice president and analyst Alana Chen said.

“We also expect that Australia’s GDP growth will likely be towards the upper end of our 1.5% to 2.5% forecast range for 2016, but this will be below the long-term average of 3.5%. We believe this economic backdrop will prompt a slight increase in the Australia-wide mortgage delinquency rate in 2016,” Chen said.

While Moody’s Investor Services is predicting a nation-wide increase in mortgage delinquencies in 2016, it won’t be spread evenly across Australia.

The ratings firm believes there will be further bad news for resource states; Western Australia, the Northern Territory, and to a lesser extent, Queensland, with the bulk of the increase in delinquencies to be found in those markets.

In Western Australia, the rate of mortgage holders more than 30 days in arrears rose by a significant 0.48% over the year to November 2015 to 1.71%, the highest mark in the country.

Though delinquencies will are predicted to rise in those states, performance in New South Wales will help to keep the nation-wide rate of delinquencies relatively low.

“With delinquencies in NSW remaining steady and those in other states set to continue to edge higher, we expect that the Australia-wide delinquency rate will increase slightly over 2016 but remain low,” Chen said.

Moody’s Investor Services claims a slowdown in house price growth in NSW will be balanced out by the “positive effect of healthy economic and labour market conditions.”

Are Deposit Interest Rates On The Up?

It looks like Banks will need to compete harder for deposit balances in the light of new regulation, and adverse international funding costs. This is in stark contrast to the past couple of years when savers took a bath.

The data from the RBA (to end February) shows that key benchmark rates for some deposits lifted. This trend has continued, with some attractor rates at 3.5%, and some standard deposit rates on the rise.

RBA-Deposits-Feb-2016In contrast, we also see lending rates to SME’s moving up, and some mortgage rates to borrowers are also higher – though selected refinance discounting is also available to some.

RBA-Loan-Benchmarks-Feb-2016In recent times the costs of international funding, which is the other main source of bank funds, has lifted (and is also more volatile) thanks to the higher perceived international risks and possible future interest rates. For example the CDS spreads are higher now.

CDS-Margin-April-2016This matters, because Australian banks have a higher proportion of their loan books funded by these wholesale sources, as data from Moody’s shows.  Whilst there has been a fall in the mix, compared with 2008, Australian banks are still reliant on these international capital flows. Thus any international volatility feeds though into local bank balance sheets.

Moodys-Apr-2016---Bank-1The other point to note is that Australian banks have a higher proportion of short-term funding, compared with global peers. Moody’s has provided data on this recently.

Moodys-April-2106---Bank-2 APRA’s consultation, announced last week, on Net Stable Funding Ratio will make it relatively more attractive for banks in Australia to fund their books from deposits rather than from wholesale capital markets. As a result, we expect to see competition for deposits, and potentially higher interest rates on offer. This trend will gain more momentum as the implementation date for NSFR approaches in 2018.

The implication of this may be we see a further fall in exposures to overseas funding, and thus less pricing volatility; but it may also mean that interest rates to some borrowers – especially SME’s who are less able to respond, and some mortgage holder segments will rise.

The question will be whether the re-balancing of all these forces will be managed so as to maintain net bank profitability, or whether the squeeze will flow to their bottom line. Nevertheless, Savers may for a change, get some good news – provided that is they shop around. We note from our surveys that more than half of households with savings on deposit do not know their current rate of return, and inertia is a powerful force stopping many maximising their savings returns.

Then of course, there is the question of whether the RBA cuts the cash rate benchmark as we progress through the year.


UK Regulator Looks At Reverse Mortgages

The UK Prudential Regulation Authority (PRA) has released a discussion paper (DP) on equity release mortgage (ERM), or reverse mortgages. Given the complex nature of these products, their valuation, risk assessment and capital treatment are under review, and the regulator is seeking industry input. They are especially focussing on what “fair value” for these mortgages might be.

The PRA has observed that firms writing ERMs typically restrict the initial valuation to the amount lent (which is a transaction price observed in a market), for example by including a spread of appropriate size when discounting ERM cashflows, and updating the valuation (including the spread, where appropriate) to allow for new information affecting the valuation as it emerges.

In Australia, reverse mortgages have not really taken flight, with the latest APRA data showing about $2.7 bn of reverse mortgages outstanding (compared with $1.35 trillion all home loans), comprising around 29,000 loans outstanding, and an average balance of just $96,000.  There has been little growth in recent years.

That said, the recent run up in house prices here, and the aging population may suggest a growing demand. Therefore it is worth looking at the issues the UK regulators are wrestling with. This is a complex product area requiring careful regulation.

ERMs are a type of lifetime mortgage. This DP is directly relevant to lifetime mortgage products with the following features: they are restricted to older customers, they do not have a fixed term, they generally have a no negative equity guarantee, and there is no obligation to make regular interest payments on the capital. For simplicity, this sub-set of equity release products is referred to as ‘ERMs’ for the purpose of this paper, but the PRA is aware that other definitions of ERMs are used in the industry.

ERMs allow capital to be released from residential properties without requiring the property to be sold. ERMs are loans secured by way of a mortgage on a residential property, repayable on ‘exit’ (death; or move to a care home; or voluntary repayment, either for an individual borrower or a couple) rather than at a fixed maturity date. In the United Kingdom (UK), loans are advanced as a lump sum, or through flexible drawdown facilities. In general it is possible to ‘port’ ERMs from one property to another if the borrowers wish to move house, subject to certain restrictions, which may include a requirement to make a partial repayment of the outstanding loan.

Loan interest is generally at a fixed rate, but can be variable or vary subject to a cap. In general, interest accrues to the loan balance without regular payments being made, so that the final repayment is larger than the amount lent, often significantly so. Sometimes interest payments can be made and these may be lower than the interest that would otherwise accrue. Such interest payments can be terminated by the borrower, in which case interest starts to accrue again. The accruing nature of the interest leads to the name ‘reverse mortgage’ being used in some territories.

In the UK, there is often a guarantee that on certain forms of repayment any excess of the accrued loan amount above the (sale) value of the property will be written off or waived by the lender, subject to certain conditions. This is known as a ‘no negative equity guarantee’ (NNEG). For an ERM product to meet the Product Standards within the Statement of Principles of the Equity Release Council, it must incorporate a NNEG. This means the NNEG has become a standard feature of the UK ERM market.

ERMs receivables are held – either directly or indirectly – by a range of different financial institutions, including life insurers, banks, building societies and other lenders. ERMs require long-term funding that is sufficiently flexible to adapt to the timing and amount of repayments, both of which may vary from expectations. In particular, annuity writers have liabilities with long-term and relatively predictable cashflows. So (taking into account their other capital and liquidity resources) some of these firms consider that cashflows from a suitable portfolio of ERMs offer a sufficiently good match for some of their annuity liabilities and provide a good risk/return trade-off, given the long duration and reasonably predictable cashflows of a sufficiently large portfolio of ERMs.

In the UK, ERMs are not actively traded in a secondary market, although the PRA is aware of some bilateral transactions between firms. Some ERM holdings have been externally securitised in the past, but the PRA is not aware of widespread use of securitisation as a means of funding ERMs in the UK.

It is common for lenders to require properties to be insured and maintained as part of the loan terms and conditions. There is a risk that maintenance may reduce over time as borrowers become older and potentially cash-poor, and the financial interest of the borrowers in the property reduces. This ‘dilapidation risk’ may lead to the performance (as an asset) of residential properties connected with an ERM being inferior to the performance of similar properties that do not have such a connection. Conversely, if the loan advanced is used to improve the property, then performance may be superior to similar but unimproved properties.

The responsibility for the sale of the property upon exit may, in some circumstances, rest with the lender who, for risk management purposes, may be willing to reduce the sale price in order to reflect a ‘quick sale discount’ on a vacant property, subject to obtaining the best price for the owner within reasonable timescales. If so, this will further increase the value of the NNEG. There may be a relationship between the desirability of offering a quick sale discount and market-wide movements in house prices.

Part of the loan interest rate can be considered as a charge for the cost of the NNEG. Higher interest rates lead to higher NNEG costs, other things being equal, and so (depending on how the ERM is priced) there is potentially a limit to how much the cost of the NNEG can be recouped through an increase in interest rates. Lenders therefore control their overall exposure to NNEGs primarily by restricting loan-to-value (LTV) ratios. LTVs are typically age-dependent, with LTVs lower at younger ages and increasing with age, reflecting changes in expected exit rates. Some lenders offer to advance larger amounts to borrowers in poor health, based on medical underwriting.

From the provider’s point of view, the future value of the ERM at any given exit date depends on whether or not the NNEG bites. If the NNEG does not bite, the loan plus accrued interest is repaid to the provider in full; if it does bite, the repayment is restricted to the value of the property. Thus the present value of the ERM is equal to the sum of: (i) the present value of the loan plus accrued interest at exit date, if and only if the NNEG does not bite; and (ii) the present value of receiving the property, if and only if the NNEG does bite. The computation of this involves, amongst other things, estimating the present value of receiving the property at exit, and – in order to estimate the probability of the NNEG biting – the volatility of the underlying property price.

Thus when the probability of the NNEG biting is low (typically at shorter durations) the value of the ERM approximates to the present value of receiving the loan plus accrued interest at exit. When it is high (typically at longer durations), the value of the ERM approximates to the present value of receiving the property at exit. Note that the present value of the ERM can never exceed the present value of receiving the property at exit, where a NNEG is in place.

The proportion of loans assumed to exit at any given date depends on the probabilities of death, entry into long-term care and early repayment. The mortality experience of the remaining borrowers can be expected to change as borrowers go into long-term care.

The challenges of valuing ERMs include estimating exit probabilities, estimating drawdown rates (for products permitting future drawdowns) and setting property-related assumptions. In addition, appropriate discount rates need to be set for the cashflows being valued. Some of these challenges are explored in the chapters that follow.

The former Individual Capital Adequacy Standards (ICAS) regime permitted insurers to derive a liquidity premium directly from ERMs. Where appropriate, this led to a reduction in the value of liabilities backed by ERMs. The current Solvency II regime has a similar concept in the form of the matching adjustment, but with more prescriptive rules than ICAS. In particular, ERMs do not have fixed cashflows and so do not meet the Solvency II eligibility criteria for inclusion in an MA portfolio. This has led some firms to restructure their ERM portfolios to meet these eligibility criteria

On 6 November 2015 the PRA published a Solvency II Directors’ update1 stating that during 2016 it would undertake an industry-wide review of ERM valuations and capital treatment. The Directors’ update referred to mark-to-model assets more generally but specifically mentioned ERMs, where there are particular challenges and a range of perspectives on the degree of risk embedded in ERMs and how they should be valued. This DP is the first part of this review.

ERM industry stakeholders (including without limitation life insurers, banks, building societies, other lenders, trade bodies, brokers, credit rating agencies, consultants, actuaries and auditors) are invited to participate in the DP by providing answers to the questions. The PRA also invites responses from academics, particularly those with experience of property valuation and the valuation of contingent claims in incomplete markets.


ADI’s Housing Loans Now At $1.43 trillion

The latest data from APRA, the monthly banking stats to February 2016 shows lending portfolios held by the banks for housing was $1,432 billion. The gap between this figure and the RBA reported figure – $109.4 billion,  is the non-bank sector, which represents a 1.38% rise (up $1.49 billion) compared with last month. So one important observation is the non-bank sector is now growing their mortgage loan books faster than the banks.

Looking at the ADI specific data, 63.8% of loans on book are for owner occupation, which is now at $913 billion, up $6.8 billion, or  0.75% from last month, whist the rest is for investment loan purposes, and this was up 0.06% or $340m to $519 billion.

We still of course have noise in the numbers thanks to the ongoing restatements, (RBA says $1.9 billion was restated in February).

But looking at the detail, CBA holds first place for owner occupied loans, and WBC for investment loans.

Lonn-Mix-Feb-2016-NewThe mix of loans between owner occupied and investment loans shows that Bank of Queensland and Westpac have the largest relative proportion of investment loans.

Loan-Mix-Feb-2016Looking at the portfolio movements in real terms, NAB grew their investment loan book faster than their owner occupied loans. The other three large players all focused on owner occupation loan growth, and this is largely related to loan refinancing.

Loan-POrt-Movements-Feb-2016Looking at the 12 month loan growth data by bank, using the APRA baseline, and incorporating adjustments where possible, annual growth rate at a system level for investment loans is now sitting at below 2%. All the big players are below the 10% speed limit now, though some smaller players may be getting some attention from the regulator.

INV-Loan-Growth-12m-Feb-2016On the other hand, growth in the owner occupied portfolios continues a pace, with a estimated average over 12 months of more than 12%. This is high, when compared to average income growth or inflation.

OO-12m-Loan-Growth   Looking at deposits, total balances rose by 0.33% in the month, by $6.4 billion, reaching $1.92 trillion. There was little change in the relative share in the month.

Deposits-Share-Feb-2016This is confirmed by looking at the value of movements month on month.

Deposits-Movements-Feb-2016Finally, credit card balances rose by $382 million to $41.8 billion. There was little change in portfolios, with CBA holding more than 27% of the market.

Cards-Share-Feb-2016The monthly movements highlight the ipact of Christmas spending, and the January repayments. WBC saw the largest lift in balances in the month.

Cards-Movements-Feb-2016

Housing Lending Up To New Record $1.54 trillion

The latest data from the RBA showing the monthly credit aggregates shows that home lending continues to grow, in both the owner occupied and investment property arena.  Non banks are more active. Total lending for housing was a seasonally adjusted $1541.2 billion, up $8.6 billion, or 0.56%. This equates to an annual rate of 7.3%, well above inflation, and income growth. Within that, lending for owner occupation rose $7.6 billion, or 0.77%, whilst lending for investment property rose $1.0 billion or 0.19%.

Credit-Aggregates-Feb-2016Investment housing comprised 35.7% of all loans outstanding, a small fall from last month, but still a large number and higher than it should be.

Business lending rose 0.71% or $5.9 billion, to $844 billion, and comprises 33.4% of all lending, still lower than the 34.3% in 2013. So the slew towards lending for housing still remains.  This equates to 6.5% annual growth.

Banks still prefer to lend for housing than to productive businesses.

Personal credit hardly moved, with a small fall of 0.37%, to $145.4 billion.

The normal caveats apply with regards to the home lending data, with $1.9 billion of adjustments made in February. “Following the introduction of an interest rate differential between housing loans to investors and owner-occupiers in mid-2015, a number of borrowers have changed the purpose of their existing loan; the net value of switching of loan purpose from investor to owner-occupier is estimated to have been $37.3 billion over the period of July 2015 to February 2016 of which $1.9 billion occurred in February. These changes are reflected in the level of owner-occupier and investor credit outstanding. However, growth rates for these series have been adjusted to remove the effect of loan purpose changes”.

We will discuss the APRA monthly banking data in our next post. But according to APRA, total lending to the banks for housing was $1,432 billion, so the rest – $109.4 billion is the non-bank sector, and this represents a 1.38% rise (up $1.49 billion) compared with last month. So one important observation is the non-bank sector is now growing their mortgage loan books faster than the banks. This is a worrying sign.

APRA releases consultation package on Net Stable Funding Ratio

The Australian Prudential Regulation Authority (APRA) has today released for consultation a discussion paper outlining its proposed implementation of the Net Stable Funding Ratio (NSFR). It is proposed that the new standard would come into effect from 1 January 2018, consistent with the international timetable agreed by the Basel Committee on Banking Supervision (BCBS).

The discussion paper also proposes options for the future operation of a liquid assets requirement for foreign authorised deposit-taking institutions (ADIs), i.e. foreign bank branches, in Australia.

APRA originally consulted on proposals for the introduction of the NSFR in 2011, but subsequently placed further consultation on hold pending finalisation of the NSFR by the BCBS, which released details of its final NSFR standard in October 2014.

APRA’s objective in implementing the NSFR in Australia, in combination with the Liquidity Coverage Ratio (LCR) implemented in 2015, is to strengthen the resilience of ADIs. The NSFR encourages ADIs to fund their activities with more stable sources of funding on an ongoing basis, and thereby promotes greater balance sheet resilience. In particular, the NSFR should lead to reduced reliance on less-stable sources of funding — such as short-term wholesale funding — that proved problematic during the global financial crisis.

As with the earlier introduction of the LCR, APRA is proposing that the NSFR will only be applied to larger, more complex ADIs. APRA is currently proposing that 15 ADIs be subject to the NSFR. They are: AMP Bank; Arab Bank; Australia and New Zealand Banking Group; Bendigo and Adelaide Bank; Bank of China; Bank of Queensland; Citigroup; Commonwealth Bank of Australia; HSBC Bank; ING Bank; Macquarie Bank; National Australia Bank; Rabobank Australia; Suncorp-Metway; and Westpac Banking Corporation.

Smaller ADIs with balance sheets that comprise predominantly mortgage lending portfolios funded by retail deposits are likely to have stable funding well in excess of that required by the NSFR, meaning there is limited value in applying the new standard to these entities.

APRA Chairman Wayne Byres said: ‘ADIs have increased the amount of funding from more stable funding sources over the past seven years or so, reflecting an important lesson from the financial crisis as to the need for greater liquidity and funding resilience.

‘The NSFR will serve to reinforce and maintain those improvements in ADI funding profiles. It will also be an important consideration, in addition to capital strength, when determining how to implement the Financial System Inquiry’s recommendation regarding ‘unquestionably strong’ ADIs.’

Liquid assets requirement for foreign bank branches

The discussion paper also sets out proposals for the future application of a liquid assets requirement for foreign bank branches that are currently subject to a concessionary 40 per cent LCR requirement. APRA is consulting on two options: (i) the continuation of the existing regime or (ii) replacing the existing regime with a simple metric that would require foreign bank branches to hold specified liquid assets equal to at least nine per cent of external liabilities.

APRA invites written submissions on the proposals in the discussion paper by 31 May 2016. APRA intends to release a draft revised prudential standard, and an associated prudential practice guide, for consultation later in 2016. This will be followed by revised draft reporting requirements during the second half of 2016.

The discussion paper can be found on APRA’s website at:
http://www.apra.gov.au/adi/PrudentialFramework/Pages/Basel-III-liquidity-NSFR-March-2016.aspx.


Fed Says Future Rate Hikes Will Be Gradual

Chair Janet L. Yellen’s speech at the Economic Club of New York “The Outlook, Uncertainty, and Monetary Policy” reinforces the view that only gradual increases in the federal funds rate are likely.

In December, the Federal Open Market Committee (FOMC) raised the target range for the federal funds rate, the Federal Reserve’s main policy rate, by 1/4 percentage point. This small step marked the end of an extraordinary seven-year period during which the federal funds rate was held near zero to support the recovery from the worst financial crisis and recession since the Great Depression. The Committee’s action recognized the considerable progress that the U.S. economy had made in restoring the jobs and incomes of millions of Americans hurt by this downturn. It also reflected an expectation that the economy would continue to strengthen and that inflation, while low, would move up to the FOMC’s 2 percent objective as the transitory influences of lower oil prices and a stronger dollar gradually dissipate and as the labor market improves further. In light of this expectation, the Committee stated in December, and reiterated at the two subsequent meetings, that it “expects that economic conditions will evolve in a manner that will warrant only gradual increases in the federal funds rate.”

In my remarks today, I will explain why the Committee anticipates that only gradual increases in the federal funds rate are likely to be warranted in coming years, emphasizing that this guidance should be understood as a forecast for the trajectory of policy rates that the Committee anticipates will prove to be appropriate to achieve its objectives, conditional on the outlook for real economic activity and inflation. Importantly, this forecast is not a plan set in stone that will be carried out regardless of economic developments. Instead, monetary policy will, as always, respond to the economy’s twists and turns so as to promote, as best as we can in an uncertain economic environment, the employment and inflation goals assigned to us by the Congress.

The proviso that policy will evolve as needed is especially pertinent today in light of global economic and financial developments since December, which at times have included significant changes in oil prices, interest rates, and stock values. So far, these developments have not materially altered the Committee’s baseline–or most likely–outlook for economic activity and inflation over the medium term. Specifically, we continue to expect further labor market improvement and a return of inflation to our 2 percent objective over the next two or three years, consistent with data over recent months. But this is not to say that global developments since the turn of the year have been inconsequential. In part, the baseline outlook for real activity and inflation is little changed because investors responded to those developments by marking down their expectations for the future path of the federal funds rate, thereby putting downward pressure on longer-term interest rates and cushioning the adverse effects on economic activity. In addition, global developments have increased the risks associated with that outlook. In light of these considerations, the Committee decided to leave the stance of policy unchanged in both January and March.

I will next describe the Committee’s baseline economic outlook and the risks that cloud that outlook, emphasizing the FOMC’s commitment to adjust monetary policy as needed to achieve our employment and inflation objectives.

Bank of England Consults On Tighter Lending Standards For Buy-To-Let

The Bank of England has released a consultation paper which seeks views on a supervisory statement which sets out the Prudential Regulation Authority’s (PRA’s) proposals regarding its expectations of minimum standards that firms should meet when underwriting buy-to-let mortgage contracts. The proposals also include clarification regarding application of the small and medium enterprises (SME) supporting factor on buy-to-let mortgages. Of note is a minimum interest rate floor of 5.5% to be used for testing repayment capacity, and tighter rules on affordability testing.

Firms should assess all buy-to-let mortgage contracts from the perspective of whether the borrower will be able to pay the sums due. The underwriting standards set out in this supervisory statement should form minimum standards, regardless of whether the borrower is an individual or a company.

To avoid existing borrowers being adversely affected when re-mortgaging, the expectations do not apply to buy-to-let remortgages where there is no additional borrowing beyond the amount currently outstanding under the existing buy-to-let contract to the firm or to a different firm. In determining the amount currently outstanding, new arrangement fees, professional fees and administration costs should be excluded.

Any reduction in buy-to-let activity and lower buy-to-let mortgage stock will lead to a reduction in short-term revenues for lenders and mortgage brokers. While affected firms may be able to recover some of the reduction in revenues by lending to owner-occupiers or other business activities in the economy, we think some more affected firms may find it difficult to recover lost revenues. Some buy-to-let investors could see an impact on their ability to obtain a buy-to-let mortgage and/or the profitability of their lending activities due to higher deposit requirements. However, affected investors may be able to find returns in other investment opportunities.

Affordability testing

Affordability tools constrain the value of the loan that a firm can extend for a given income and can reduce the probability of default on the loan particularly in an environment of rising interest rates. At higher levels of indebtedness, borrowers are more likely to encounter payment difficulties in the face of shocks to income and interest rates.

Rental income is an important factor when determining the ability of buy-to-let landlords to service their debt. Accordingly, a widespread market practice in the buy-to-let lending market is to use the mortgage’s interest coverage ratio (ICR) in assessing affordability. In addition to rental income, some borrowers use personal income to support their ability to service their debt.

The PRA is therefore proposing that all firms use an affordability test when assessing a buy-to-let mortgage contract in the form of either an ICR test; and/or an income affordability test, where firms take account of the borrower’s personal income to support the mortgage payment.

The PRA is seeking to establish a standard set of variables that should be reflected within the ICR test and the income affordability test. To ensure that firms are being prudent in their affordability assessment, the PRA is proposing that firms, among other things, give consideration to: all costs associated with renting out the property where the landlord is responsible for payment; any tax liability associated with the property; and where personal income is being used to support the rent, the borrower’s income tax, national insurance payments, credit commitments, committed expenditure, essential expenditure and living costs.

As affordability constrains the value of the loan a firm can extend, the PRA is not at this time proposing supervisory guidance with respect to specific loan-to-value (LTV) standards. However, the PRA does expect firms to have appropriate controls in place to monitor, manage and mitigate the risks of higher LTV lending.

Interest rate affordability stress test

The buy-to-let market is characterised by floating, or relatively short-term fixed mortgage rates typically on an interest-only basis. These attributes heighten the sensitivity of buy-to-let lending to changes in interest rates, which increase debt service costs.

Consequently, the PRA proposes that, when assessing affordability in respect of a potential buy-to-let borrower, firms should take account of likely future interest rate increases. In particular, the PRA proposes that the firm should consider the likely future interest rates over a minimum period of five years from the expected start of the term of the buy-to-let mortgage contract, unless the interest rate is fixed for a period of five years or more from that time, or for the duration of the buy-to-let mortgage contract if less than five years. In coming to a view of likely future interest rates, the PRA would expect firms to have regard to: market expectations; a minimum increase of 2 percentage points in buy-to-let mortgage interest rates; and any prevailing Financial Policy Committee (FPC) recommendation and/or direction on the appropriate interest rate stress tests for buy-to-let lending.

Even if the interest rate determined above indicates that the borrower’s interest rate will be less than 5.5% during the first 5 years of the buy-to-let mortgage contract, the firm should assume a minimum borrower interest rate of 5.5%.

Portfolio landlords

The PRA is seeking to establish a standard definition of what constitutes a ‘Portfolio landlord’. Under this proposal, a landlord would be considered to be a Portfolio landlord where they have four or more mortgaged buy-to-let properties across all lenders in aggregate. Data gathered by the PRA shows that there is an increase in observed arrears rates of landlords with buy-to-let portfolios of four or more mortgaged properties.

The PRA is expecting that firms conducting lending to Portfolio landlords do so according to a specialist underwriting process that accounts for the complex nature of the borrower and their portfolio of properties.

Risk management

The PRA is proposing that firms have robust risk management, systems and controls in place specifically tailored to their buy-to-let portfolios. These should include risk appetite statements governing how core risks will be identified, mitigated and managed and monitoring of portfolio concentrations and high risk segments.

The buy-to-let market is dominated by lending originated through intermediaries. There is some concern that firms with weaker underwriting standards may be adversely selected which could result in a concentration of a particular risk on individual firms’ balance sheets. Consequently, the PRA expects firms to have appropriate oversight and monitoring capabilities with respect to their intermediary business.

The SME supporting factor in relation to buy-to-let mortgages

The PRA proposes to enhance the transparency and consistency of the PRA’s regulatory approach by clarifying the PRA’s expectations in relation to application of the SME supporting factor on buy-to-let mortgages.

Under Article 501 of the CRR the SME supporting factor is used to reduce by approximately 24% the capital requirements on loans to SMEs on qualifying retail, corporate and real estate exposures. The PRA does not consider that buy-to-let borrowing falls within the objective of the SME supporting factor described in Article 501 CRR. The PRA proposes to clarify in the supervisory statement that it expects firms to consider the intended purpose of a loan before applying the SME supporting factor. The SME supporting factor should not be applied where the purpose of the borrowing is to support buy-to-let business. The PRA would expect firms to comply with the spirit and intent of this statement.

UK Outlook for Financial Stability has Deteriorated – Bank of England

The Bank of England’s Financial Policy Committee (FPC) assesses the outlook for financial stability by identifying the risks faced by the financial system and weighing them against the resilience of the system.  In doing so, its aim is to ensure the financial system can continue to provide essential services to the real economy, even in adverse circumstances. In today’s release, they highlight financial stability risks, raise the counter-cyclical capital buffer in 2017 and underscore potential threats to financial stability from rapid growth in buy-to-let mortgage lending.

The FPC judges that the outlook for financial stability in the United Kingdom has deteriorated since it last met in November 2015.  Some pre-existing risks have crystallised, drawing on the resilience of the system.  Other risks stemming from the global environment have increased.  Domestic risks have been supplemented by risks around the EU referendum.  Weighed against these developments, the resilience of the core banking system has improved further since November 2015, though investor expectations of future profitability have weakened, with possible implications for banks’ ability to build resilience in the future.  In some financial markets, underlying liquidity conditions have continued to deteriorate.

In December, the Committee signalled its intention to set the UK countercyclical capital buffer rate in the region of 1% in a standard risk environment.   Consistent with the Committee’s assessment of the current risk environment, and its intention to move gradually, the Committee has decided to increase the UK countercyclical capital buffer rate from 0% to 0.5% of risk-weighted assets.  This new setting will become binding with effect from 29 March 2017, at which time the overlapping aspects of Pillar 2 supervisory capital buffers will be lifted.  This will increase transparency and sharpen the incentives of the buffer system.

The FPC also took account of the review by the PRA Board of the overlap between the risks captured by current supervisory capital buffers and a positive UK countercyclical capital buffer. Following its review, the PRA Board has concluded that existing Pillar 2 supervisory capital buffers should be reduced, where possible, by the full 0.5% UK countercyclical capital buffer. This is a one-off adjustment reflecting the transition to the new capital framework and will take place when the new setting of the UK countercyclical capital buffer rate comes into force in March 2017.

The removal of any overlap means that banks accounting for around three quarters of the outstanding stock of UK lending will not see their overall regulatory capital buffers increase as a result of the UK countercyclical capital buffer rate being increased to 0.5%. Other banks will effectively have the period over which they must meet new requirements extended. This will be documented in a forthcoming statement by the PRA Board. The FPC’s action will raise the future regulatory capital buffer of some banks, including many smaller banks that have contributed around half of the increase in net lending to the real economy over the past year. Almost all of these banks currently carry capital in excess of the 2019 Basel III requirements and the 0.5% UK countercyclical capital buffer. The FPC recognises that these banks may wish to build capital over time in order to retain some excess over regulatory capital buffers, but their current position means that any such action will be able to take place gradually.

The UK countercyclical capital buffer rate will apply to all UK banks and building societies and to investment firms that have not been exempted by the Financial Conduct Authority. Under European Systemic Risk Board rules, it will apply to branches of EU banks lending into the United Kingdom. The FPC will work with other authorities to achieve reciprocity, consistent with its own policy on reciprocity.

The Committee assesses the risks around the referendum to be the most significant near-term domestic risks to financial stability. It will continue to monitor the channels of risk closely and support mitigating actions where possible. In that regard, the FPC has considered the results of the 2014 stress test of major UK banks, which incorporated an abrupt change in capital flows, a sharp depreciation of sterling, a marked increase in unemployment and a prolonged recession. The results of that test, when combined with revised bank capital plans, suggested that the banking system was strong enough to continue to serve households and businesses during the severe shock1. Since then, UK banks’ resilience has increased further.

The FPC remains alert to potential threats to financial stability from rapid growth in buy-to-let mortgage lending. The outstanding stock of buy-to-let mortgages has risen by 11.5% in the year to 2015 Q4. The macroprudential risks centre on the possibility that buy-to-let investors could behave pro-cyclically, amplifying cycles in the housing market, as well as affecting the resilience of the banking system and its capacity to sustain lending to the wider real economy in a stress.

Overall, the Committee judges that, although measures of bank resilience have improved since November 2015, investors expect weaker future profitability.

Measures of bank resilience have continued to strengthen. Major UK banks’ aggregate common equity Tier 1 (CET1) ratio has increased further, to 12.6% at end-2015. The aggregate Tier 1 capital ratio of major UK banks reached 13.8% and the Tier 1 leverage ratio reached 4.8% – both a little higher than the FPC’s view of the steady state capital requirements for the major UK banks as currently measured3.

At the same time, investors expect future bank profitability to be weaker. UK bank share prices have fallen by around 15% since November 2015, though there are significant differences in expectations of performance across bank business models. If expectations of weaker earnings were to materialise, the future capacity of the system to withstand shocks through internal capital generation would be reduced.