The latest results from the Digital Finance Analytic Household Surveys are in, and demand has recovered somewhat after the wobble late last year. Worth also remembering that Sirens were dangerous yet beautiful creatures, who lured nearby sailors with their enchanting music and voices to shipwreck on the rocky coast of their island! Over the next few days we will present the summary results, using our household segmentation, and examine why property remains so alluring despite being in bubble territory.
By way of background, we are using data from our rolling 26,000 household data set, the most recent data is up to 20th February 2016, so this captures the state of play after the recent stock market and resource sector ructions. Today we will overview some of the main cross-segment data, and in later posts dive into more detailed analysis of specific segment behaviour. These results will then flow into the next edition of the Property Imperative – the last edition is still available from September 2015, and the new edition will be out in March.
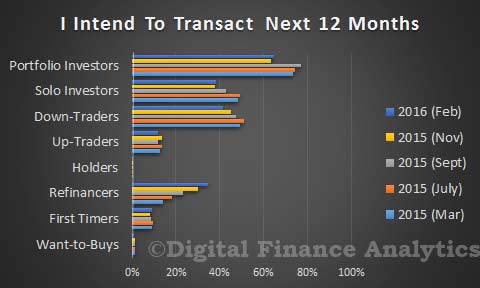
We start with transaction intentions. The most significant move is the rise in those expecting to refinance their existing mortgage, from 29% last time to 34% now. This despite record refinance volumes which have already been written. We found that many households were reacting to the strong discounts available for existing borrowers, especially with loan-to-value ratios below 80%. Three quarters of these households will use a broker, so no surprise we see brokers volumes on the rise. First time buyers are still in the market, from 8.2% to 8.9% this time. Property investors, whether holding a portfolio of properties, or just one, are still in the market, despite the rise in interest rates for investment loans, and tighter lending criteria. Portfolio investors moved form 63% to 64% this time, whilst solo investors moved from 37% to 38%. Up traders and down traders are a little less inclined to transact, whilst those wanting to buy, but who cannot, remain on the sidelines.
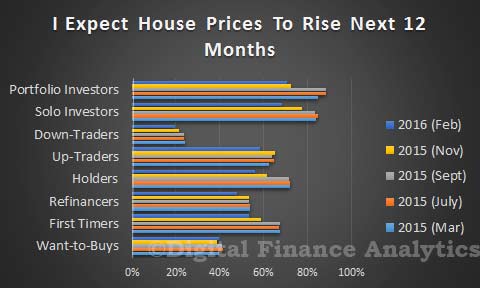
 House price rise expectations are still quite strong, though lower than at their peak last year. More than half of property investors still think the market will go higher in the next 12 months. Down traders are the least optimistic with only 20% expecting further price hikes. First time buyers are still bullish, with 53% expecting a rise, though a fall from 67% last year.
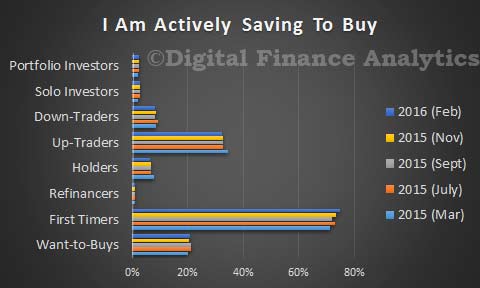
 Savings behaviour has not changed that much, with first time buyers still saving the hardest. Some of those wanting to buy are also saving, but it continues to sit at around 20%.
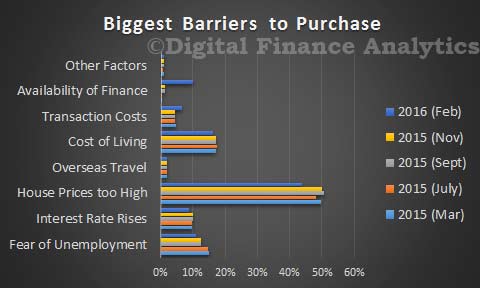
 Of note is the significant rise in households who say that availability of finance is now a barrier to transacting, with nearly 10% saying finding a loan is now a problem compared with just 1.5% last year. Of course house prices remains high, so 43% say this is a barrier to transacting, down from 49% last year. On the other hand, unemployment fears are down compared with last year, down from 15% to 11%.
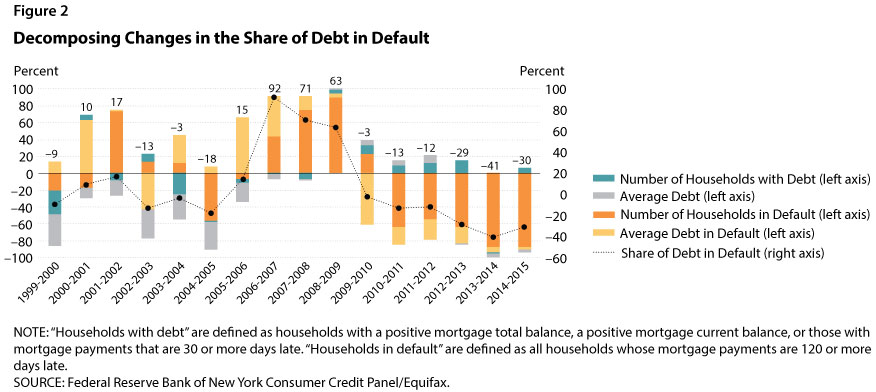
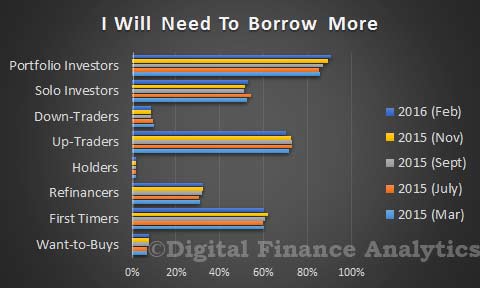
 Prospective purchasers are still looking for finance, with investors and first time buyers seeking to borrow more. Around 15% of those refinancing will look to increase the size of their loan, which explains some of the ongoing loan portfolio growth noted in recent statistics.
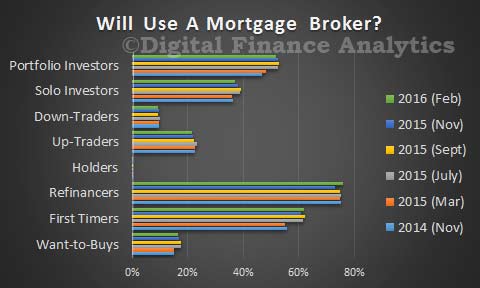
 Finally, in this over view, we note the importance of mortgage brokers as noted in the recent APRA data, with first time buyers and those seeking to refinance the most likely to consult a broker. Investors are also still broker aligned, especially portfolio investors.
 So, the expectations are for ongoing demand for property still to be strong, and refinance volumes will remain elevated. Banks are competing hard to offer deep discounts for owner occupied loans. Next time we will look in more detail at first time buyers, and then those seeking to refinance.