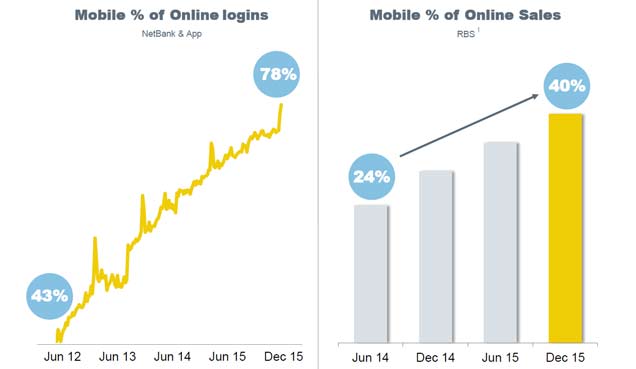
In CBA’s results, announced today, we see a well managed portfolio, with no surprises on either capital or dividends. They had the benefits of higher home loan pricing, and deposit rate management helping to offset some pressure in returns from the Institutional Banking arm. CBA’s early moves into digital banking continue to pay off, with 40% of retail banking sales now via mobile devices. Exposure to the resources sector is controlled, and the bank is well capitalised (on a relative and absolute basis), with a lift in key ratios. Earning per share decreased a little.
Statutory net profit after tax (NPAT) for the half year ended 31 December 2015 was $4,618 million, a 2 per cent increase on the prior comparative period (‘pcp’). Cash net profit after tax increased 4 per cent to $4,804 million, 6 per cent higher on the prior half. Return on equity was 16.6% and earnings per share was 273.6 cents, a decrease of 1% on the prior comparative period.
The Board declared an interim dividend of $1.98 per share, unchanged from the 2015 interim dividend. The dividend payout ratio is 70.8 per cent of cash NPAT. The interim dividend, which will be fully franked, will be paid on 31 March 2016. The ex-dividend date is 16 February 2016. The Dividend Reinvestment Plan (DRP) will continue to operate, but no discount will be applied to shares issued under the plan for this dividend. The Group is also considering the issue of a Tier 1 capital instrument to replace PERLS III should markets be receptive.
In summary, operating income growth was solid across most businesses, relative to both the prior comparative period and prior half but operating expenses increased due to underlying inflationary pressures, the impact of foreign exchange, increased investment spend and higher amortisation, though partly offset by the incremental benefit generated from productivity initiatives. Also loan impairment expense increased mainly due to higher provisioning in Institutional Banking and Markets, Retail Banking Services, and IFS.
Group transaction balances grew 21 per cent and above-system growth was achieved in household deposits (up 10.6 per cent) and business lending (up 6.8 per cent, excluding Bankwest). A balanced approach to margin over volume in home lending produced growth of 6.5 per cent, slightly below system. ASB saw 12 per cent growth in business and rural balances.
Other banking income increased 4 per cent, due to higher profits from associates and solid growth in fees and commissions, partly offset by derivative valuation adjustments.
Growth in insurance and funds management income of 17 per cent and 6 per cent, respectively, led to a 10 per cent increase in underlying profit after tax for the Wealth Management division.
Operating expenses increased 6% to $5,216 million, including a 1% impact from the lower Australian dollar. This reflects higher staff costs from inflation-related salary increases, increased investment spend and higher amortisation. This was partly offset by the continued realisation of incremental benefits from productivity initiatives
Ongoing investment spend, inflation and unfavourable foreign exchange movements resulted in a 6.1 per cent increase in total operating expenses. On an underlying basis, expenses grew 3.8 per cent as a result of cost discipline in business units. Total investment spend increased 14 per cent, with the majority earmarked for productivity and growth initiatives.
Net interest income increased 6 per cent to $8,364 million, reflecting 9 per cent growth in average interest earning assets driven by solid volume growth and revenue momentum across the business. This increase includes a 1% benefit from the lower Australian dollar. Net interest margin excluding Treasury and Markets decreased five basis points on the prior comparative period to 2.06%.
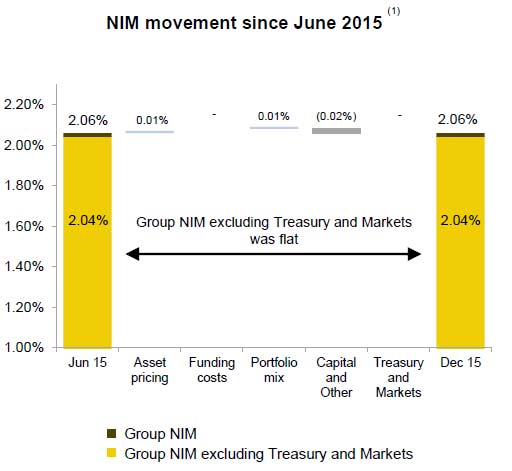
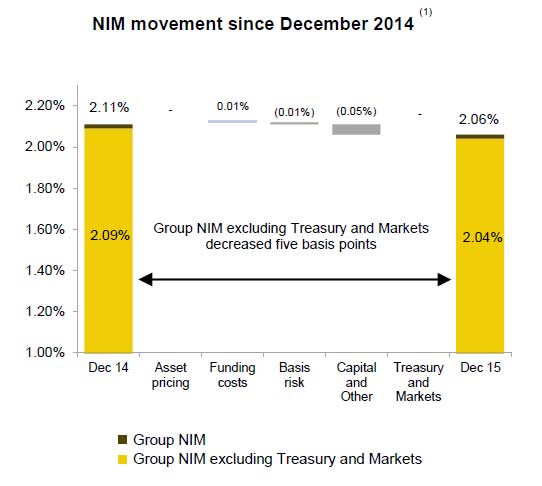 However, overall, 2.06% is the same as Jun 15 Half. This was helped by higher home lending margins, due to investor and variable rate pricing; and stable deposit margins, driven by a benefit from a change in deposit mix, offset by the lower cash rate environment. In addition, better margins from lending to business, and lower business deposit rates contributed. However, at BankWest, net interest margin decreased on the prior half, due to lower business lending margins and the lower cash rate impact on deposit margins, partly offset by increased home loan margins resulting from repricing.
 Loan impairment expense increased 3 per cent on the prior half to $564 million, and the loan loss ratio remained stable at 17bpts.
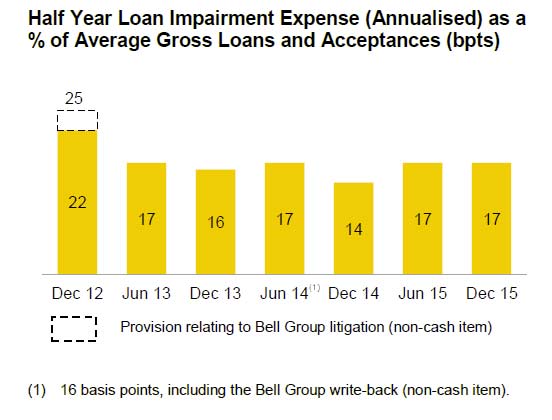 Various elements contributed to this including higher collective provisions and a lower level of writebacks in Institutional Banking and Markets; an increase in IFS as a result of provisions in the
commercial lending portfolio; partly offset by reduced expense in Retail Banking Services driven by seasonally lower arrears across all portfolios; increased write-backs and lower collective provisions in Business and Private Banking; and decreased expense in New Zealand resulting from lower home loan impairment expense, and an increased level of write-backs in the business lending portfolio.
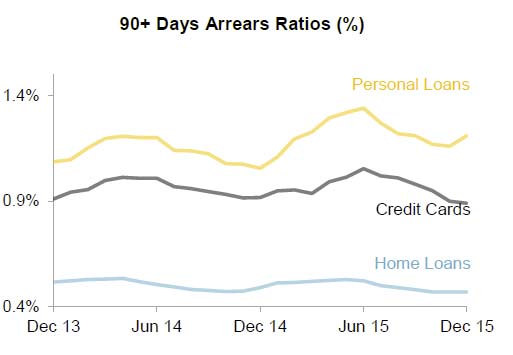
Consumer arrears were well controlled, though whilst the arrears for the home loan and credit card portfolios are relatively low, personal loan arrears remained elevated, driven primarily by Western Australia and Queensland.
 Commercial troublesome assets increased 2% during the half to $3,123 million. Gross impaired assets were lower on the prior half at $2,788 million. Gross impaired assets as a proportion of GLAAs of 0.41% decreased 3 basis points on the prior half, reflecting the improving quality of the corporate portfolios.
There was no change to the economic overlay.
The Group’s balance sheet and conservative positions on capital, funding and liquidity have been strengthened in the first half. Growth in customer deposits of 9 per cent to $500 billion increased deposit funding to 64 per cent of total funding, up 1 per cent. The Group’s liquidity coverage ratio increased to 123 per cent as at 31 December 2015, up from 120 per cent at the end of the prior half, with the Group continuing to benefit from a strong position in more stable deposits.
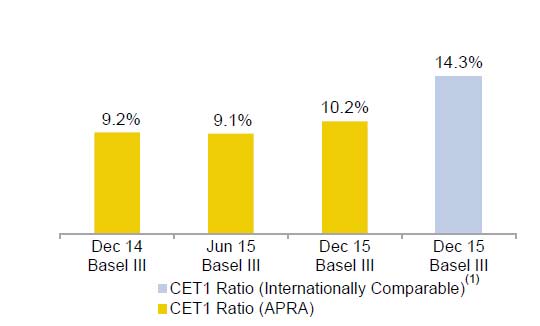
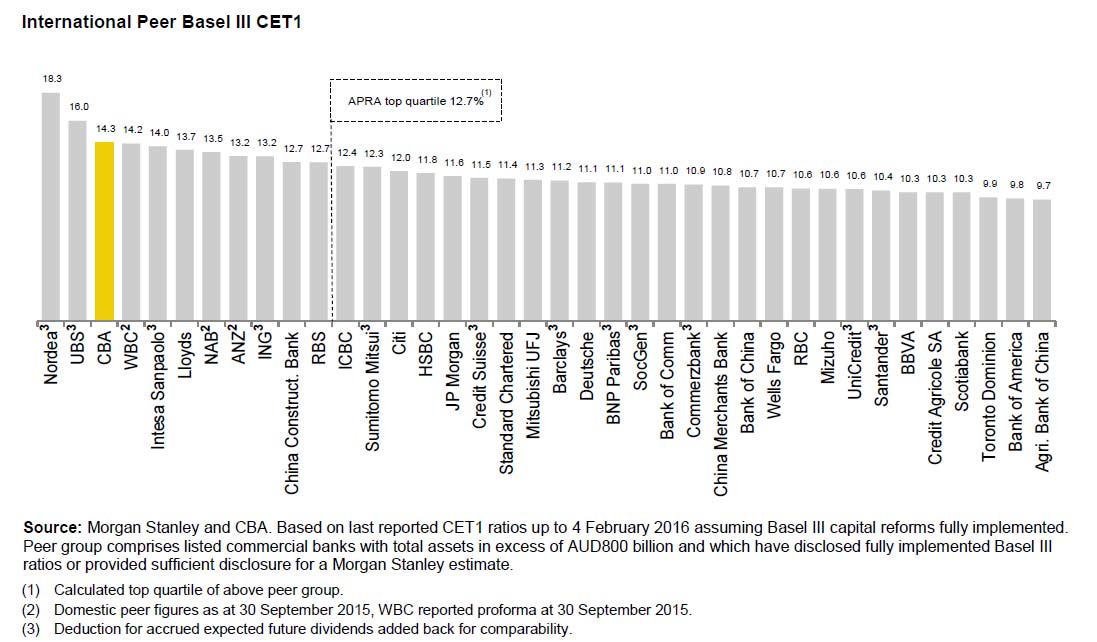
Basel III Common Equity Tier 1 (CET1) capital increased 100bpts to 10.2 per cent on an APRA basis (14.3 per cent on an internationally comparable basis), reflecting organic capital growth and the proceeds of the rights issue.
 They say this puts the Group in the top quartile of banks globally for capital adequacy.
 Customer satisfaction rankings continued to improve.
They reported a strong uptake of digital and mobile services in the half with Tap & Pay card numbers more than doubling on the prior half, Cardless Cash transactions grew 96 per cent, and the value of transactions via the CommBank app was up 27 per cent. The volume of transfers via mobile now exceeds BPAY volumes through Netbank. They are also seeing customers increasingly turn to mobile for product purchases with mobile now accounting for 40 per cent of Retail Banking Services sales.
 In the half, CBA made additional future-focused investments in technology and skills. This included $10 million to help Australian researchers build the world’s first silicon-based quantum computer, committed $1.6 million to develop a centre of expertise for cyber security education with the University of New South Wales. They also launched a series of blockchain workshops for industry and regulators, and are collaborating with other international banks on blockchain trials.
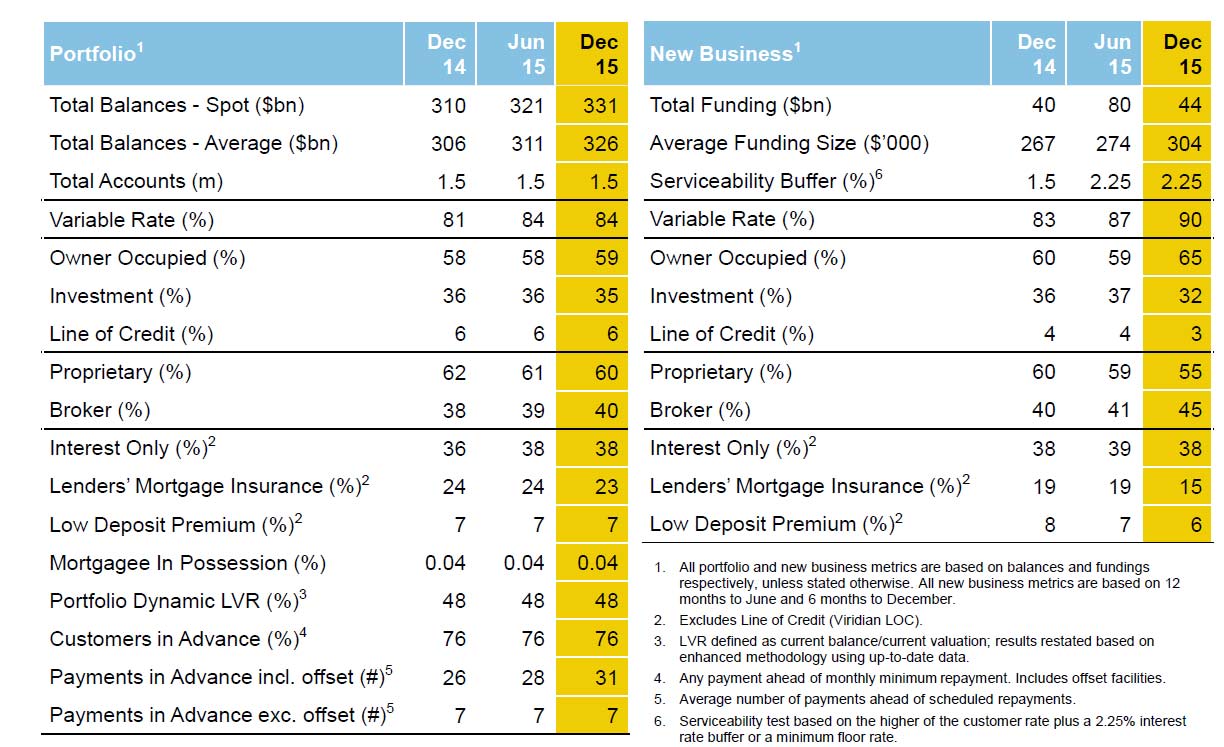
Looking in detail at home lending in Australia, CBA provided some interesting insights. For example, looking at the core Australian Bank portfolio, 45% of new home loans are originated via brokers. 38% of new loans are interest only, and the current serviceability buffer has been lifted by 75 basis points in the past year. Those customers paying in advance, including offsets, was 76%.
 They also show that 90+ arrears are growing fastest in WA.
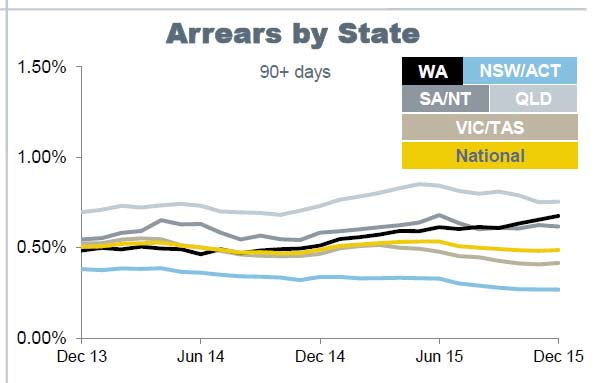 On the other hand, portfolio is much stronger in NSW and VIC.
Finally, they reported exposures to Mining, Oil and Gas at $18.9bn – or 1.8% of Group TCE. They argue much of the portfolio is investment grade. Within the portfolio, impaired assets have risen from 0.8% in Jun 15 to 1.9% in December 15.
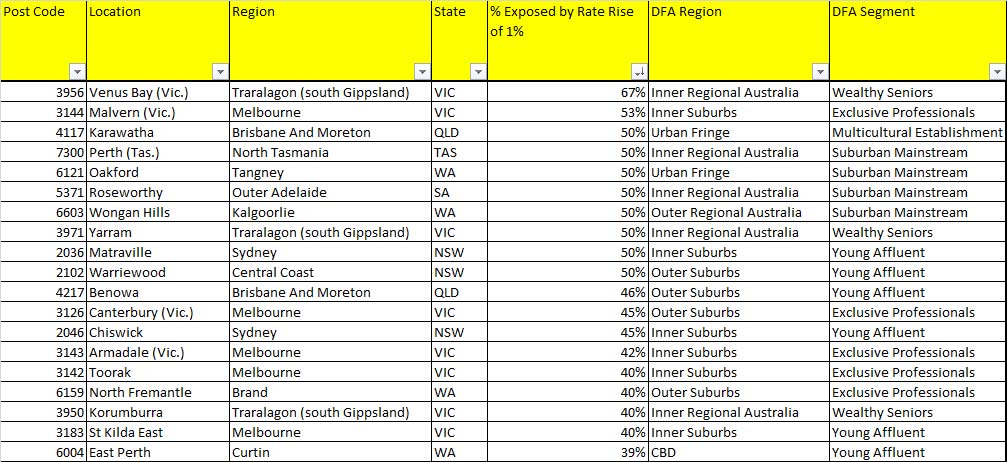 The analysis is based on responses to our survey which asks whether households feel they could cope with covering the costs of an additional 1% on their mortgage. Given that many have mortgages of more than $500,000, even a small rise is enough to create problems, especially given static income. Note also that more affluent segments are more at risk.




 Customer satisfaction rankings continued to improve.


