Financial Firm Regulation and External Audit

The Financial Stability Institute has issued an occasional paper entitled “the “four lines of defence model” for financial institutions.” It takes the so called three-lines-of-defence model further to reflect specific governance features of regulated financial institutions. The paper highlights issues which exist in the current “recommended” approach, and specifically limitations of internal audit. Embedding the external auditors’ role in the structure of the defence system could mitigate the shortcomings of the traditional three-lines-of-defence model and increase the soundness and reliability of the risk management framework.

Since the Global Financial Crisis of 2007–09, the design and implementation of internal control systems has attracted serious academic and professional attention. Much research on the effectiveness and characteristics of internal audit functions has been conducted under the sponsorship of the Institute of Internal Auditors Research Foundation (IIARF) and published in academic and professional journals. The guidelines issued by the Basel Committee on Banking Supervision (BCBS) in 2015 on corporate governance principles for banks emphasise the importance of proper risk management procedures, including, in particular, “an effective independent risk management function, under the direction of a chief risk officer (CRO), with sufficient stature, independence, resources and access to the board.” Furthermore, “the sophistication of the bank’s risk management and internal control infrastructure should keep pace with changes to the bank’s risk profile, to the external risk landscape and in industry practice” so as to identify, monitor and control risks on an ongoing bank-wide and individual-entity basis.

Despite these efforts, there has been little systematic analysis of how the design of an internal control system affects the efficiency and effectiveness of corporate governance processes, especially at financial institutions such as banks and insurance companies. The “three lines of defence model” has been used traditionally to model the interaction between corporate governance and internal control systems.

Thee-LinesRecent significant risk incidents and corporate scandals caused by misconduct in financial market operations indicate that banks need to further enhance corporate governance measures. But, most importantly, such incidents have led to a further prioritisation of governmental and supervisory agendas relating to the potential systemic implications of weak internal control systems. This calls for a greater prominence of microprudential policies relating to misconduct at banks. It also calls for closer cooperation between regulators, and external and internal auditors, so as to win back public trust in financial institutions.

Specifically, four areas of weakness exist:

  1. Misaligned incentives for risk-takers in first line of defence
  2. Lack of organisational independence of functions in second line of defence
  3. Lack of skills and expertise in second line functions
  4. Inadequate and subjective risk assessment performed by internal audit

In order to account for the specific governance features of banks and insurance companies, they outline a “four lines of defence” model that endows supervisors and external auditors, who are formally outside the organisation, with a specific role in the organisational structure of the internal control system.Four-LineBuilding upon the concept of a “triangular” relationship between internal auditors, supervisors and external auditors, they examine closely the interactions between them. By establishing a fourlines-of-defence model, they believe that new responsibilities and relationships between internal auditors, supervisors and external auditors will enhance control systems. That said however, they also highlight the risk that new problems could be caused by inadequate information flows among those actors.

Regulatory capital ratios, as well as other indicators of financial strength, such as liquidity and leverage ratios, are produced alongside banks’ standard financial reports but are not audited in the same way. This may create an expectations gap for society: what may be a bank’s most looked-at indicator is not audited. External auditors could perform assurance tasks related to such regulatory requirements (including capital ratios and risk-weighted assets, and leverage and liquidity ratios). Requirements for the independent scrutiny of regulatory capital information have evolved piecemeal across the world; some countries mandate publically available assurance reports, some only require financial institutions to inform regulators while others have no reporting requirement whatsoever. Given the size and importance of the banking sector – and the systemic risk posed to global financial markets – credibility and reliability are crucial.

They explored developments in a number of countries to illustrate the importance of increased cooperation between bank supervisors and external auditors:

1. United Kingdom:
The Prudential Regulation Authority (PRA) of the United Kingdom recently issued a consultative document59 laying out the rules for external auditors of the largest UK banks for the provision of written reports to the PRA as part of the statutory audit cycle. The PRA asked external auditors to contribute to its supervision of firms by directly engaging in a pro-active and constructive way to support judgment-based supervision and help promote the safety and soundness of firms supervised by the PRA. The insights gained by auditors when they carry out high-quality audits should help enhance the effectiveness of the relationship between the auditors and the supervisor.

There have been improvements in the last few years such as a closer and more frequent engagement between supervisors and external auditors. The PRA keeps monitoring the quality of auditor-supervisor dialogue. In a survey of external auditors, it was noted that the vast majority of engagements was considered only ‘reasonable’ and that the PRA’s aim was to improve this engagement in the longer term. In particular, in individual cases both supervisors and auditors considered that there was room for improvement in the frankness with which information was shared, how often it was shared and what was covered in bilateral meetings.

2. Switzerland:
For many years, the Swiss Financial Market Supervisory Authority (FINMA) has adopted a dualist approach whereby on-site examinations are outsourced to approved and licensed external auditors. A recent IMF assessment 60 noted significant weaknesses in Swiss supervision. FINMA should provide more guidance to auditors to ensure greater supervisory harmonisation across entities and should complement the auditors’ work with its own in-depth examinations of selected issues. In addition, the payment of auditors by a supervised entity was viewed critically as auditors should not be paid by a supervised entity but rather by a “FINMA administered bank-financed fund”. The IMF also noted that FINMA’s on- and off-site supervisory resources had been increased in recent years but still needed to be strengthened. Resources were insufficient to supervise and regulate the entire banking system in a way that met the Core Principles for Banking Supervision, including sufficient in-depth on-site work and oversight of supervisory work done by external auditors, particularly for small- and medium-sized banks.

3. United States:
A recent IMF report examined the relationship between supervisors and external auditors, and noted “that supervisors meet periodically with external audit firms to discuss issues of common interest relating to bank operations”. It also noted that there was no “safe haven” protection for external auditors in reporting issues to regulators. However, according to Part 363 of the Federal Deposit Insurance Corporation (FDIC) rules, a bank must inform its supervisor within 15 days of having received written information from the auditors about a violation that was committed. This gap is somehow mitigated by the frequent contact between supervisors and auditors in the course of examinations and planning. Furthermore, although the supervisors cannot set the scope of the external audit, they could encourage the auditors to include new issues. However, the report highlighted weaknesses relating to the fact that supervisors do not have legal powers to add specific issues to the scope of the external audit in order to address issues that are not normally covered by such an audit.

4. Hong Kong:
The Hong Kong Monetary Authority (HKMA) devotes significant efforts to ensuring effective communication channels with external auditors. Furthermore, its powers to commission external auditor reports for supervisory purposes further supports the relationship between the HKMA and the external auditors, and the understanding of the HKMA’s supervisory concerns. However, a recent IMF report63 states that there are two areas in which the HKMA lacks powers and where the legislative framework could be enhanced: the HKMA lacks powers to reject the appointment of an external auditor, when there are concerns over its competence or independence, and it does not have direct power to access the working documents of the external auditor even though the HKMA is able to address issues that arise by indirect means. While the HKMA has been able to work around these restrictions, amendments to the relevant legislation should be made.

Building Stronger Macroprudential Frameworks

Durable financial stability requires more than microprudential standards that bolster the resilience of individual firms. It also requires a macroprudential perspective, with flexibility to respond to shocks wherever they occur; with higher standards for systemically important firms; and to increase levels of resilience when risks increase.

Mark Carney, Governor of the Bank of England, Chairman of the Financial Stability Board and Vice-Chair of the European Systemic Risk Board, (ESRB) has addressed European Parliament’s ECON Committee.

The ESRB is the only hub where all the relevant authorities are present, including central banks, bank supervisors, and securities authorities. Through our regular dialogue we can establish and update best practice.

Consider residential real estate. This year ESRB’s work emphasised how these markets were influenced by structural differences, from Loan-to-Value restrictions to tax treatments, across the EU.

Its analysis identified the tools authorities may use to respond to different vulnerabilities, ranging from capital measures to restrictions on debt-to-income ratios and collateral.

Key lessons of the analysis include that:

1. flexibility is needed in both design and calibration of macroprudential tools;

2. no single tool can combat all property risks;

3. tools need to be appropriate to domestic circumstances; and

4. domestic policies are more effective for both domestic and EU financial stability if their spillovers are managed.

The ESRB has built a framework to assess and manage such spillovers, which should be agreed soon and be operationalised early next year. Its central feature is reciprocity – eliminating regulatory arbitrage to give domestic policy greater traction. It will be member led, but, importantly, backed by ESRB recommendations. Compliance will be on an “act or explain” basis but the presumption will be that many exposure-based measures (e.g. LTV, LTI and maturity) will be reciprocated.

This is significant. The ESRB has been notified of macroprudential actions 69 times this year, and 173 times since the introduction of the CRR/CRD in 2014. Although many notices are procedural, they show the direction of travel. More countries are using macroprudential tools, creating an increasing need for a “clearing house” that is both comprehensive and timely.

The ESRB will also evaluate the ways national macroprudential authorities might apply countercyclical capital buffers against financial exposures from countries outside the EEA – a tool given to the ESRB under Union law. That will further bolster collective resilience against the global financial cycle and spillovers from outside the Union.

While risks in property markets reflect national differences, other risks such as misconduct have more common determinants.

In the past five years, misconduct penalties imposed on EU banks have totalled €50bn.

Those costs have direct implications for the real economy. At 5% leverage, that capital could have supported €1 trillion of lending capacity.

More fundamentally, repeated episodes of misconduct undercut public trust in the system.

The ESRB’s work has helped catalyse sensible actions to begin the process to rebuild that trust.

First, it has proposed capturing misconduct costs in stress tests to ensure banks remain resilient even under severe outcomes.

The Bank of England has followed this approach in its most recent stress test which included and additional £40bn of misconduct costs. These costs were calibrated to have a low likelihood of being exceeded and are therefore, by design, much larger than the amounts already provided for by banks.

Second, the ESRB has also proposed tackling misconduct at source by increasing individual accountability. This can be done by reforming remuneration – using variable pay, combined with Malus and Clawback, to hard-wire stronger incentives for good behaviour within firms. The UK is committed to this approach with the toughest remuneration regime in the EU, including the longest deferrals and claw backs.

However, the effectiveness of such measures across the EU is being tempered by the bonus cap. For example, in 2013, the ratio between fixed and variable for material risk takers at major UK banks was around 1:3 – meaning three quarters of remuneration was at risk from individual misconduct. The next year, when firms first had to apply the bonus cap, that ratio had fallen to around 1:1, with the overall level of remuneration unaffected.

Prompted by the ESRB, the FSB is now examining the impact of various compensation tools on misconduct, and if appropriate, it will recommend improvements to next year’s G20 summit.

Reforms to compensation are necessary but not sufficient. ESRB reports have rightly stressed that more should be done to hold senior individuals to account.

Prompted in part by the ESRB, the FSB members will share experiences on the role of bank regulatory powers to address misconduct and on approaches to enhancing individual accountability.

In the UK, we are implementing a new regime to ensure senior managers right across the financial system are held directly accountable for failures in their areas of responsibility. That will be buttressed by clear code of conduct, designed by practitioners, to ensure high standards are understood by all.

Aussies tightening their belts this Christmas

According to ING, Aussies are taking control of their finances this holiday period, intending to spend $313 on Christmas gifts, significantly less than the US and UK.

The latest ING Special Report on Christmas and New Year found Aussies are cautious about getting caught out overspending during the festive period, with 73 per cent planning to spend less on Christmas this year.

As they focus on managing their festive finances, Aussies anticipate spending just 7 per cent of their monthly income on Christmas gifts, less than half of the 15 per cent US and UK counterparts intend to fork out.

Additional findings:

  • 63 per cent of Australians don’t save money for Christmas and only 29 per cent put money in a separate account to pay for Christmas costs
  • One in ten (12 per cent) Australians went into debt to pay for Christmas last year, however this is still less than the US (20 per cent) and UK (15 per cent)
  • 14 per cent of Victorians admitted going into debt to pay for Christmas last year, closely followed by people from NSW (13 per cent), while South Australians were the most budget conscious, with less than 8 per cent spending beyond their means last Christmas

John Arnott, Executive Director, Customers, ING DIRECT, says: “Christmas and New Year is primarily about family, friends and fun, but it can become stressful – mainly because of the potential shock to the wallet.

“While some of us can be tempted to stretch finances almost to breaking point for festivities, the great news this year is that more and more of us are planning on keeping a close watch on our wallets, helping to minimise any New Year financial hangover.”

ING Christmas Spending League versus average income


Country
Median spend on Christmas presents (AUD^)
Spend as a percentage of average monthly earnings
Average monthly net earnings (AUD)*
Unsure how much they will spend
United Kingdom
656
15%
4392
42%
Luxembourg
469
9%
4983
45%
Austria
391
11%
3626
38%
France
391
11%
3476
42%
Germany
313
9%
3618
37%
Italy
313
12%
2713
40%
Spain
313
12%
2624
46%
Czech Republic
281
25%
1135
39%
Belgium
234
7%
3490
50%
Romania
172
32%
541
40%
Poland
109
11%
991
50%
Netherlands
63
1%
4367
41%
USA
563
15%
3690
33%
Australia
313
7%
4564***
44%

^ Median spend on Christmas presents converted from Euro to AUD. Currency conversion based on exchange rate as at 18 October 2015
* Source – Eurostat. For the year 2014, average net earnings for countries other than Romania and Australia; converted from Euro to AUD based on exchange rate as at 18 October 2015
** Source – Eurostat. For the year 2013, average net earnings – Romania
***Source – Australian Bureau of Statistics, for the year 2013-14 . Currency conversion – Bloomberg rates 31 December 2014

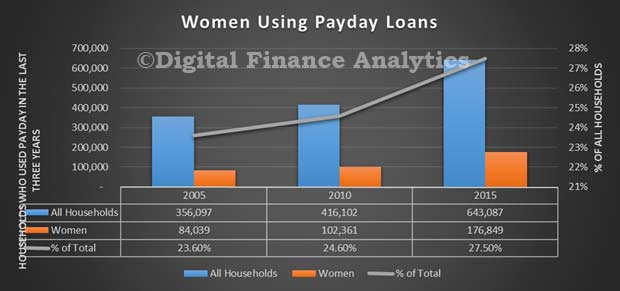
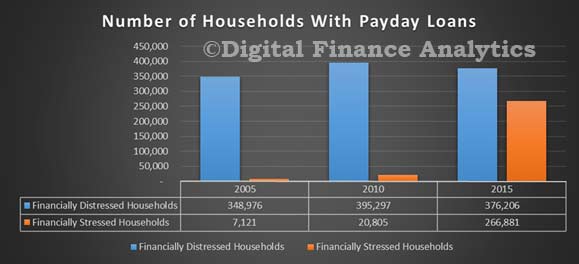
Review Of Small Amount Credit Contract Interim Review Released

On 7 August 2015, the Government announced a review of the small amount credit contract laws contained in the National Consumer Credit Protection Act 2009 (the Credit Act) and comparable consumer leases.

The Government asked the Review Panel (the Panel) to examine and report on the effectiveness of the law relating to small amount credit contracts (SACCs), and to make recommendations on whether any of the provisions which apply to small amount credit contracts should be extended to consumer leases.

The interim report, just released, sets out the Panel’s initial observations in key areas and canvasses potential policy options. The interim report does not make recommendations nor does it provide the final view of the Panel.

Observation 1 One of the key outcomes of regulation in the financial sector should be the facilitation of consumers onto a path of financial inclusion rather than exclusion.

Observation 2 The responsible lending obligations do not appear sufficient to prevent financial harm to consumers who use SACCs. Additional consumer protection specific to SACCs seems to be required. ASIC enforcement of the responsible lending practices of SACC providers should be a priority.

Observation 3 High levels of repeat borrowing appear to be causing consumers financial harm. The structure of the SACC cap and industry costs appears to promote repeat borrowing and the rebuttable presumptions do not appear to have limited repeat borrowing.

Observation 4 The limit on the amount that a SACC provider can recover in the event of default is an important safeguard for consumers. However, in some circumstances, the fees charged on default appear to be charged in a manner that significantly disadvantages vulnerable consumers.

Observation 5 Some SACC providers do not appear to be giving consumers any benefit or discount when they make early repayments or pay back the loan in full before the due date. These practices may result from the SACC cap being based on a fee, rather than an interest rate.

Observation 6 The high cost of consumer leases appears to be causing consumers financial harm. While there are technical differences between credit contracts and consumer leases, these differences do not appear to justify consumer leases being excluded from the consumer protection regulations that apply to other forms of finance under the Credit Act.

Observation 7 During consultation, stakeholders noted that a large proportion of the cost of consumer leases can be attributed to add on products. There is little transparency regarding the nature or cost of these services and the value that they provide to consumers. It may not be clear to consumers that these features are available when they enter into a lease, or that they extend beyond the statutory guarantee under the Australian Consumer Law.

Observation 8 If a cap were to be introduced on a restricted category of consumer lease, it should be designed in a way that limits the risk of avoidance. Although extending a cap to all leases and broadening the scope of the Credit Act to include indefinite term leases are matters outside the terms of reference of the review, government may wish to consider the implications for those leases outside the scope of this review.

The interim report is an opportunity for stakeholders to comment on the observations and options presented including whether they would be workable in practice and if one option is likely to be more effective than another. This is an opportunity for stakeholders to provide additional data and evidence to support alternative views. Further views are sought, along with cost/benefit analyses, on these observations and options.

The responses to the interim report will be used, in addition to the submissions and feedback already received, to formulate final recommendations.

Submissions are requested by 22 January 2016


The Capital Schmozzle

“schmozzle (plural schmozzles). (informal) A disorganized mess; (informal) A melee”.

When the FSI inquiry was handed down last year, with recommendations mostly later accepted by Government, a cornerstone was to avoid the risk of a failing bank needing to be bailed out by tax payers, as happened in a number of countries during the GFC.

A year later, we can look back to see significant changes to the current capital rules for “Advanced” banks (those that use their own approved internal models) and significant capital raisings of more than $30bn by the industry. This has translated into higher interest rates on mortgages, especially investment property loans.

Currently underway are discussions about the next iteration of the capital rules, with the expectations that “Advanced” banks’ rules will be tightened, and the rules for other banks will get more complex, with capital ratios being determined for example by the loan-to-value (LVR) of loans, as well as differentiation between loans serviced by income, and those materially serviced by rental income flows.

APRA last week said they would look to encourage more banks to move towards the “Advanced” methods, with a series of potential interim steps, at the time when the rules are under review. They also said that the current counter cyclical buffer would be set to zero.

Five Australian Banks have “Advanced” capital management, and a number of other banks are already on the journey to “Advanced” capital methods; but it is a complex and twisted path, and the destination is not yet clear. Better data, models and systems are required to meet the necessary hurdles.

What is likely though is that the journey to hold more capital is far from over, whether “Advanced” or “Standard”, and that the light between the two systems is closing, as the “Standard” system gets more complex, and the “Advanced” ratios are lifted higher.

We think that there will be only limited upside to be gained from moving to “Advanced”, as the gap closes, and complexity increases in the standard approach. We also think significant further capital will be required – some are suggesting an additional $30-40bn in the next couple of years, enough to force mortgage prices across the board significantly higher again. As these adjustments are essentially across the board, to a greater or lesser extent, we doubt that smaller players will actually get much differential benefit. Indeed, if investment mortgages require higher capital still. (that depends on the definition of what is “material” – yet to be made clear; and the LVR), some banks could need much more capital than is currently assumed.
It is also worth noting that spreads on overseas bank capital raisings are rising, indeed, spreads are wider now across the market, as we noted last week.

So what is the potential impact of lifting capital ratios? We already mentioned the uplift in mortgage rates, as banks seek to cover the additional costs involved. Households should expect to pay more. Shareholders may also have to take a haircut in future returns, as the economics of banks change. The super profits banks have enjoyed may be trimmed a little.

But a recent paper from the Bank of England has also highlighted that lifting capital may not reduce systemic risks much. The study, a working paper “Capital requirements, risk shifting and the mortgage market” looked at what happened when capital ratios were lifted. They found that whilst the average value of a loan made fell a little, there was no reduction in higher risk lending, despite the requirements for higher capital, because the lender was looking to protect overall margins and still chose to take more risks. If this is true, higher capital requirements does not necessarily reduced systemic risks. Banks may still need Government support in a crisis.

But wait, was that not the whole reason for lifting capital ratios in the first place? Looks like a schmozzle to me!


Fed Warns On Commercial Real Estate Lending

US Banks are increasing their exposure to commercial real estate and increased competitive pressures are contributing significantly to historically low capitalization rates and rising property values.  Influenced in part by the continuing strong demand for such credit and the reassuring trends in asset-quality metrics many institutions’ CRE concentration levels have been rising.

A CRE loan refers to a loan where the use of funds is to acquire, develop, construct, improve, or refinance real property and where the primary source of repayment is the sale of the real property or the revenues from third-party rent or lease payments. CRE loans do not include ordinary business loans and lines of credit in which real estate is taken as collateral. Financial institutions with concentrations in owner-occupied CRE loans also should implement appropriate risk management processes.

Between 2011 and 2015, multi-family loans at insured depository institutions increased 45 percent and comprised 17 percent of all CRE loans held by financial institutions, and prices for multi-family properties rose to record levels while capitalization rates fell to record lows. At the same time, other indicators of CRE market conditions (such as vacancy and absorption rates) and portfolio asset quality indicators (such as non-performing loan and charge-off rates) do not currently indicate weaknesses in the quality of CRE portfolios.

During 2016, supervisors from the banking agencies will continue to pay special attention to potential risks associated with CRE lending.

The regualtors have  jointly issued a statement to remind financial institutions of existing regulatory guidance on prudent risk management practices for commercial real estate (CRE) lending activity through economic cycles. They say that historical evidence demonstrates that financial institutions with weak risk management and high CRE credit concentrations are exposed to a greater risk of loss and failure. In general, financial institutions that succeeded during difficult economic cycles took the following actions, which are consistent with supervisory expectations:

  1. established adequate and appropriate loan policies, underwriting standards, credit risk management practices, and concentration limits that were approved by the board or a designated committee; lending strategies, such as plans to increase lending in a particular market or property type, limits for credit and other asset concentrations, and processes for assessing whether lending strategies and policies continued to be appropriate in light of changing market conditions; and  strategies to ensure capital adequacy and allowance for loan losses that supported an institution’s lending strategy and were consistent with the level and nature of inherent risk in the CRE portfolio.
  2. conducted global cash flow analyses based on reasonable (not speculative) rental rates, sales projections, and operating expenses to ensure the borrower had sufficient repayment capacity to service all loan obligations.
  3. performed market and scenario analyses of their CRE loan portfolio to quantify the potential impact of changing economic conditions on asset quality, earnings, and capital.
  4. provided their boards and management with information to assess whether the lending strategy and policies continued to be appropriate in light of changes in market conditions.
  5. assessed the ongoing ability of the borrower and the project to service all debt as loans converted from interest-only to amortizing payments or during periods of rising interest rates.
  6. implemented procedures to monitor the potential volatility in the supply and demand for lots, retail and office space, and multi-family units during business cycles.
  7. maintained management information systems that provided the board and management with sufficient information to identify, measure, monitor, and manage concentration risk.
  8. implemented processes for reviewing appraisal reports for sufficient information to support an appropriate market value conclusion based on reasonable market rental rates, absorption periods, and expenses.

BIS Updates Guidance On Credit Loss Risk and Accounting

The Bank for International Settlements has released a document which sets out supervisory guidance on sound credit risk practices associated with the implementation and ongoing application of expected credit loss (ECL) accounting frameworks. The move to ECL accounting frameworks by accounting standard setters is an important step forward in resolving the weakness identified during the recent financial crisis that credit loss recognition was too little, too late. It is also consistent with the April 2009 call by G20 Leaders for accounting standard setters to “strengthen accounting recognition of loan loss provisions by incorporating a broader range of credit information”.

This guidance, which should be viewed as complementary to the accounting standards, presents the Committee’s view of the appropriate application of ECL accounting standards. It provides banks with supervisory guidance on how the ECL accounting model should interact with a bank’s overall credit risk practices and regulatory framework, but does not set out regulatory capital requirements on expected loss provisioning under the Basel capital framework.

The failure to identify and recognise increases in credit risk in a timely manner can aggravate underlying weaknesses in credit quality, adversely affect bank capital adequacy, and hinder appropriate risk assessment and control of a bank’s credit risk exposure. The bank risk management function’s involvement in the assessment and measurement of accounting ECL is essential to ensuring adequate allowances in accordance with the applicable accounting framework.

Supervisory guidance for credit risk and accounting for expected credit losses

  • A bank’s board of directors (or equivalent) and senior management are responsible for ensuring that the bank has appropriate credit risk practices, including an effective system of internal control, to consistently determine adequate allowances in accordance with the bank’s stated policies and procedures, the applicable accounting framework and relevant supervisory guidance.
  • A bank should adopt, document and adhere to sound methodologies that address policies, procedures and controls for assessing and measuring credit risk on all lending exposures. The measurement of allowances should build upon those robust methodologies and result in the appropriate and timely recognition of expected credit losses in accordance with the applicable accounting framework.
  • A bank should have a credit risk rating process in place to appropriately group lending exposures on the basis of shared credit risk characteristics.
  • A bank’s aggregate amount of allowances, regardless of whether allowance components are determined on a collective or an individual basis, should be adequate and consistent with the objectives of the applicable accounting framework.
  • A bank should have policies and procedures in place to appropriately validate models used to assess and measure expected credit losses.
  • A bank’s use of experienced credit judgment, especially in the robust consideration of reasonable and supportable forward-looking information, including macroeconomic factors, is essential to the assessment and measurement of expected credit losses.
  • A bank should have a sound credit risk assessment and measurement process that provides it with a strong basis for common systems, tools and data to assess credit risk and to account for expected credit losses.
  • A bank’s public disclosures should promote transparency and comparability by providing timely, relevant and decision-useful information.

Supervisory evaluation of credit risk practices, accounting for expected credit losses and capital adequacy

  • Banking supervisors should periodically evaluate the effectiveness of a bank’s credit risk practices.
  • Banking supervisors should be satisfied that the methods employed by a bank to determine accounting allowances lead to an appropriate measurement of expected credit losses in accordance with the applicable accounting framework.
  • Banking supervisors should consider a bank’s credit risk practices when assessing a bank’s capital adequacy

In June 2006, the Basel Committee issued supervisory guidance on Sound credit risk assessment and valuation for loans to address how common data and processes may be used for credit risk assessment, accounting and capital adequacy purposes and to highlight provisioning concepts that are consistent in prudential and accounting frameworks. This document replaces the Committee’s previous guidance.

Wide Spreads May Block Future Rate Hikes

According to Moody’s the Fed’s first rate hike in more than nine years occurred in the context of a wider than 700 bp spread for high-yield bonds. This is noteworthy from corporate credit’s perspective. Never before in the modern era of the speculative-grade has bond market had the Fed hiked rates when the high-yield bond spread was wider than 625 bp.

Going forward, if the high-yield spread remains wider than 650 bp, the Fed may opt not to hike rates at the March 2016 meeting of the FOMC. Moreover, if the spread averages more than 700 bp during the next three months, a weakening of credit conditions may force the Fed to reconsider its current strategy.

Moreover, current outlooks for defaults and profits weaken the case in favor of a percentage point climb by fed funds over the next 12 months. Following the recessions of 2001 and 1990-1991, the Fed began to hike rates in June 2004 and February 1994. The latter two starts to a series of Fed rate hikes were accompanied by declining trends for the high-yield default rate and lively profits growth.
After dipping by a prospective -0.2% annually in 2015, the Blue Chip consensus projects a below-trend 4% rebound by 2016’s pretax profits from current production. An acceleration of labor costs vis-a-vis business sales may squeeze margins considerably in 2016.

The sharp ascent by the average EDF (expected default frequency) metric of US/Canadian below-investment-grade companies from December 2014’s 3.2% to a recent 6.7% highlights the worsened outlook for high-yield defaults.
Nevertheless, a fast rising high-yield EDF metric does not necessarily rule out another Fed rate hike. For example, fed funds was lifted from May 1999’s 4.75% to May 2000’s 6.50% notwithstanding an ominously elevated average high-yield EDF metric of 7.9%, whose then rising trend could be inferred from its average yearly increase of a full percentage point. However, it should be added that by January 2001 the Fed was forced to quickly slash fed funds to 5.5%. Yet the latter was not enough to prevent March 2001’s arrival of a recession.

But this time the Fed may not be indifferent to a worsening default outlook. Today’s macro backdrop compares unfavorably with that of 1999 and early 2000. The 4.5% annual surge by real GDP during the year-ended Q1-2000 towers over the 2.5% growth expected of real GDP for 2015 and 2016.

In addition, the labor market was much tighter according to how payroll employment’s 62.3% share of the working-age population was much greater than the recent 56.7%. Further, unlike the 3.7% year-over-year increase by the average hourly wage for the 12-months-ended March 2000, the average wage now rises by a much slower 2.3%. Thus, it’s doubtful that policymakers will shrug off another extended stay by the high-yield EDF metric of 6.5% or greater. Unless credit conditions improve, the current series of prospective rate hikes may be cut short.

Moody's-ChartContrary to conventional wisdom, the yield spreads over Treasuries of investment- and speculative-grade bonds are highly correlated. For a sample beginning with July 1991 and ending in November 2015, the high-yield bond spread shows surprisingly strong correlations with Moody’s long-term industrial company bond yield spreads of 0.93 for Baa-grade bonds and 0.90 for single-A-rated securities.

SME Deposits and Basel

APRA has today written to ADIs about best practices in assessing SME deposits accounts. Essentially, in a recent review of 14 institutions, they found significant inconsistencies, based on how individual ADI’s were choosing to flag balances as a “stable deposit”, whether the customer was in a “stable relationship” with the ADI, and which types of account – especially internet based account should be considered “less stable deposits”. In addition “heavily rate driven deposits” need to be correctly classified.

This complexity is a result of the Basel Committee who  introduced a globally harmonised liquidity framework by developing two minimum standards with the objective of promoting short-term and long-term resilience. The Liquidity Coverage Ratio (LCR) and the Net Stable Funding Ratio (NSFR) were developed to fulfil these objectives and to also enable regulators and investors to make meaningful comparisons between banks. APRA’s expectation is that ADIs with similar business models, balance sheets and customer groups would generate similar cash outflows under the LCR.

The net effect may well be to change the relative attractiveness of rates offered by banks, especially for call deposits offered on line, as they will cost the banks more. On the other hand, deposits, held as part of a longer relationship, with notice periods attached could become more attractive.

Finally, APRA noted that few ADIs benchmarked their offered rates against rates offered by peer competitors for the purposes of this classification and suggests that such benchmarking would constitute good practice.

DFA looked at SME savings balances in our recent report. SME’s have deposits in total worth more than $107bn. The distribution of deposits varies with size. Nearly half is held by the largest firms, and holdings decrease as we look across the smaller-sized firms. The average savings balance varies also between firms which are credit avoiders, and those who are not.


Major Banks’ Shareholders Highly Leveraged; Profits $37bn, Up 10%

The recently released APRA quarterly banking performance statistics to September 2015 tells an interesting story. We have charted data for the major Australian banks which shows continued housing loan growth, and considerable lifts in the capital ratios in 2015.

However, looking directly at the ratio of gross advances to share capital (ignoring reserves and other factors), we still see the shareholders are highly leveraged, at 4.9% (up from a recent all-time low of 4.7% in June). This is a function of having an ever greater share of home loans in the portfolio, (with lower risk weights). It shows how reliant the banks are on expanding their mortgage books (so directly linked to rising house prices etc.).

Major-Banks-Financals-Sept-2015More broadly, looking at all the ADI’s, on a consolidated group basis, there were 159 firms operating in Australia. The net profit after tax for all ADIs was $37.0 billion for the year ending 30 September 2015. This is an increase of $3.5 billion (10.3 per cent) on the year ending 30 September 2014.

The return on equity for all ADIs was 14.1 per cent for the year ending 30 September 2015, compared to 14.2 per cent for the year ending 30 September 201.

The total assets for all ADIs was $4.58 trillion at 30 September 2015. This is an increase of $420.9 billion (10.1 per cent) on 30 September 2014.

The total gross loans and advances for all ADIs was $2.91 trillion as at 30 September 2015. This is an increase of $237.7 billion (8.9 per cent) on 30 September 2014.

The total capital ratio for all ADIs was 13.7 per cent at 30 September 2015, an increase from 12.4 per cent on 30 September 2014.

The common equity tier 1 ratio for all ADIs was 10.1 per cent at 30 September 2015, an increase from 9.2 per cent on 30 September 2014.

The risk-weighted assets (RWA) for all ADIs was $1.86 trillion at 30 September 2015, an increase of $157.0 billion (9.2 per cent) on 30 September 2014.

Impaired facilities and past due items as a proportion of gross loans and advances was 0.87 per cent at 30 September 2015, a decrease from 1.09 per cent at 30 September 2014. Specific provisions as a proportion of gross loans and advances was 0.22 per cent at 30 September 2015, a decrease from 0.28 per cent at 30 September 2014.