ANZ Launches Australia’s first Home Loan Centre

ANZ today continued its expansion in NSW opening Australia’s first dedicated Home Loan Centre. Located at Westfield in Parramatta, the centre will provide customers with a specialist service to improve the process of obtaining a home loan.

ANZ Managing Director Retail Distribution Australia Catriona Noble said: “We understand that buying a house is usually the single biggest investment people make and we want to remove some of the stress associated with organising a home loan.

“By creating a dedicated space for home loans, customers will have access to a team of specialists in an environment not usually associated with a bank. We’ve designed this to look and feel like a typical home and we’re confident this will resonate strongly with our customers.

“Our two Home Loan Centres in New Zealand have been incredibly successful helping thousands of New Zealanders into a new home since late 2014. We expect our centre in Western Sydney to be equally well received,” Ms Noble said.


BIS Capital Proposals Revised Again, LVR’s and Investment Loans Significantly Impacted

The second consultative document on Revisions to the Standardised Approach for credit risk has been released for discussion.

There are a number of significant changes to residential property risk calculations . These guidelines will eventually become part of “Basel III/IV”, and will apply to banks not using their internal assessments (which are also being reviewed separately).

First, risk will be assessed by loan to value ratios, with higher LVR’s having higher risk weights. Second, investment property will have a separate a higher set of LVR related risk-weights. Third, debt servicing ratios will not directly be used for risk weights, but will still figure in the underwriting assessments.

There are also tweaks to loans to SME’s.

These proposals differ in several ways from an initial set of proposals published by the Committee in December 2014. That earlier proposal set out an approach that removed all references to external credit ratings and assigned risk weights based on a limited number of alternative risk drivers. Respondents to the first consultative document expressed concerns, suggesting that the complete removal of references to ratings was unnecessary and undesirable. The Committee has decided to reintroduce the use of ratings, in a non-mechanistic manner, for exposures to banks and corporates. The revised proposal also includes alternative approaches for jurisdictions that do not allow the use of external ratings for regulatory purposes.

The proposed risk weighting of real estate loans has also been modified, with the loan-to-value ratio as the main risk driver. The Committee has decided not to use a debt service coverage ratio as a risk driver given the challenges of defining and calibrating a global measure that can be consistently applied across jurisdictions. The Committee instead proposes requiring the assessment of a borrower’s ability to pay as a key underwriting criterion. It also proposes to categorise all exposures related to real estate, including specialised lending exposures, under the same asset class, and apply higher risk weights to real estate exposures where repayment is materially dependent on the cash flows generated by the property securing the exposure.

This consultative document also includes proposals for exposures to multilateral development banks, retail and defaulted exposures, and off-balance sheet items.The credit risk standardised approach treatment for sovereigns, central banks and public sector entities are not within the scope of these proposals. The Committee is considering these exposures as part of a broader and holistic review of sovereign-related risks.

Comments on the proposals should be made by Friday 11 March 2016.

Looking in more detail at the property-related proposals, the following risk weights will be applied to loans against real property:

  • which are finished properties
  • covered by a legal mortgage
  • with a valid claim over the property in case of default
  • where the borrower has proven ability to repay – including defined DSR’s
  • with a prudent valuation (and in a falling market, a revised valuation), to derive a valid LVR
  • all documentation held

If all criteria a met the following risk weights are proposed.

BIS-Dec-12-01
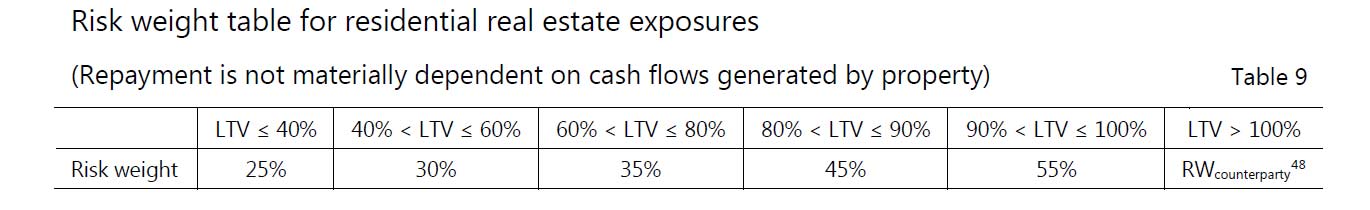
For residential real estate exposures to individuals with an LTV ratio higher than 100% the risk weight applied will be 75%. For residential real estate exposures to SMEs with an LTV ratio higher than 100% the risk weight applied will be 85%. If criteria are not met, then 150% will apply.

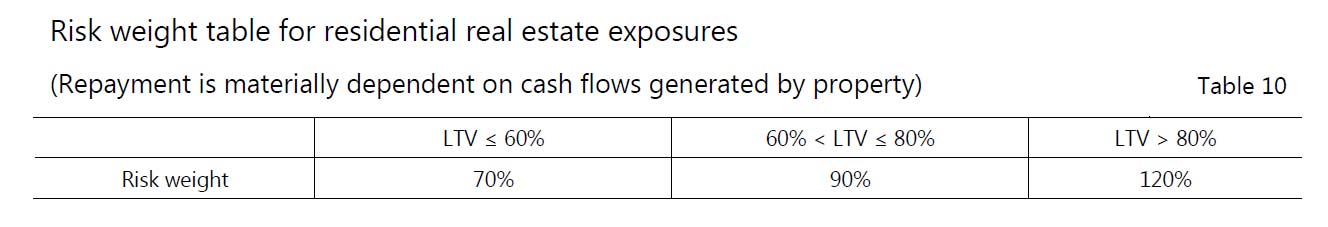
Turning to investment property, where cash flow from the property is the primary source of income to service the loan

BIS-Sec-12-02
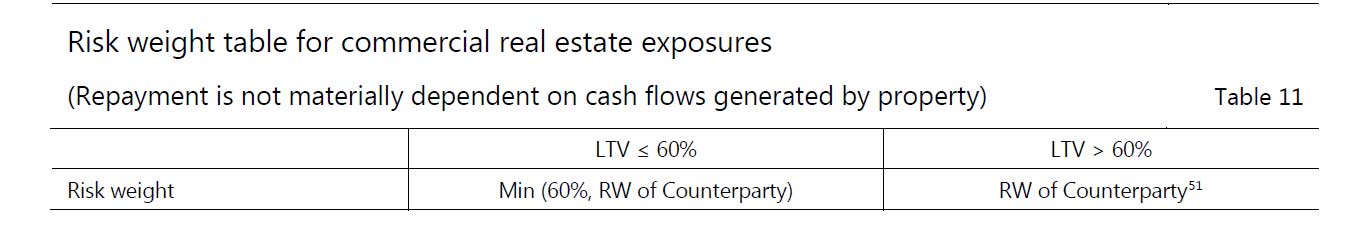
Commercial property will have different ratios, based on counter party risk weight.

BIS-Dec-12-03 
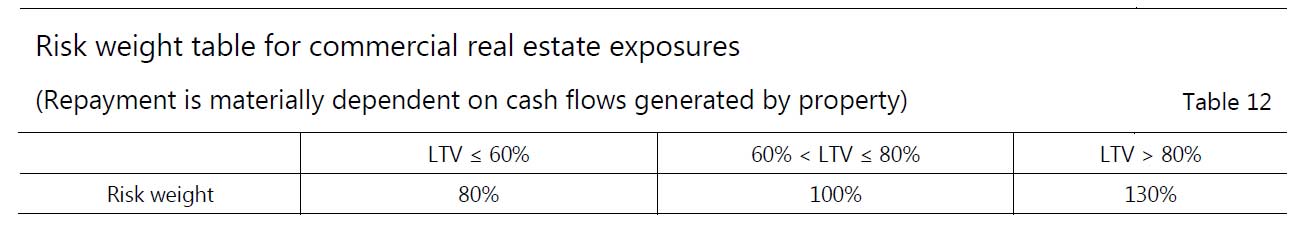
But again, those properties serviced by cash flow have higher weightings.

BIS-Dec-15-04Development projects will be rated at 150%.

Bearing in mind that residential property today has a standard weight of 35%, it is clear that more capital will be required for high LVR and investment loans. As a result, if these proposals were to be adopted, then borrowers can expect to pay more for investment loans, and higher LVR loans.

It will also increase the burden of compliance on banks, and this will  likely increase underwriting costs. Finally, whilst ongoing data on DSR will not be required, there is still a need to market-to-market in a falling market to ensure the LVR’s are up to date. This means, that if property valuations fall significantly, higher risk weights will start to apply, the further they fall, the larger the risk weights.

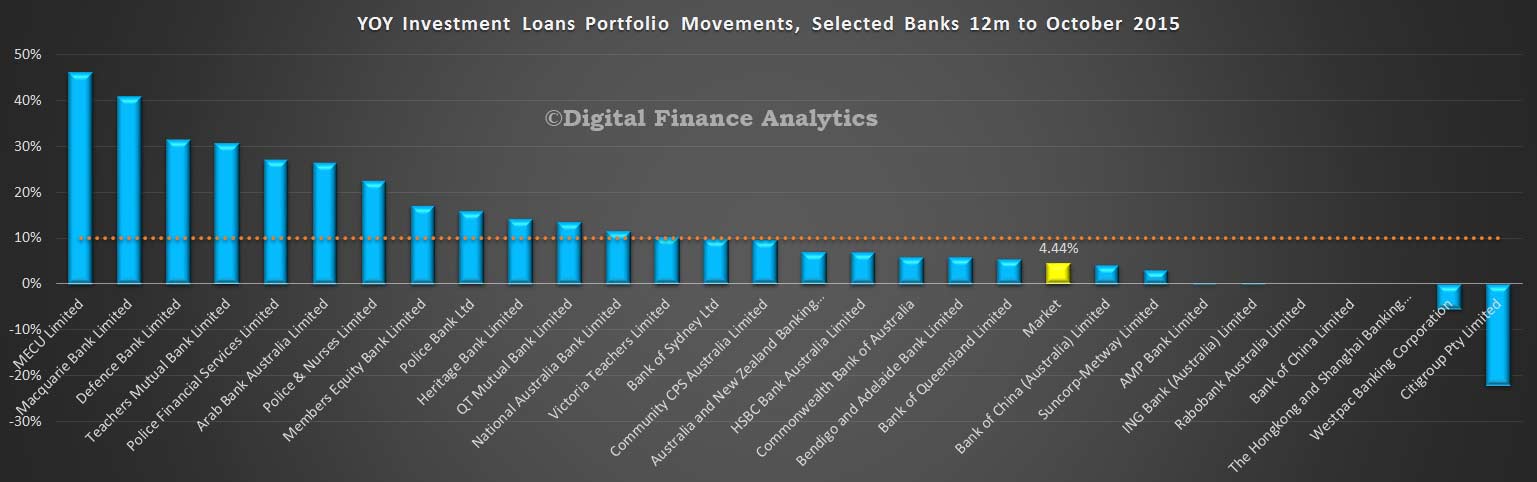
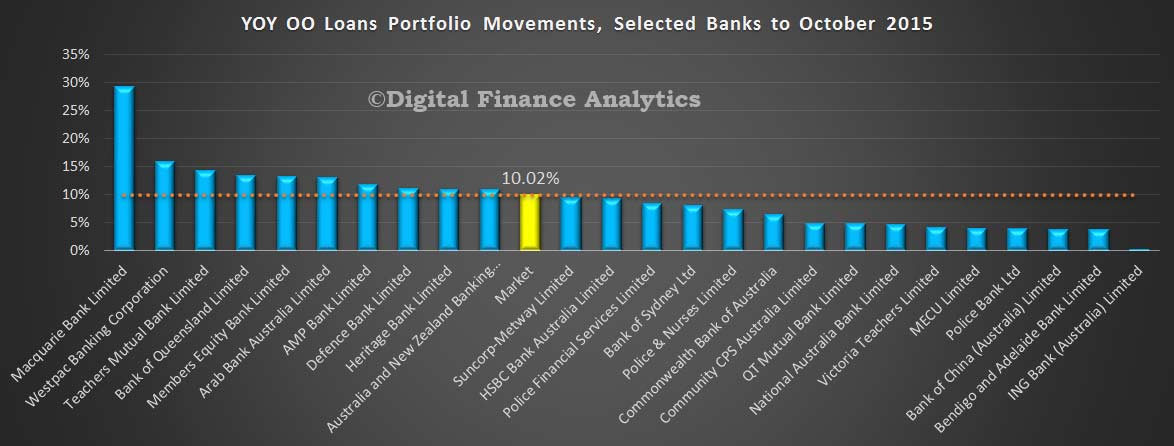
Finally, it continues the divergence between the relative risks of investment and owner occupied loans, the former demanding more capital, thus increasing the differential pricing of investment loans.

The Committee notes that the SA is a global minimum standard and that it is not possible to take into account all national characteristics in a simple approach. As such, national supervisors should require a more conservative treatment if they consider it necessary to reflect jurisdictional specificities. Furthermore, the SA is a methodology for calculating minimum risk-based capital requirements and should in no way be seen as a substitute for prudent risk management by banks.

Now, some will argue that in Australia, this will not impact the market much, as the major banks use their own internal models, however, as these are under review (with the intent of closing the gap somewhat with the standard methods used by the smaller players) expect the standard models to inform potential changes in the IRB set. Also, it is not clear yet whether banks who use lenders mortgage insurance for loans above 80% will be protected from the higher capital bands, though we suspect they may not. Non-bank lenders may well benefit as they are not caught by the rules, although capital market pricing may well change, and impact them at a second order level. We will be interested to see how local regulators handle the situation where an investment loan is partly serviced by income from rentals, and partly from direct income, which rules should apply – how will “materially dependent” be interpreted?


ACCC takes action against Woolworths for alleged unconscionable conduct

The Australian Competition and Consumer Commission has instituted proceedings in the Federal Court against Woolworths Limited, alleging it engaged in unconscionable conduct in dealings with a large number of its supermarket suppliers, in contravention of the Australian Consumer Law.

The ACCC alleges that in December 2014, Woolworths developed a strategy, approved by senior management, to urgently reduce Woolworths’ expected significant half year gross profit shortfall by 31 December 2014.

It is alleged that one of the ways Woolworths sought to reduce its expected profit shortfall was to design a scheme, referred to as “Mind the Gap”. It is alleged that under the scheme, Woolworths systematically sought to obtain payments from a group of 821 “Tier B” suppliers to its supermarket business.

The ACCC alleges that, in accordance with the Mind the Gap scheme, Woolworths’ category managers and buyers contacted a large number of the Tier B suppliers and asked for Mind the Gap payments from those suppliers for amounts which included payments that ranged from $4,291 to $1.4 million, to “support” Woolworths. Not agreeing to a payment would be seen as not “supporting” Woolworths.

The ACCC also alleges that these requests were made in circumstances where Woolworths was in a substantially stronger bargaining position than the suppliers, did not have a pre-existing contractual entitlement to seek the payments, and either knew it did not have or was indifferent to whether it had a legitimate basis for requesting a Mind the Gap payment from every targeted Tier B supplier.

The ACCC alleges that Woolworths sought approximately $60.2 million in Mind the Gap payments from the Tier B suppliers, expecting that while many suppliers would refuse to make a payment, some suppliers would agree. It is alleged that Woolworths ultimately captured approximately $18.1 million from these suppliers.

“The ACCC alleges that Woolworths’ conduct in requesting the Mind the Gap payments was unconscionable in all the circumstances,” ACCC Chairman Rod Sims said.

“A common concern raised by suppliers relates to arbitrary claims for payments outside of trading terms by major supermarket retailers. It is difficult for suppliers to plan and budget for the operation of their businesses if they are subject to such ad hoc requests.”

“The alleged conduct by Woolworths came to the ACCC’s attention around the time when there was considerable publicity about the impending resolution of the ACCC’s Federal Court proceedings against Coles Supermarkets for engaging in unconscionable conduct against its suppliers,” Mr Sims said.

“Of course, the allegations against Woolworths are separate and distinct from the Coles case.”

The ACCC is seeking injunctions, including an order requiring the full refund of the amounts paid by suppliers under the Mind the Gap scheme, a pecuniary penalty, a declaration, and costs.

These proceedings follow broader investigations by the ACCC into allegations that supermarket suppliers were being treated inappropriately by the major supermarket chains.

No Change in UK Bank Capital Plans Following Stress Tests

Fitch Rating. says that after its latest stress tests, the Bank of England’s (BoE) assessment is that the UK banking sector is adequately capitalised and the results will not force any capital planning revisions. Further sector-wide capital step-ups are unlikely in future.

Capital ratios are likely to remain stable, held up by the BoE’s increased use of countercyclical buffers. These will be built up as lending growth accelerates and will be released when the cycle turns. The BoE’s intention is that banks’ capital planning should become more efficient and flexible. The BoE’s Financial Policy Committee indicated that it considers a Tier 1 capital adequacy ratio of 11% to be appropriate for the sector. Fitch expect banks to set their internal buffers relative to this level and plan their capital needs relative to the level of sensitivity to stress test inputs.

Results from yesterday’s stress test show that, under the baseline scenario, the seven participating banks are improving their capital positions. But the Royal Bank of Scotland Group (RBS; BBB+/Stable) and Standard Chartered (A+/Negative) did not meet the BoE’s capital requirements under the stress scenario. Both banks have taken, or are taking steps this year to address capitalisation.

The regulator will use future stress test results to assess individual banks’ capital requirements. Fitch expects the tests to become more sophisticated and more qualitative in nature. This is already the case in the US where the Federal Reserve’s annual Comprehensive Capital Analysis and Review plays an important role in how the country’s leading banks assess their capital planning exercises.

In the UK, annual cyclical tests will be run to capture risks from financial cycles, with the severity of scenarios increasing as risks build up. This should produce more rounded stressed results. Latent risks not captured by the annual cyclical scenario will be introduced every other year when the BoE will run a biannual stress test. Fitch thinks the banks should, over time, be able to anticipate broad movements in the annual cyclical scenario, making it easier for them to set internal buffers above minimum regulatory requirements, based on their expected sensitivity to the regulatory stress test.

The 2015 stress test hurdles – a 4.5% common equity tier 1 (CET1) ratio and a 3% leverage ratio – were not particularly onerous. All participating banks met these. But hurdle rates will evolve and banks will need to meet their Pillar 1 minimum CET1 ratios under stressed scenarios, plus any additional requirements set by the regulators under Pillar 2A and buffers for systemically important banks.

ACCC authorises system to facilitate credit reporting

The Australian Competition and Consumer Commission has granted authorisation for five years to the Australian Retail Credit Association Ltd (ARCA) in relation to principles for exchanging comprehensive consumer credit data between signatory credit reporting bodies and lenders.

ARCA represents lenders and credit reporting bodies in Australia and has developed the principles in a process involving its members and industry since July 2013. This follows reforms to the Privacy Act which expand the type of consumer credit information that can now be shared.

The ACCC received a large number of submissions from industry in response to the application and its draft determination, with general support for the principles.

“Access to more consumer credit information will allow lenders to make better credit decisions, with resulting benefits for consumers in the form of greater financial inclusion for consumers and assisting to reduce consumer over-indebtedness,” ACCC Deputy Chair Delia Rickard said.

“This will lead to increased competition between credit reporting bodies and between lenders, and assist lenders to comply with their responsible lending obligations at less cost.”

The ACCC has considered a concern raised that some provisions are unduly prescriptive and will impose costs on smaller credit providers who wish to have an agreement with more than one credit reporting body. Also consumer advocacy bodies want to include provisions about recording repayments under financial hardship arrangements.

“The ACCC accepts that there are some potential public detriments arising from the costs imposed by the provisions. However, these costs appear to be relatively small and offset by the cost savings and other benefits of these provisions,” Ms Rickard said.

“Each credit provider will make a commercial decision whether or not to provide data and consume data from multiple credit reporting bodies.”

“ARCA is working to resolve the issues around reporting of financial hardship arrangements, and will need to involve industry and relevant regulators. The ACCC will be keen to see this matter resolved in assessing any application for re-authorisation.”

Authorisation provides statutory protection from court action for conduct that might otherwise raise concerns under the competition provisions of the Competition and Consumer Act 2010. Broadly, the ACCC may grant an authorisation when it is satisfied that the public benefit from the conduct outweighs any public detriment.

More information about the application for authorisation is available at Australian Retail Credit Association Ltd Authorisation A91482

IMF Updates Global and National Housing Outlook, Australian Property Overvalued

In the latest release, the IMF have provided data to October 2015, and also some specific analysis of the Australian housing market. We think they are overoptimistic about the local scene, and we explain why.

But first, according to the IMF, globally, house prices continue a slow recovery. The Global House Price Index, an equally weighted average of real house prices in nearly 60 countries, inched up slowly during the past two years but has not yet returned to pre-crisis levels.

chart1_As noted in previous quarterly reports, the overall index conceals divergent patterns: over the past year, house prices rose in two-thirds of the countries included in the index and fell in the other one-third.

house prices around the world_071814Credit growth has been strong in many countries. As noted in July’s quarterly report, house prices and credit growth have gone hand-in-hand over the past five years. However, credit growth is not the only predictor for the extent of house price growth; several other factors appear to be at play.

house prices around the world_071814For OECD countries, house prices have grown faster than incomes and rents in almost half of the countries.

chart2_House price-to income and house price-to-rent ratios are highly correlated, as documented in the previous quarterly report.

chart2_ Turning to the Australia specific analysis, Adil Mohommad, Dan Nyberg, and Alex Pitt (all at the IMF) argue that house prices are moderately stronger than consistent with current economic fundamentals, but less than a comparison to historical or international averages would suggest. Here is just a summary of their arguments, the full report is available.

Argument: House prices have risen faster in Australia than in most other countries, suggesting, ceteris paribus, overvaluation.

OZ-House-Prices-to-GDPCounter argument 1: House prices are in line on an absolute basis – Price-to-income ratios have risen in Australia and now near historic highs. However, international comparisons suggest that Australia is broadly in line with comparator countries, although significant data comparability issues make inference difficult.
Counter argument 2: The equilibrium level of house prices has also risen sharply – Lower nominal and real interest rates and financial liberalization are key contributors to the strong increases in house prices over the past two decades. The various house price modeling approaches indicate that house prices are moderately stronger (in the range of 4-19 percent) than economic fundamentals would suggest.
Counter argument 3: High prices reflect low supply – Housing supply does indeed seem to have grown significantly slower than demand, reducing (but not eliminating) concerns about overvaluation.
Counter argument 4: It is just a Sydney problem, not a national one – The two most populous cities, Sydney and Melbourne, have seen strong house price increases, including in the investor segment. A sharp downturn in the housing market in these cities could be expected to have real sector spillovers, pointing to the need for targeted measures—including investor lending—to reduce risks from a housing downturn.
Counter argument 5: There are no signs of weakening lending standards or speculation – While lending standards overall seem not to have loosened, the growing share of investor and interest-only loans in the highly-buoyant Sydney market, is a pocket of concern.
Counter argument 6: Even if they are overvalued, it doesn’t matter as banks can withstand a big fall – While bank capital levels are likely sufficient to keep them solvent in the event of a major fall in house prices, they are not enough to prevent banks making an already extremely difficult macroeconomic situation worse.

Let us think about each in turn.

Thus, DFA concludes the IMF initial statement is correct, and despite their detailed analysis, their counterarguments are not convincing. We do have a problem.

No Change to the RBA Cash Rate

At its meeting today, the Board decided to leave the cash rate unchanged at 2.0 per cent.

The global economy is expanding at a moderate pace, with some softening in conditions in the Asian region, continuing US growth and a recovery in Europe. Key commodity prices are much lower than a year ago, reflecting increased supply, including from Australia, as well as weaker demand. Australia’s terms of trade are falling.

The Federal Reserve is expected to start increasing its policy rate over the period ahead, but some other major central banks are continuing to ease monetary policy. Volatility in financial markets has abated somewhat for the moment. While credit costs for some emerging market countries remain higher than a year ago, global financial conditions overall remain very accommodative.

In Australia, the available information suggests that moderate expansion in the economy continues in the face of a large decline in capital spending in the mining sector. While GDP growth has been somewhat below longer-term averages for some time, business surveys suggest a gradual improvement in conditions in non-mining sectors over the past year. This has been accompanied by stronger growth in employment and a steady rate of unemployment.

Inflation is low and should remain so, with the economy likely to have a degree of spare capacity for some time yet. Inflation is forecast to be consistent with the target over the next one to two years.

In such circumstances, monetary policy needs to be accommodative. Low interest rates are acting to support borrowing and spending. While the recent changes to some lending rates for housing will reduce this support slightly, overall conditions are still quite accommodative. Credit growth has increased a little over recent months, with credit provided by intermediaries to businesses picking up. Growth in lending to investors in the housing market has eased. Supervisory measures are helping to contain risks that may arise from the housing market.

The pace of growth in dwelling prices has moderated in Melbourne and Sydney over recent months and has remained mostly subdued in other cities. In other asset markets, prices for commercial property have been supported by lower long-term interest rates, while equity prices have moved in parallel with developments in global markets. The Australian dollar is adjusting to the significant declines in key commodity prices.

At today’s meeting the Board again judged that the prospects for an improvement in economic conditions had firmed a little over recent months and that leaving the cash rate unchanged was appropriate. Members also observed that the outlook for inflation may afford scope for further easing of policy, should that be appropriate to lend support to demand. The Board will continue to assess the outlook, and hence whether the current stance of policy will most effectively foster sustainable growth and inflation consistent with the target.


RateSetter sees monumental growth from broker channel

From Australian Broker Online.

Leading peer-to-peer (P2P) lender RateSetter has seen significant growth in broker referrals, with almost one third (30%) of its business now coming through the third party channel.

Speaking to Australian Broker, the chief executive of RateSetter, Daniel Foggo, said that the broker channel is an important avenue of growth for the P2P lender, which specialises in providing personal loans, and he expects business referred through brokers to make up around half of its business volumes in the next year.

“We have 50 brokerage firms referring applicants to us, which reflects around 50 different brokers. They are now referring about 30% of our business volumes to us – so it is quite significant and we see it as an avenue of significant growth for us,” Foggo said.

“We identified [engaging with brokers] quite early on as an opportunity for a broker to provide another service to their customers in a very light touch way. About a year ago we initiated some conversations with brokers about the opportunity. That percentage keeps growing so we expect it to be up around 50% in a year or so.”

There are different referral models a broker can use when referring a client to RateSetter, according to Foggo, depending on how ‘hands-on’ the broker wants to be.

“The first model is very simple for the broker, they literally just send a web link to their customer and the customer thereafter fills out an application form and the broker is kept entirely up to date as to how that application is progressing,” Foggo told Australian Broker.

“The broker is also provided a portal where they can log on anytime to see the status of any application and how much money they have actually made through referring people to us.

“The next model is slightly more hands on the for the broker and in less than a minute they can actually perform a rate estimate for the customer which basically requires them to provide a name and address and some brief details and we will give the applicant an indicative loan rate and it is up to the broker then whether they proceed with the application themselves on behalf of the customer or whether the customer does it directly.”

But whilst RateSetter is seeing significant growth from the broker channel, Foggo told Australian Broker that there is still a common misconception that P2P lenders pose a threat to the market.

“I think, generally, there is a perception that P2P lenders might be a threat over time, but really, we definitely see them as being an opportunity for brokers to broaden out their offering. We don’t think [P2P lenders] are ever going to disrupt their core brokerage market of residential property but we might be able to complement it with personal loans and other areas. It really just adds another strength to the bow of the broker.”


Banks Continue the Mortgage Lending Party In A Fog

The latest data form APRA on the banks (ADI’s) portfolios for October 2015 tells us a little, but much is lost in the fog of adjustments which continue to afflict the dataset. In fact, APRA now points to the “corrected” numbers which the RBA publish.

Some banks have reclassified housing loans that originated as investment loans to owner-occupied based on a review of customers’ circumstances or as advised by customers. See the Monthly Banking Statistics Important Notice for more information. These reclassifications will affect growth rates for investment and owner-occupied housing loans for October 2015. Questions about specific data should be directed to the relevant bank.

The Reserve Bank of Australia publishes industry-level housing loan growth rates in Growth in Selected Financial Aggregates. Table D1 in particular contains investment and owner-occupied loan growth rates, which have been adjusted for these reclassifications. Table D1 is available on the RBA website athttp://www.rba.gov.au/statistics/tables/index.html”

The RBA data shows that investment loans are probably growing a little below 10%, and owner occupied loans at about 6%.

RBA-HL-Growth-D1-Oct-2015The monthly banking stats do not contain these adjustments, so cannot be directly reconciled. However, some interesting points are worth noting nevertheless. First is that total lending for housing rose by 7.5 bn to 1.4 trillion in the month. The RBA lending figure for the whole market (including the non-banks) was 1.5 trillion.  This is another record.  Investment lending sits at 37% on these numbers.  Net movements for OO loans was up 2.73%, whilst investment loans fell 2.95%.

Beyond that, if we take the APRA data at face value, then Westpac continues to reclassify loans. In the monthly movements we see more than $15bn swung into the owner occupied category, with an adjustment to the investment side of the ledger. There were smaller movements in the other banks, but some of this looks like further adjustments.

APRA-MBS-Oct-2015-1So the current market shares are revised to:

APRA-MBS-Oct-2015-2In our modelling of the monthly movements, based on the APRA data, where we sum the monthly movements for the past year (and include adjustments where we can), it appears Westpac is now in negative territory for investment loans, and that the growth rates for the other majors is slowing. The imputed annual market movement is 4.4% against the RBA data above of just under 10%.

APRA-MBS-Oct-2015-4For completeness we also show the owner occupied movements. These too are impacted by reclassifications, and the imputed growth rate is 10%, compared with 6% from the RBA.

APRA-MBS-Oct-2015-3 The net effect of all this is that there is no true information about what individual banks are doing in their loan portfolios. Having tried to talk to a couple of them to clarify the story, I discover they are not willing to share additional data and refer back to the [flawed] APRA data.

The convenient “fog of war” will continue for some time to come. There is also no way to cross-check the RBA adjusted data, and no underlying detailed explanations. We are just supposed to trust them!


Housing Lending Up Again In October to $1.5 trillion.

The latest RBA credit aggregates for October 2015, released today are not easy to interpret because of the myriad of adjustments.   Housing loans have more reached $1.5 trillion, another record.  But are these numbers trust-worthy?

At the aggregate level, total credit rose a seasonally adjusted 0.61% in the month, or 6.11% in the past year. Lending to business grew 0.84% in the month, and 5.88% in the last year. Business lending as a proportion of all lending sits at 33.2%, from an all-time low of 32.9% in July, but clearly business investment continues to be constrained. Housing grew 0.58% in the month, and 7% in the past year, whilst personal credit fell 0.89% in the month and 0.27% in the year, a sign that households remain cautious.

Credit-Aggregates-Oct-2015Turning to housing finance in more detail, and this is where it get complex; lending for owner occupied loans rose 2.62% in the month, representing 9.41% growth in the past year, while investment lending fell 2.8% in the month, and grew 3.03% in the year. But there are so many adjustments in these numbers, as the banks reclassify more loans, thanks to a combination of internal review, and customer request. Specifically, the differential movement in investment loans is making people check their loans are correctly classified, and RBA estimates $30bn of loans have been switched. Investor loans on book comprise 36.35% of all housing, down from its recent heights of 38.55% in July. The only thing we can be sure of is the numbers will move again next month. I discussed the recent RBA comments on this issue recently.

Housing-Aggregates-Oct-2015The RBA makes the following caveats:

All growth rates for the financial aggregates are seasonally adjusted, and adjusted for the effects of breaks in the series as recorded in the notes to the tables listed below. Data for the levels of financial aggregates are not adjusted for series breaks. Historical levels and growth rates for the financial aggregates have been revised owing to the resubmission of data by some financial intermediaries, the re-estimation of seasonal factors and the incorporation of securitisation data. The RBA credit aggregates measure credit provided by financial institutions operating domestically. They do not capture cross-border or non-intermediated lending.

Following the introduction of an interest rate differential between loans to investors and owner-occupiers a number of borrowers have changed the purpose of their existing loan; the net value of switching of loan purpose from investor to owner-occupier is estimated to have been $30.6 billion over the period of July 2015 to October 2015. These changes are reflected in the level of owner-occupier and investor credit outstanding. However, growth rates for these series have been adjusted to remove the effect of loan purpose changes.

The APRA ADI data is also out today, and we will look at this later.