Home Lending More Risky – APRA

Wayne Byres, Chairman APRA, “Banking On Housing“, speech today, portrayed the current state of play with regards to supervision of housing lending.  He started by noting that housing lending now accounts for around 40 per cent of banking industry assets, and a little under two-thirds of the aggregate loan portfolio. With such a concentration in a single business line, we are all banking on housing lending remaining ‘as safe as houses’.

IMF-Home-LoansSupervision is important, he say’s given the high household debt involved. As with housing prices, these debt levels are at the higher end of the spectrum. Furthermore, after plateauing for much of the past decade, the household debt-to-income ratio has begun drifting upwards again. Households still have a significant (and growing) net worth, as housing assets are increasing in value faster than debt. Nevertheless, the trends in overall level of debt bear watching.Debt-to-IncomeHe acknowledges the change in mix of loans, with the growth of investor loans.

Turning to the composition of loan portfolios, a notable change has been the well-publicised growth in lending to investors. In terms of the outstanding stock of housing lending, investors account for more than one-third; of the current flow of approvals, investors now account for more than 40 per cent. For comparison, in the mid-1990’s both those proportions were around half today’s levels.

A key question is: does this compositional shift change portfolio risk profiles? Australian data suggests that there has been little difference in the propensity of investor loans to become impaired, vis-à-vis those to owner-occupiers. However, caution is needed given the lack of any period of severe household stress over the past two decades: evidence from other countries suggests we should be wary of extrapolating the current Australian experience into more stressful scenarios.

Of course, it is not just the nature of the borrower, but also the growth in lending, that acts as a warning sign for supervisors. When we wrote to ADIs in December 2014, we flagged a benchmark for investor lending growth of 10 per cent, or higher, as a sign of increased risk. We highlighted investor lending because it was an area of accelerating credit growth and strong competition: a combination in which the temptation to compete and protect market share could drive a weakening of credit standards. By moderating growth aspirations, we are reducing the tendency for ADIs to whittle away lending standards in the name of ‘matching our competitors’ – when it comes to lower standards, it’s always the other guy’s fault.

He highlighted the rising share of loans originated via brokers.

Third-PartyAnother feature of the home lending market has been the increasing use of third-party distribution channels. There are potentially significant advantages from such an approach: for example, allowing smaller lenders or new entrants to compete more readily against the established branch networks of the bigger players. On the other hand, third-party-originated loans tend to have a materially higher default rate compared to loans originated through proprietary channels. This does not mean third-party channels have lower underwriting standards, but simply that the new business that flows through these channels appears to be of higher risk, and must be managed with appropriate care.

He also described the rise in interest only loans, and changes in LVR ratios as highlighted in yesterdays APRA data, which we discussed in detail already.

Finally, he discussed lending standards.

The final layer of analysis has been our detailed review of lending standards at individual lenders. We published some conclusions from this in May,6 and highlighted a few areas where standards were not what they could or should be. Examples included, generous interpretations of the stability and reliability of borrowers’ incomes; borrowers assumed to have very meagre living expenses; and/or a reliance on interest rates not rising very much, or (more puzzlingly) rising on new debts but not existing ones.

ASIC’s recently announced review of interest-only home lending made similar findings.

The industry has responded with improved practices in the past few months. For example, it is now commonplace for lenders to apply a haircut to unstable sources of income, and to assume a minimum interest rate of around 7.25 per cent – well above rates currently being paid – when assessing a borrower’s ability to service a loan. These steps should give greater comfort about the quality of new business now being written.

However, a close eye will need to kept on policy overrides – in other words, the extent to which lenders approve loans outside their standard policy parameters. There are some definitional issues that mean care is needed with this data, but the rising trend for loans to be approved outside policy needs to be watched: as lenders strengthen their lending policies, it’s important to make sure this good intent isn’t being undone by an increasing number of policy exceptions.

OutsideServiceBefore I wrap up, I’d like to comment on the potential for further action by APRA, including targeted measures that, it has been suggested, we should employ to specifically respond to rising housing prices in Sydney and Melbourne. In response, I would make three points:

First, our mandate is to preserve the resilience of the banking system, not to influence prices in particular regions; second, the broader environmental factors I outlined at the start of my remarks – high housing prices, high debt levels, low interest rates and subdued income growth – are not present only in our two largest cities; and
third, sound lending standards – prudently estimating borrower income and expenses, and not assuming interest rates will stay low forever – are just as important (and maybe even more so) in an environment where price growth is subdued as they are in markets where prices are rising quickly.

That is not to say that geographic measures would never be contemplated. Parallels are often drawn with New Zealand, where specific measures have been directed at the rapid price appreciation in Auckland. In comparing the respective actions on both sides of the ditch, it’s important to note the Reserve Bank of New Zealand (RBNZ) initiated measures for Auckland only after first instituting a range of measures that applied New Zealand-wide. In other words, more targeted measures built on, rather than substituted for, measures to reduce financial stability risks nationally.

Given many changes to lenders’ policies, practices and pricing are still relatively recent, it is too early to say whether further action might be needed to preserve the resilience of the banking system. We remain open to taking additional steps if needed, but from my perspective the best outcome will be if lenders themselves maintain a healthy dose of common sense in their lending practices, and reduce the need for APRA to do more.


The Long-Term Evolution of House Prices: An International Perspective

Excellent speech from Lawrence Schembri, Deputy Governor, Canadian Association for Business Economics on house price trends. The speech, which is worth reading, contains a number of insightful charts. Australian data is included. He looks at both supply and demand issues, and touches on macroprudential.  You can watch the entire speech.

I have highlighted some of the main points:

First, Chart 1 shows indexes of real house prices since 1975 for two sets of advanced economies. Chart 1a shows Canada and a set of comparable small, open economies (Australia, New Zealand, Norway and Sweden) with similar macro policy frameworks and similar experiences during and after the global financial crisis. In particular, they did not have sizable post-crisis corrections in house prices. For comparison purposes, Chart 1b shows a second set of advanced economies that did experience significant and persistent post-crisis declines in house prices.

Real-House-PricesSince 1995, house prices in Canada and the set of comparable countries have increased faster than nominal personal disposable income (Chart 2a). During this period, all of these countries experienced solid income growth, with the strongest growth in Norway and Sweden (Chart 2b).

Price-to-IncomeDuring the global financial crisis, these countries also experienced house price corrections. This caused the ratios of house prices to income to decline temporarily, after which they continued climbing.

One of the factors that has affected population growth rates is migration. Net migration was highest in Australia and Canada over the entire sample. In addition, net migration increased importantly in all five countries in the second half of the sample period (Chart 3b)

population-GrowthIn Australia, Canada and New Zealand, the rate of population growth of the approximate house-owning cohort of those aged 25 to 75 declined in the second part of the sample period. This likely reflects the aging of their populations as the postwar baby boom generation moved from youth into middle age (Chart 4). Nonetheless, the growth rate of this cohort still remains well above 1 per cent for these three countries.

CohortsChart 9 provides some suggestive evidence on the impact of land-use regulations on median price-to-income ratios. Many of the cities with higher ratios also have obvious geographical constraints—Hong Kong and Vancouver are good examples—so the two sources of supply restrictions likely interact to put upward pressure on prices.SupplyWhen we look at the post-crisis experiences of the countries in our comparison group, they have similar levels of household leverage, measured by household debt as a ratio of GDP (Chart 12). Household leverage has risen along with house prices, as households have taken advantage of low post-crisis interest rates. The one exception is New Zealand, where a modest degree of household deleveraging seems to have occurred. For Canada, the ratio of household debt to GDP has risen since 1975, although the growth of this ratio has notably declined since 2010. For Sweden and Norway, the ratio also grew at a modest pace in the post-crisis period. Note Australia has the highest ratios.

LeverageCharts 13a and b draw on recent work by the IMF, which shows that macroprudential policies in the form of maximum loan-to-value (LTV) or debt-to-income (DTI) ratios have tightened across a broad range of countries over the past 10 years. The IMF’s research, as well as that of other economists, has found evidence suggesting that the tightening has helped to: reduce the procyclicality of household credit and bank leverage; moderate credit growth;
improve the creditworthiness of borrowers; and lower the rate of house price growth.

The most effective macroprudential policies to date appear to have been the imposition of maximum LTV and DTI constraints. Increased capital weights on bank holdings of mortgages have also had an impact. While long-term evidence on these instruments is not yet available, permanent measures that address structural regulatory weaknesses and that are relatively straightforward to implement and supervise will likely be the most effective over time.

MacroprudentialInteresting to note that in Canada, they have had four successive rounds of macroprudential tightening, primarily in terms of the rules for insured mortgages. The maximum amortization period for insured loans has been shortened from 40 years to 25. LTV ratios have been lowered to 95 per cent for new mortgages, and 80 per cent for refinancing and investor properties. These latter two changes effectively eliminate new insurance for refinancing and investor properties. Qualification criteria such as limits on the total debt-service ratio and the gross debt-service ratio, as well as requirements for qualifying interest rates, have also been tightened.

Conclusion

Let me conclude with a few key points from the mountain of facts, graphs and analysis that I have reviewed with you today. As I mentioned at the outset, the purpose of my presentation is to help provide more context for an informed discussion about housing and house prices given their importance to the Canadian economy and the financial system.

First, real house prices have been rising relative to income in Canada and other comparable countries for about 20 years. There are many possible explanations, mostly from the demand side, but also from the supply side.

Second, in terms of demand, demographic forces, notably migration and urbanization, have played a role in the evolution of house prices, as have improving credit conditions through lower global real long-term interest rates and financial liberalization and innovation. There are, of course, other demand factors that warrant more data and analysis, including the impacts of foreign investment and possible preference shifts.

Third, in terms of supply, the constraints imposed by geography and regulation have decreased housing supply elasticity, especially in urban areas. This reduced supply elasticity has interacted with demand shifts toward more urbanization to push up house prices in major cities.

Fourth, the credible and effective macro and financial policy frameworks in place in Canada and the other countries considered here have contributed to a high degree of macroeconomic and financial stability. Consequently, in the face of a protracted global recovery, their countercyclical policies successfully underpinned domestic demand in the post-crisis period. The resulting strength in the housing market has increased household imbalances, but the risks stemming from these vulnerabilities have been well managed by complementary macroprudential policies.

The experience in these countries therefore suggests that macroprudential policies that address structural weaknesses in the regulatory framework are best suited for mitigating such financial vulnerabilities. They reduce tail risks to financial stability and enhance the overall resilience of the financial system.

NAB Ups Value of Investment Loans Held

NAB has announced a reclassification of household data provided previously as part of its regulatory reporting obligations. The reclassification, similar to the recent ANZ announcement, has no impact on customers and does not alter risk weighted assets, regulatory capital, cash earnings, balance sheet or risk appetite. The announcement was released to the ASX, not via the NAB web site or media releases.

The data being restated covers the period from July 2014 to June 2015. The main movements are:

  • Restatement of owner occupied housing from $165.4bn to 126.5bn
  • Restatement of investment housing from $66.6bn to $93bn
  • Restatement of non-housing from $11.5bn to $23.7bn

We have run an update to our APRA loan model which shows that the market for investment loans grew at a revised 11.16% (compared with the APRA 10% “speed limit”) and we estimate that NAB grew its investment portfolio by 13.79%, well above the hurdle.

NAB-Adjusted-Investment-LoansThese reporting adjustments make us question the accuracy of the reporting processes. We would observe that as a result of the banks adjustments the value of investment loans are higher, but the growth trajectory is similar to previously calculated, provided the one-off adjustments are run back through the full year.


ADI Property Exposures to June 2015 – Up and Away!

APRA released their latest quarterly ADI property exposure data today. The publication contains information on ADIs’ commercial property exposures, residential property exposures and new housing loan approvals. Detailed statistics on residential property exposures and new housing loan approvals are included for ADIs with greater than $1 billion in housing loans.

ADIs’ commercial property exposures were $233.7 billion, an increase of $9.9 billion (4.4 per cent) over the year to 30 June 2015. Commercial property exposures within Australia were $194.0 billion, equivalent to 83.0 per cent of all commercial property exposures.

ADIs’ total domestic housing loans were $1.3 trillion, an increase of $97.1 billion (7.9 per cent) over the year. There were 5.4 million housing loans outstanding with an average balance of $243,000.

ADIs with greater than $1 billion in housing loans approved $96.0 billion of new loans, an increase of $10.5 billion (12.2 per cent) on the quarter ending 30 June 2014. Of these new loan approvals, $55.1 billion (57.4 per cent) were owner-occupied loans and $41.0 billion (42.6 per cent) were investment loans.

Looking at the housing related data in detail, we see major banks wrote about 80% of all home loans, other banks had about 13% of the market, the rest covered by building societies, credit unions and foreign banks.

APRA-June2015-NewLoansByMixLooking at the relative value of loans, major banks still have the lion’s share, and we see the continued growth in investment lending

APRA-June2015-NewLoansByValueLooking at the LVR’s of new loans, we see that major banks have upped the proportion in the 60-80% range, and there is a slight reduction in loans over 90%. Clearly lending criteria have been tightened.

APRA-June2015-NewLoansLVRMajorBanksBuilding societies are writing more than 10% of loans over 90%, significantly more than credit unions.

APRA-June2015-NewLoansLVRBuildingSocieties APRA-June2015-NewLoansLVRCreditUnionsOther banks (excluding majors) also dialled back higher LVR loans but grew then past quarter and also grew their relative mix of 60-80% LVR loans.

APRA-June2015-NewLoansLVROtherBanksForeign banks new high LVR loans fell. Once again we see growth in the 60-80% LVR range.

APRA-June2015-NewLoansLVRForeognBanks

New investment loans grew with the majors (ANZ reclassified loans in the quarter), other banks investment loans fell slightly

APRA-June2015-NewInvestmentLoansThere was significant growth in interest only loans, foreign banks were strongly up.

APRA-June2015-NewInterestOnlyLoansOverall about 46% of all new loans were written via third party channels. We see the majors continuing to grow their broker origination, whilst credit unions and foreign banks use of brokers fell.

APRA-June2015-NewThirdPartyLoansOverall, the proportion of out of serviceability criteria fell, but overall about 4% of new loans were approved outside normal criteria.

APRA-June2015-NewOutsideServicabilityLoansLoans with offset facilities continued to rise, with credit unions leading the way.

APRA-June2015-OffsetLoansFinally, low documentation loans continue to languish.

APRA-June2015-LowDocLoansByMix

Who Benefits from High House Prices?

Most would accept that house prices in the major Australian centres are too high. Whether you use a measure of price to income, loan value to income, or price to GDP; they are all above long term trends. Indeed, in Sydney and Melbourne, they are arguably more than 30% higher than they should be. The latest DFA Video Blog discusses the issue and identifies the winners and losers, together with a transcript.

Ultra-low interest rates currently make large loans affordable for many households, yet overall household debt is as high as it has ever been and mortgage stress, even at these low interest rates is quite high. Banking regulators are concerned about systemic risks from overgenerous underwriting criteria and they have been lifting capital ratios to try to improve financial stability, with a focus on the fast growing investment sector. In many countries around the world, house prices are also high, so from New Zealand to UK, regulators are taking steps to try limit systemic risks. These rises are partly being driven by global movements of capital, ultra-low interest rates and quantitative easing.

However, let’s think about who benefits from high and rising prices. First anyone who currently holds property (and that is two-thirds of all households in Australia) will like the on-paper capital gains. This flows through to becoming an important element in building future wealth. In addition, refinancing is up currently, and we see some households crystalising some of the on-paper gains for holidays, a new car or other purposes, stimulating retail activity. A recent RBA research paper, suggests that low-income households have a higher propensity to purchase a new vehicle following a rise in housing wealth than high-income households.

Those holding investment property also enjoy tax-concessions on interest and other costs; and on capital appreciation. Rising wealth generally supports the feel-good factor, and consumer confidence – though currently this is a bit wonky.

Higher values stimulates more transactions, which creates more momentum.

Now, the one-third of households who are not property active, consist of those renting and those living with family, friends or in other arrangements. Their confidence levels are lower and they are not gaining from rising house prices. A relatively small proportion of these are actively seeking to buy, and they are finding the gradient becoming ever more challenging, as saving for a deposit is becoming harder, lending criteria are tightening and income growth is slowing. We have noted previously that a rising number of first time buyers have switched directly to the investment sector to get into the market. Generally younger households are yet to get on the housing escalator, whilst older generations have clearly benefited from sustained house price growth. This has the potential to become a significant inter-generational issue.

But overall, the wealth effect of rising property is an umbrella which spreads widely. The sheer weight of numbers indicates that there are more winners than losers. No surprise then that many politicians will seek to bathe in the reflected glory of rising values, whilst paying lip-service to housing affordability issues.

There are other winners too. For states where property stamp-duty exists, the larger the transaction value and volume, the higher the income. For example, in NSW, in January and February nearly $1bn was added to coffers thanks to this tax and the state is well on track to achieve the $6.1 billion of stamp duty forecast in the 2014-15 budget papers. The higher the price the larger the income. The tax-take funds locally provided services so ultimately residents benefit.

The banks also benefit because rising house prices gives them the capacity to lend larger loans (which in turn allows house prices to run higher again). They have benefited from relatively benign capital requirements and funding, thus growing their balance sheet and shareholder returns. Whilst recent returns have been pretty impressive, future returns may be lower thanks to changes in capital ratios and especially if housing lending moderates. On the other hand, their appetite to lend to productive business and commercial sectors is tempered by higher risks and more demanding capital requirements. The relative priority of debt to housing as opposed to productive lending to business is an important issue and whilst higher house prices can flow through to real economic growth, it is mostly illusory.

Finally, building companies can benefit from land banks they hold, and development projects, despite high local authority charges. We also note that some banks are now winding back their willingness to lend to the construction industry (because of potentially rising risks). The real estate sector of course benefits, thanks to high transaction volumes and larger commissions. Mortgage brokers also enjoy volume and transaction related income. Even retailers with a focus on home furnishings and fittings are buoyant.

So standing back, almost everyone appears to benefit from higher prices. But is it really a free-kick? Well, for as long as the music continues to play, it almost is. The question becomes what happens if (or when) prices were to fall (remember that during the GFC, northern hemisphere prices fell in some places up to 40%, though since then prices in the US, Ireland and the UK have started to recover). Given our exposure to housing, there would be profound impacts on households, banks and the broader economy if values fell significantly.

But underlying all this, we have moved away from seeing housing as something which provides shelter and somewhere to live; to seeing it as just another investment asset class. This is probably an irreversible process, and part of the “financialisation” of society, given the perceived benefits to the economy and households, but we question whether the consequences are fully understood.

RBNZ – Investor LVR limits to reduce financial system risk

The Reserve Bank New Zealand expects new lending limits for Auckland property investors will reduce heightened financial system risk, and help moderate the Auckland housing market cycle, Deputy Governor Grant Spencer said today.

Speaking to the Northern Club in Auckland, Mr Spencer said that the resurgence in Auckland house prices over the past year has increased the Bank’s concerns about financial stability risks.

Mr Spencer said that Auckland prices have risen a further 24 percent over the past year, compared to 3 percent for the rest of the country.

“This has stretched the price-to-income ratio for the Auckland region to 9, double the ratio for the rest of New Zealand, and places Auckland among the world’s most expensive cities.

“New housing supply has been growing, but nowhere near fast enough to make a dent in the existing housing shortage. In the meantime, net migration is at record levels, and investors continue to expand their influence in the Auckland market.”

Mr Spencer said that investors are now accounting for 41 percent of Auckland house purchases, up 8 percentage points since late 2013. “We have seen a particular increase in purchases by smaller investors and investors reliant on credit. Half of the new lending to investors is being written at loan-to-value ratios of over 70 percent.

“This trend is increasing the risk inherent in the Auckland market. The increasing investor presence is likely to amplify the housing cycle, and worsen the potential damage from a downturn, both to the financial system and the broader economy.”

Mr Spencer said that macro-prudential policy can assist in moderating the risks to the financial sector and broader economy associated with Auckland’s housing market.

“A sharp fall in house prices has the potential to accentuate weakness in the macro-economy, particularly if banks tighten lending conditions excessively, leading to greater declines in asset markets and larger loan losses for the banks. A key goal of macro-prudential policy is to ensure that the banking system maintains sufficient prudential buffers to avoid this sort of contractionary behaviour in a downturn.

“Modifications to the Reserve Bank’s LVR policy, announced in May, are targeted specifically at Auckland residential investors. The speed limit has been eased for the rest of the country where housing markets are not subject to the same pressures.”

Mr Spencer said that the Bank recognises that low interest rates are contributing to housing demand pressures, and this is a factor the Bank takes into consideration when setting monetary policy. “However, the current weakness in export prices, economic activity and CPI inflation means that interest rate increases are likely to be off the table for some time,” he said.

He noted that the Bank’s macro-prudential policy is one of many measures aimed at reducing the imbalances in the Auckland housing market.

“Much more rapid progress in producing new housing is needed in order to get on top of this issue. Tax policy is also an important driver, and we welcome the changes announced in the 2015 Budget, including the two year bright-line test, the proposed non-resident withholding tax and the requirement for tax numbers to be provided by house purchasers.”

Massive Capital Injection to Chinese Banks is Credit Positive – Moody’s

In a research note Moody’s says that last Tuesday, China’s official Xinhua News Agency reported that the People’s Bank of China (PBOC) had injected $48 billion of equity capital into China Development Bank Corporation and $45 billion into The Export-Import Bank of China (CEXIM).

The injections were made through Wutongshu Investment Platform Co. Ltd., an entity that invests China’s foreign currency reserves. The massive equity infusions are credit positive for CDB and CEXIM. CDB’s capital adequacy ratio rises to about 11.8% from 9.1% under Basel III at year-end 2014, while CEXIM’s capital adequacy ratio, which it does not disclose, rises significantly. The injections also add to both banks’ loss-absorption capacity. Against the backdrop of heightened asset-quality risks at domestic banks, we think the enhanced loss-absorption implies that regulators are likely to impose minimum capital requirements on the banks.

The capital infusions are consistent with the Chinese government’s goal to strengthen Chinese policy lenders’ capital positions. After the injections, both banks’ ratios of tangible common equity to tangible assets compare well with those of the rated Chinese large and national joint-stock commercial banks.

MoodyAug24-1In the past several years, CDB and CEXIM have taken on key roles as policy-driven banks in financing priority projects and supporting the growth of Chinese corporates expanding overseas. For 2013-14, CDB’s compound annual asset growth rate was 17.1% and CEXIM’s 23.2%, compared with an average 13.6% rate for the Chinese banking industry during the same period

MoodyAug24-2 The capital injections demonstrate the Chinese government’s strong commitment to support the two lenders, whose policy roles are increasingly important for stimulating domestic economic growth. CDB and CEXIM are likely to take on greater credit exposure and their lending may have a greater strategic rationale rather than an economic one. For instance, the additional capital should facilitate CDB and CEXIM financing of overseas projects that are part of China’s One Belt, One Road initiative to boost infrastructure and economic connectivity across Eurasia.

Our assumption of a very high level of government support for CDB and CEXIM’s reflects strong government backing to offset their greater risks, given the two banks’ strategic importance as agents of the Chinese government in the implementation of development initiatives.

Zombie loans and a £300bn cushion: inside the Bank of England rates dilemma

From The Conversation.

When the men and women of the committee which sets UK interest rates get together these days, they are dealing with a deceptively simple question. Rates will go up, but how far and how fast? Their answer will decide the fate of a fragile recovery.

The UK economy is getting back to normal. Output has overtaken its peak of 2007 and is growing at close to the average pre-crisis rate; unemployment is low, employment is increasing. Real wages and investment have finally begun to improve. There are even signs of a return to productivity growth.

You might well argue that the financial crisis was unnecessary; that the imposition of austerity meant that recovery was slower than it needed to be and that the burden of adjustment was unfairly shared. But notwithstanding this, the economy is recovering.

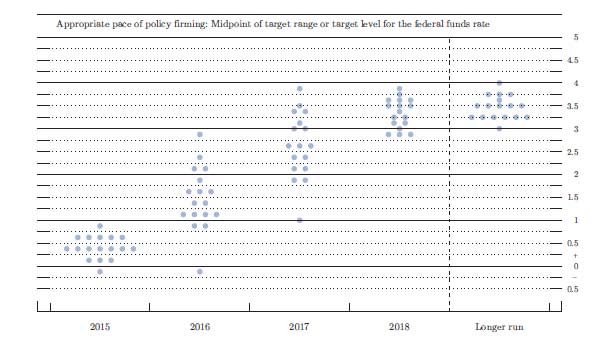
This means that interest rates also have to get back to normal. The most recent meeting of the Bank of England’s Monetary Policy Committee left things as they were – at a historic low of 0.5%, where it has remained since February 2008. It is both the lowest rate ever and the longest period without a change in rates. This cannot go on for much longer. We will get another rate decision on September 10 and even members of the committee who usually argue for lower rates, such as David Miles, are openly discussing the moment when the rate will start to rise.

Spent force?

But why do interest rates have to rise? Well, consider the choice between spending now or delaying expenditure into the future. In an economic downturn, the benefits of increasing spending in the present outweigh the costs of reducing it in the future. This is why low interest rates, which encourage spending right now, were a useful policy response to the financial crisis.

Notes and queries. How far and how fast? nataliej, CC BY-NC

But in more normal times, low interest rates encourage levels of expenditure which may exceed the productive capacity of the economy and so cause rising inflation. They may also lead to excessive borrowing and so risk another financial crisis. Higher interest rates, which encourage saving that can be channelled into productive investment, are then more appropriate.

So, if interest rates have to go up in order to manage the transition to another kind of economy, how quickly will they rise? Here, policymakers face two major risks. The first is within the banking system.

Risk factors

Banks are holding more than £300 billion in reserves at the Bank of England. This has been a useful cushion in turbulent times (reserves increased recently during the latest Greek crisis) but going forward, the economy needs banks to make loans rather than accumulate cash.

As a first step, the Bank of England has to stop paying interest on these reserves. This will encourage banks to run down reserves and increase lending. But reducing bank reserves by, say, £200 billion will increase lending by roughly £2 trillion (economists call this the “money multiplier”: historically the multiplier has been around 10). Doing this too quickly risks destabilising the economy. So this suggests we will see a modest and gradual increase in interest rates.

Zombies in our midst. The loans that bit back. Follow, CC BY-NC-ND

The second risk lies with households and firms. Low interest rates have enabled some individuals to stave off bankruptcy by managing to keep up loan repayments. This will no longer be possible once interest rates start to rise. These are the so-called “zombie loans” that stalk the economy, and no one knows how many of these are out there, or at which point in the interest rate cycle they will become a serious danger. Caution again suggest a modest and gradual increase until the scale of the problem becomes clearer.

Level up

Finally, let’s consider how high interest rates will eventually rise.

Policymakers have suggested that the pre-crisis average of 5% may be too high. Why? First, it is not clear how much of the damage caused by the financial crisis is permanent. If the economy has sustained serious damage to its productive capacity, interest rates will need to stay low for a protracted period, until investment has rebuilt capacity.

Second, it has been argued that there are now fewer investment opportunities than there were before the crisis, as the wave of productive investments opened up by the rapid spread of globalisation and new technology has ebbed away, robbing us of opportunities to generate growth and support a robust recovery. This “secular stagnation” hypothesis argues for lower interest rates into the future.

Of course, these arguments are all about successfully managing the recovery of the domestic economy – and we know only too well that external factors, such as US sub-prime mortgages, can have devastating effects across the world. It will be a useful by-product of the expected modest and gradual rate rises from the Bank of England that if and when the next crisis strikes from out of the blue, then there remains the room to bring rates straight back down again.

Author: Chris Martin, Professor of Economics at University of Bath

Mortgage Stressed Household Count In Melbourne

Continuing our series of the number of households experiencing mortgage stress by post code, today we look at Melbourne. Here is the geo-map showing the relative number of households in each post code district.  We have not shown this distribution before.

Current-Stress-Count-Melbourne

The areas with the highest count are listed below. Note the DFA segment distribution represented in each one. Whilst many are young families, or disadvantaged, many are more wealthy, and these have had access to larger loans, and more valuable property. But as a result they are more exposed, especially as incomes are static and costs are rising. Some are also getting squeezed by lower returns from savings and deposits with the banks.

Melbourne-Stress-CountWe will post Brisbane next time.

Battle Shifts Further Towards Owner Occupied Home Lending

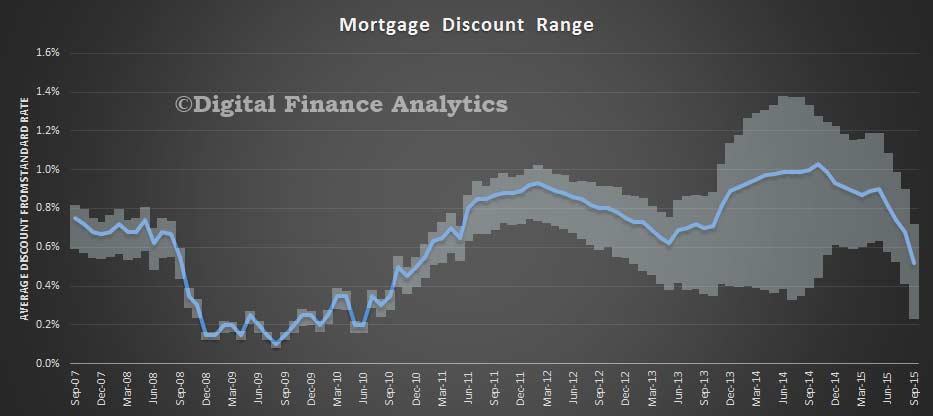
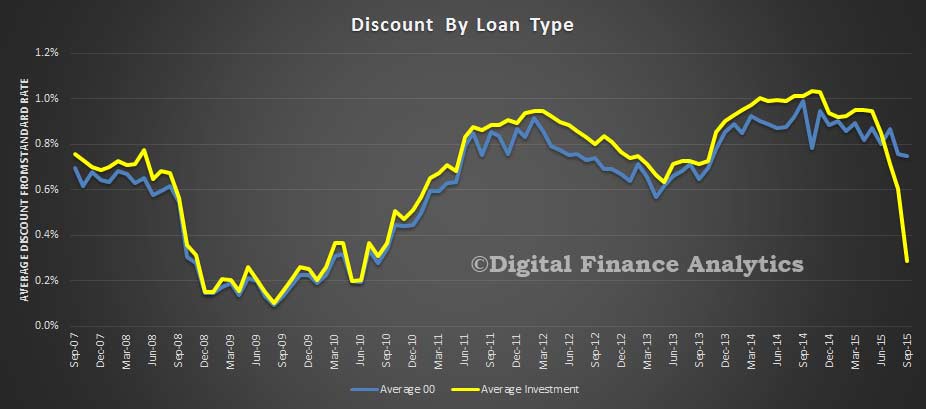
As we predicted, the banks have upped the ante on their owner occupied loans, for new customers, as the regulatory enforced slow-down on investment lending starts to bite. As well as hefty discounts, rebates are on offer, paid for by the hike in interest rates to new and existing investment loan borrowers. The changes to capital for advanced IRB banks, not due until next year, is a convenient alibi. The truth is, banks need the home lending fix to keep growing.

For example, according to Australian Broker:

A major bank has announced it will be running a home loan rebate campaign, which could save consumers over $1,000 on new owner-occupied loans.

From Monday 24 August, Westpac will be running its home loan rebate campaign to celebrate the popular Chinese Mid-Autumn Festival, which falls on Sunday 27th September.

As a part of this promotion, eligible customers will be entitled to receive a $1,088 rebate after applying for a new owner-occupied home loan with the major bank’s Premiere Advantage Package. Customers must receive conditional approval by Wednesday 30 September 2015.

The rebate figure of $1,088 was chosen because the number 8 is a lucky number in Chinese culture. According to Westpac, auction numbers on the 8th of August – the eighth day of the eighth month –were up 51% in Melbourne when compared to the same weekend last year.

With Chinese foreign buyers now accounting for about one in six new properties sold in NSW and VIC, Westpac general manager of third party distribution, Tony MacRae says this is an opportunity for the major bank to celebrate cultural diversity and the Australian Chinese community.

“Undoubtedly the Chinese community is the largest Asian migrant segment in Australia and we pride ourselves in supporting this key segment,” he said.

“Promoting cultural celebrations such as the Mid-Autumn Moon festival helps Westpac to deepen relationships with brokers supporting our Chinese and migrant customers.”