RBA Cash Rate Unchanged

At its meeting today, the Board decided to leave the cash rate unchanged at 2.0 per cent.

The global economy is expanding at a moderate pace, but some key commodity prices are much lower than a year ago. Much of this trend appears to reflect increased supply, including from Australia. Australia’s terms of trade are falling nonetheless.

The Federal Reserve is expected to start increasing its policy rate later this year, but some other major central banks are continuing to ease policy. Hence, global financial conditions remain very accommodative. Despite fluctuations in markets associated with the respective developments in China and Greece, long-term borrowing rates for most sovereigns and creditworthy private borrowers remain remarkably low.

In Australia, the available information suggests that the economy has continued to grow. While the rate of growth has been somewhat below longer-term averages, it has been associated with somewhat stronger growth of employment and a steady rate of unemployment over the past year. Overall, the economy is likely to be operating with a degree of spare capacity for some time yet. Recent information confirms that domestic inflationary pressures have been contained. That should remain the case for some time, given the very slow growth in labour costs. Inflation is thus forecast to remain consistent with the target over the next one to two years, even with a lower exchange rate.

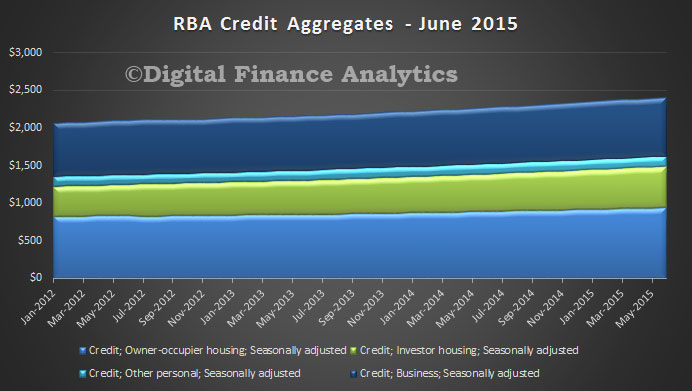
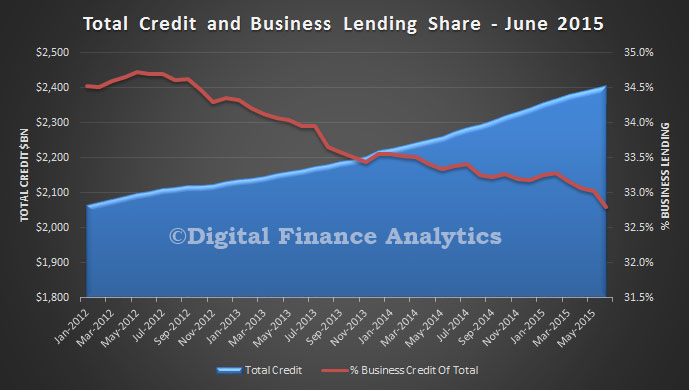
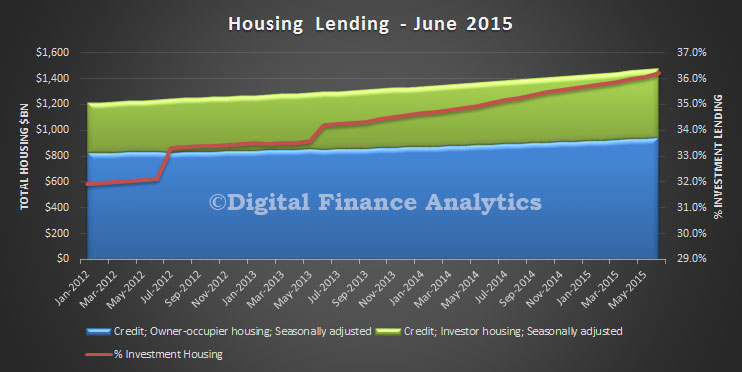
In such circumstances, monetary policy needs to be accommodative. Low interest rates are acting to support borrowing and spending. Credit is recording moderate growth overall, with growth in lending to the housing market broadly steady over recent months. Dwelling prices continue to rise strongly in Sydney, though trends have been more varied in a number of other cities. The Bank is working with other regulators to assess and contain risks that may arise from the housing market. In other asset markets, prices for equities and commercial property have been supported by lower long-term interest rates. The Australian dollar is adjusting to the significant declines in key commodity prices.

The Board today judged that leaving the cash rate unchanged was appropriate at this meeting. Further information on economic and financial conditions to be received over the period ahead will inform the Board’s ongoing assessment of the outlook and hence whether the current stance of policy will most effectively foster sustainable growth and inflation consistent with the target.

Suncorp and Bank of Queensland Join The Rate Rise Dance

More banks join the investment loans rate hike.

Suncorp increased its interest rates by up to 0.27% p.a. for standard variable and access equity (to 5.81% p.a.) and back to basics rates (to 5.23% p.a.) for new and existing investor loans, effective 31 August.

Bank of Queensland has lifted home investor loan rates by 0.29% effective August 10. It will have more impact on existing borrowers than new however because its “Clearpath” loans – with discount of more than 1 per cent on its variable rate – are unchanged. Most new mortgages are offered under this product, applicable to both owner occupied and investor loans and they have headroom to grow their book – allowing for the 10% speed limit on investor loans.


[Revised] APRA Data Shows Investment Growth Still Strong

Now we have the data from ANZ, we have revised the APRA data sets for the last year, to see the true position with regards to movements in the home loans portfolios. This post revises that made Friday, (though the data is correct based on the released APRA figures.

We have adjusted the ANZ and market total lines by the changes ANZ announced late Friday.  As a result, ADI market growth for investment loans is 10.95% (based on the total movements over the 12 months to June 2015). A number of players remain well above the 10% speed limit.

APRA-MBS-June2015-INVGrowthANZTweakThe next charts show the portfolio movements for both owner occupied and investment loans.

APRA-MBS-June2015-MonMovementANZTweakedFinally, here is the revised owner occupied loans data. Annual growth 6.17%. There is no 10% speed limit from the regulator, but we put the line in for comparison purposes.

APRA-MBS-June2015-OOGrowthANZTweak A final observation, the investment loan growth depends how you calculate it, and where you draw the numbers from. Our preferred approach is to take the growth each month, and add 12 months data together to make the 10.95%. The other approach is to take the data from June 2015, and compare it with July 2014. In that case the market growth is 10.6%. Some analysts gross up the last three months to give annualised rate of over 13%. The RBA data (which includes the non-banks) shows a 12 month growth rate of 10.4% (both original and seasonally adjusted) by summing the monthly changes, or 12.4% if you take the last 3 months data and annualise that. The conclusion is that investment loan growth rates were showing no signs of slowing to June. Lets see what happens in future months.  Also, consider this. APRA imposed the speed limit at 10%, but with no explanation why 10% was a good number. DFA is of the view that the hurdle rate should be significantly lower to have any meaningful impact.

ANZ Confirms Loan Reclassification

In a media release (via ASX), ANZ confirmed that they had reclassified data it provides to the regulators. It follows a review of data collection to align more closely management reporting and regulatory reporting.

This review included a reclassification of loan purposes across “owner occupied” and “investment housing”. ANZ says these changes do not impact ANZ’s investor lending growth targets. Their investment loan book was $83.5bn at 30 June 2015.

They say that the changes do not impact ANZ’s overall lending and deposit balances, risk weighted assets, regulatory capital or prior financial reporting disclosures and have no impact on customer facilities. We think this is because there are no differences in the current risk weightings between investment and owner occupied loans.

We identified the change in the APRA monthly banking statistics on Friday.


Credit Traps In A Financial Crisis

The Bank of England recently published a working paper “Bank leverage, credit traps and credit policies” which looks at why, following a financial crisis growth tends to stagnate for a long period and how macroprudential policy tools should be used both before and after a crisis.  They look at “credit traps” which arise when shocks to bank equity capital tighten banks’ borrowing constraints, causing them to allocate credit to easily collateralisable but low productivity projects. Low productivity weakens bank capital generation, reinforcing tight borrowing constraints, sustaining the credit trap steady state.

Financial crises tend to have severe negative effects on real activity, and recoveries following crises tend to be weak and slow. In Japan, for example, real GDP remained some 30 per cent below its pre-crisis trend 10 years after the onset of its financial sector distress in 1991. In the UK, the gap between realised real GDP and the level implied by the pre-crisis trend was around 20 per cent five years after the onset of the crisis in 2007. And in the USA, Japan, the UK and the euro-area, the rate of credit growth collapsed around the onset of the crises. In Japan, anaemic credit growth continued for at least a decade.

These consequences have triggered various policy responses. On the one hand, reform of financial regulation continues apace. Across jurisdictions, macroprudential policy authorities have been established and tasked with conducting system-wide prudential policy, including the use of countercyclical bank capital requirements. At the same time, central banks and governments have introduced a range of ‘unconventional’ monetary and credit policies, including asset purchases, policies to support bank funding, and recapitalisation of financial institutions. In light of these sweeping changes to the policy landscape, there is a real need to understand the mechanisms, costs and benefits of these interventions, and the conditions under which they can be effective. This paper enhances the understanding of such ‘credit policies’ – both ex-ante (to avoid credit crises), and ex-post (to escape their consequences) – by presenting a novel, tractable macroeconomic model to understand their effects.

We do this by constructing a simple overlapping generations model featuring financial intermediation and credit frictions, and use it to study the credit policies mentioned above. The key feature of our model that makes it particularly useful for studying these policies is its ability to generate a ‘credit trap’ steady state – that is, a steady state of the economy that features low real activity, low productivity, low bank capital, and weak bank profitability. In our model, the borrowing constraints facing banks depend on the health of the banking system: when the net worth of the banking system is low, banks’ ability to finance productive investment through borrowing is severely constrained. The economy enters a ‘credit trap’ when a large unanticipated shock to bank assets reduces bank capital below a critical threshold, causing banks’ funding conditions to tighten, inducing them to invest in less productive assets that, nonetheless, have higher pledgeability to creditors. Thus, even a temporary shock can have extremely persistent effects if it causes a large reduction in bank capital. And it is the possibility of entering a credit trap that has profound implications for policy that have not been examined by existing work in this area.

Concluding remarks
The recent financial crisis has raised the question of whether there is something fundamentally different about economic recovery following a severe financial crisis and, if so, how macroprudential policy tools should be used both before and after a crisis. Most modern macroeconomic models are unsuitable for addressing this question, with their economies quickly returning to health once a negative shock is unwound. In this context macroprudential policy tools play the role of reducing volatility, rather than avoiding a catastrophe or supporting the recovery from a crisis. By contrast, in this paper we explicitly consider a model in which the economy can become trapped in a steady state featuring permanently lower output, bank credit and productivity following a sufficiently severe financial shock, a confluence of characteristics we call a credit trap.

In this paper we have developed a simple, tractable OLG model for analysing credit traps. We have examined the effectiveness of policy both at preventing a credit trap occurring, and helping the economy to escape (which becomes necessary as it will not recover without intervention). Our analysis shows that a leverage ratio cap is effective in increasing the resilience of the economy against shocks and reducing the probability of a credit trap. However, this comes at the cost of lowering the level of output in the ‘good’ steady state, and hence the policymaker needs to set the cap to trade off these costs and benefits. Relaxing the leverage ratio cap is effective in encouraging faster recovery after a negative productivity shock, provided that the shock is sufficiently small. But if the shock is large enough to tip the economy into a credit trap, then relaxing the leverage ratio cap will not help the economy get out of it. To escape a credit trap other policies are needed, and we consider the efficacy of a set of ‘unconventional’ credit policies: direct lending; bank recapitalisation; and discount window lending. These policies present rich, realistic trade-offs which vary with their relative efficiency costs. Their effectiveness depends on the state of the economy, with all more effective when the economy is weaker.

In future work, it would be interesting to analyse more thoroughly the optimal leverage cap that would be set by a policymaker in advance of a trap. We have shown that the level of the leverage cap that maximises resilience is countercyclical: it would be interesting to analyse numerically if the optimal level of the leverage cap is too, and whether this would vary with the state of the economy in a non-linear way. This would be particularly interesting when the economy is just above the trap threshold, and the policymaker has to trade-off rebuilding the health of the banking system with the possibility of further negative shocks. .

Note: Staff Working Papers describe research in progress by the author(s) and are published to elicit comments and to further debate. Any views expressed are solely those of the author(s) and so cannot be taken to represent those of the Bank of England or to state Bank of England policy.

Westpac Follows The Herd On Mortgage Repricing

Westpac today announced an increase in interest rates for residential investment property loans, following the introduction of investor lending growth benchmarks set by APRA. They will lift the rates 27 basis points for Westpac brands, and 25 bps for the brands which sit under the St George umbrella, but sooner (21 August), versus 25 September for Westpac.

The standard variable interest rate on Westpac residential investment property loans for new customers will increase by 0.27% to 5.75%, effective 10 August 2015. For existing customers the increase will be effective 25 September, 2015. This timing is to ensure that there is a smooth transition to the differentiated rates structure for the mortgage portfolio.

Fixed rates on residential investment property loans will increase by up to 0.30%, effective 4 August 2015.

Westpac will decrease fixed rates on owner occupier home loans by up to 0.30% effective 4 August 2015.

Consumer Bank Chief Executive, George Frazis, said: “Today’s announcement is an important step in ensuring that Westpac meets APRA’s benchmark that investor credit growth should be no more than 10 per cent.

“We have already introduced a range of initiatives, including increasing the deposit required for investment property loans to 20 per cent as part of our commitment in meeting APRA’s benchmark.

“However, we are pleased to be able to reduce fixed rates on owner occupier loans. We know that the dream of many Australians is to get into their own home and the new lower fixed rates will benefit customers that are looking for security and peace of mind about their loans and monthly repayments.”

The Westpac delay is probably connected with the system changes which will need to be made, as we highlighted in an earlier post.

APRA MBS Says Investment Loans Higher – But Beware!

The APRA monthly banking statistics for the ADI’s to June 2015 were released today.  Home investment lending does not show signs of cooling, so this explains the recent more overt pressure being applied by the regulators. We will look at home lending first. The banks grew their lending book by 1.33% in the month to 1.37 trillion. Remember this is the stock of loans. RBA reported total loans were $1,481 bn, the difference being the non-banks.

Within that, owner occupied loans were down 1.24% and investment loans were up 5.99%.  Investment loans were worth $507 bn. But this is due to a massive adjustment in the data relating to ANZ. Between May and June, the APRA ANZ data shows their owner occupied loans dropped by $16.2 bn and their investment book grew by $23 bn. We think this helps to explains ANZ’s announcement earlier. Clearly some loans have been reclassified between May and June, so this distorts the overall market picture. APRA’s report on revisions does not really help us. That said, here is the detailed analysis.

CBA has the largest share of owner occupied loans, with 27.36% of the market. Westpac has 30% of all investment property lending. ANZ had 15.12% of owner occupied loans, and 16.46% of investment loans (under the revised data in June).

APRA-MBS-June2015-HomeLoanShareThe portfolio movements May to June show the ANZ swing, and not much else!

APRA-MBS-June2015-MonMovementThe APRA speed bump of 10% is well and truly exceeded this month because of the swing in ANZ. The market grew at an annualised rate of over 15% and many large and small players are well above the threshold – ANZ was at 47% – but this is because of the adjustment. The true growth rate is lower. But, no visible impact of the APRA guidelines so far.

APRA-MBS-June2015-INVGrowthFor comparison purposes, here is the data for owner occupied loans – and though no formal speed limit is in place, we have shown the 10% benchmark. The market grew at 4.3% in the past 12 months. The true rate is higher.

APRA-MBS-June2015-OOGrowthTurning to deposits, little change in the month, total deposits were down just a tad to $1.83 trillion. Little movement in relative shares.

APRA-MBS-June2015-DepositShareOn the credit card portfolios, there was a rise of 0.4% in balances outstanding, to $41.5 bn. No significant change in the relative share.

APRA-MBS-June2015-CardsShare

Investment Property Lending Sucking Finance From Business

The latest data form the RBA on credit aggregates to June 2015, tells the continuing story of growing investment property lending, and a relative reduction in lending to business. The data on total loans outstanding (stock) shows there was a fall in lending to business in the month of 0.36%, which translates to a growth of 4.3% for the year to $789 bn. On the other hand, lending for housing rose 0.6% in the month, and 7.3% for the year, (higher than last year at 6.4%) to $1,481 bn. Owner occupied housing rose 0.47% to $945 bn, whilst investment lending grew 1.10% to $536 bn. Other personal lending rose 0.15% to $137 bn.

RBA-Credit-June-2015Total lending to business as a share of all lending fell again to 32.8%, this is not healthy as productive growth comes from business investing in their futures. This is not as strong as we need to sustain the economy.

RBA-CreditBusiness-June-2015Looking at the mix of lending for housing, investment lending was up to 36.2%. It has never been higher. This inflates house prices, and banks balance sheets, but the wealth is artificial, and unproductive.

RBA-CreditHousing-June2015 Finally we think there are some funnies in these numbers, which when we have completed the analysis of the APRA monthly banking statistics, we will comment on further. Suffice it to say, it seems maybe some loans were reclassified last month from owner occupied to investor loans, so might be distorting the data.

DFA Survey Shows Property Demand Remains Strong

Following on from yesterdays video blog on the overall results from the latest household surveys, over the next few days, we will dig further into the data. We start with some cross segment observations, before in later posts, we begin to go deeper into segment specific motivations. You can read about our segmentation approach here. Many households still want to get into property – demand is strong, thanks to lower interest rates, despite high home prices and flat incomes. Future capital growth is expected by many in the market, and by those hoping to enter. This despite a fall in household confidence, as measured in our finance confidence index.

We start with savings intentions. Prospective first time buyers are saving the hardest, despite the lower interest being paid on deposits. More than 70% are actively saving to try and get into the market (though we will see later, more are switching to an investment purchase). Portfolio and solo property investors are saving the least – despite the recent changes to LVR’s on loans.

A significant proportion of those saving are actively foregoing other purchases and spending less, so they can top up their deposits. A higher proportion are also looking to the “Bank of Mum and Dad” for help.

SurveySavingJuly2015Looking next at borrowing intentions over the next 12 months (an indication of future mortgage finance demand), down-traders are slightly less likely to borrow now, compared with a year ago, whilst investors are firmly on the loan path. First time buyers will need to borrow. Refinancers are active, and one motivation we are seeing is the extraction of capital during refinance, onto a lower interest rate.

SurveyBorrowJuly2015Many households are still bullish on house price growth. Investors are the most optimistic, whilst down-traders the least. There are significant state differences, with those in the eastern states more positive than those elsewhere.

SurveyPricesJuly2015So, who is most likely to transact? Portfolio investors are most likely, then down-traders, and solo investors. There is also a lift in the number of households looking to refinance, to take advantage of lower interest rates. The recent public announcements by the banks, about tightening lending criteria appears to have encouraged some to bring forward their plans to purchase, in the expectation that later it may be more difficult to get a loan.

SurveyTransactJuly2015The recent tweaks in rates are having no impact on household plans, as the absolute rates are still very low – lower than ever – for many. We conclude that the demand side of the property and mortgage markets are still intact.

Next time we will look in detail at data from first time buyers, and then investors.

Australian Major Banks’ Repricing of Residential Investor Loans Is Credit Positive – Moody’s

From Moody’s.

Over the past week, three major Australian banks increased their lending rates for residential property investment loans and interest-only (IO) loans. Australia and New Zealand Banking Group Limited and Commonwealth Bank of Australia each lifted the standard variable investor rate by 0.27%. National Australia Bank Limited increased the rate it charges for IO loans and line of credit facilities by 0.29% (investors, rather than owner-occupiers, primarily take out IO loans).

Increased lending rates are credit positive for the banks because they re-balance their portfolios away from the higher-risk investor and IO lending toward safer owner-occupied and principal amortizing loans. They also help to preserve net interest margins (NIM) and profitability amid higher capital requirements and increased competition from smaller lenders.

The banks’ moves follow increasing regulatory scrutiny of residential property lending. Investment and IO lending has grown rapidly in the recent past, reaching a record proportion of overall mortgage lending that has contributed to rapid house price appreciation, particularly in the Sydney and Melbourne markets.

In December 2014, the Australian Prudential Regulation Authority (APRA) announced a set of measures designed to ensure residential mortgage underwriting standards remain prudent and to curb growth in investment lending to 10% per year. The major Australian banks have since undertaken a number of initiatives to ensure compliance with APRA’s guidelines. Notably, these include the imposition of higher down payment requirements for investment lending and these most recent pricing changes.

Although investment and IO loans performed well during the global financial crisis of 2007-10, they inherently carry higher default probabilities and severities, and a larger proportion of such loans risks higher delinquencies for Australian banks at times of stress.

Investment loans typically have higher loan-to-value ratios: our data indicates that the average loan-to-value ratio for investment loans is 60.2%, versus 57.8% for owner-occupier loans. In addition, since the underlying properties are not the primary residence, they are more sensitive to changes in house prices and borrower employment status and thus are more likely to default if the borrower’s conditions change. IO loans are more exposed to rising interest rates than principal-and-interest loans.

We see APRA’s and the banks’ efforts to slow the growth in investment lending as an important credit support for the system. We also expect that the remaining major Australian bank, Westpac Banking Corporation will follow the other banks in repricing its investment mortgage book. Over time, these steps are likely to slow investment lending growth rates to below APRA’s 10% cap from current annualized growth rates of 10.6% for ANZ, 9.9% for CBA, 14.1% for NAB and 10.0% for Westpac, according to APRA data.

Curbing investment lending is particularly positive for those banks with significant investment loan portfolios. NAB and Westpac, when it follows suit, are especially well-placed to derive benefits from pricing changes. Westpac has the highest proportion of investment lending in its portfolio (46% of total housing loans), exposing it to a higher-risk segment, and NAB has opted to reprice its IO loans and line of credit facilities (together they constitute 47% of its overall portfolio), allowing it to capture a greater NIM benefit.