Deutsche Warns Global Economy About To Roll Over, Says “Sell”

From Zero Hedge.

When Trump unexpectedly won the election, and futures staged one of their most dramatic rebounds in history, surging from limit down to solidly in the green, Wall Street promptly goalseeked their economic assumptions “chasing the price”, quickly going from bearish to bullish, and nobody did it faster or more conclusively than Deutsche Bank, which seemingly overnight flipped from one of the biggest bearers of gloom on the outlook for the US economy, to one of its biggest cheerleaders.

That however changed overnight, when DB’s European equity strategist Sebastian Raedler highlighted that, according to the latest flash PMIs, global growth momentum hit a six-year high in January.

And with global macro surprises close to their all-time high – much of which has been predicated on the relentless debt-creation by China which just got instruction to slow down dramatically in the current quarter – the DB strategist says they are likely to roll over from current elevated levels, resulting in a slowdown in global growth in the coming months.

From his full set of observations, first here are the good news:

Global growth momentum hits a six-year high: in mid-January, our indicator of global macro surprises rose to 45, the highest level since May 2010. This points to a further rise in global manufacturing PMI new orders from the December level of 53.7, implying they are now at a six-year high and consistent with 2017 global GDP growth of 3.5% at market FX terms (a sharp acceleration from the 2.6% realized growth over the past four quarters).

The rebound in growth momentum has been the main driver of the sharp moves in asset prices over the past six months:

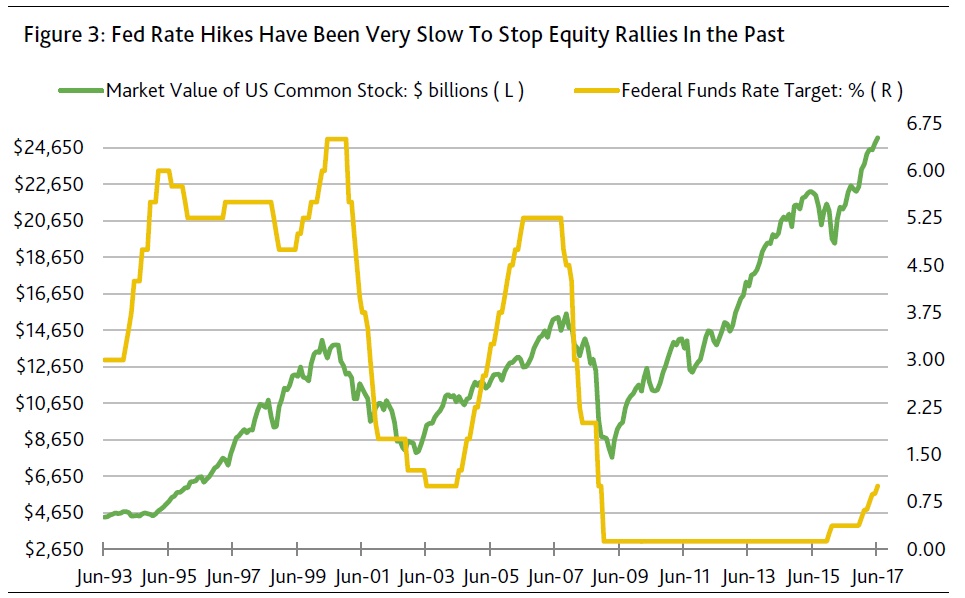
  • Global equities have continued to track global macro surprises over the past year (with an R2 of 70%), rebounding by 15% on the back of the 50 point rise in macro surprises since mid-2016;
  • US 10-year bond yields have moved in line with global PMIs since the end of the financial crisis in 2009 (with an R2 of 75%): after the Brexit vote in June 2016, they had undershot this relationship (pricing in a sharply negative growth shock), but then rebounded by 100bps to re-couple with improving growth momentum (though, at 2.5%, they are still slightly below the fair-value level suggested by that relationship, at 2.8%, potentially because of the technical obstacle of extreme short positioning).
  • European cyclicals versus defensives have rebounded by 25% since early July to reach a 10-year high, the sharpest cyclical rally since 2009, in line with rebounding macro surprises.

And now the bad:

 We believe global macro momentum is likely to roll over from current elevated levels:
  • Global macro surprises have only been higher 5% of the time since 2003 (when the data series starts), typically roll over from these elevated levels and have shown first signs of softening over the past week;
  • Global PMIs are already consistent with global GDP growth 50bps above our economists’ 2017 growth forecasts of 3%, despite the fact that the latter incorporate aggressive assumptions for fiscal stimulus in the US;
  • Chinese PMIs are already close to a six-year high, having rebounded by 7 points over the past 15 months. They point to quarterly annualized GDP growth of 8%+ (above the government’s target of 6.5%) and the credit impulse (a key driver of SoE fixed asset investment) is set to turn negative. This suggests the risk to Chinese growth momentum is now to the downside;
  • Our model of global PMIs suggests global growth momentum has rebounded because of the easing in financial conditions due to tighter HY spreads and a reduced drag from USD strength as well as lower global uncertainty. However, it also implies that the rebound in growth momentum should start to fade, as the lagged benefit from falling commodity prices is wearing off.

Not surprisingly, it will all start with the world’s “marginal” growth economy China:

So if DB is right and the global economy is about to roll over, just as Trump begins his presidency, how should one trade it? Simple: by derisking, i.e. selling stocks.

 Trade recommendations: Lower macro surprises would be consistent with a tactical pull-back for equities (especially against the backdrop of still-elevated readings on our market sentiment indicators) as well as a roll-over in cyclicals versus defensives.

DB’s conclusion: “the equity market looks stretched“, and furthermore the bank’s proprietary exuberance indicator has continued rising above a level of 70: “in 7 out of 8 instances over the past 10 years, the market has fallen over the following month (by up to 10%, but 2% on average).”

Finally, there is no more “cash on the sidelines” – cash holdings for US mutual funds are close to a 5-year low, suggesting that little money remains on the sideline waiting to come into the market.

Trump inauguration marks ‘whole new world’

From InvestorDaily.

Investors should prepare for more volatility and political uncertainty as the new President of the United States commences in his role, says Eaton Vance.

Equity markets enjoyed a rally following Donald Trump’s successful campaign for the presidency, benefitting from the then president-elect’s pro-growth policy proposals, but Eaton Vance co-director of global income Eric Stein notes this has recently paused.

“Equity markets have been in a bit of holding pattern recently after their post-election rally, while Treasury yields and the US dollar have fallen somewhat from post-election highs,” he said.

“Yet the big question is how markets will react after Trump takes the Oath of Office as the 45th US president, and investors start to get more details on his administration’s policies and agenda.”

Mr Stein cautioned investors not to discount the potential downside risks that may appear should Mr Trump focus on his more protectionist policies than his pro-growth reforms, but equally that they should not “underestimate the chance for a transformational positive economic environment” his proposed fiscal and regulatory reforms could create.

“Both outcomes are very possible, but I think it’s almost as important to watch tone and messaging as it is to watch the specifics of policy proposals,” he said.

“The inauguration speech is obviously an opportunity for Trump to act more presidential, and investors will be watching and listening closely. They will also focus on the communication style after the inauguration, and any details on what Trump plans to tackle first and how.”

Some of Mr Trump’s policy goals however could take longer to implement than many expect, said Pimco head of public policy Libby Cantrill.

“Many of the items that President-elect Trump and congressional Republicans are looking to tackle in 2017 – a healthcare overhaul, tax reform, infrastructure – are inherently complex and time-consuming, even with Republican majorities in both chambers of Congress,” she said.

Ms Cantrill said Mr Trump’s stance on Obamacare was one such example of this, noting that the Republicans controlling the house are split on whether to repeal and replace the legislation, or repeal and delay it.

“Healthcare policymaking is notoriously complex and time-consuming; it took Congress 14 months to pass Obamacare after holding more than 100 hearings in the Senate and 80 in the House,” she said.

Infrastructure spending, trade negotiations, and whether to cut or reform taxes were other policy decisions likely to be met with difficulty, Ms Cantrill said, noting that many of these may not be completed or implemented prior to 2018.

“The bottom line is that governing is harder than campaigning,” she cautioned.

“While we expect policymakers to focus on advancing the Trump agenda, there is a good chance that some of these agenda items slip into 2018 given the realities of Washington.”

‘Threat of protectionism’ poses serious risks

From InvestorDaily.

The global economy is improving, but investors must avoid complacency as the risks associated with US trade policy and its effects on emerging markets increase, according to Standard Life Investments.

Global activity is picking up and supporting corporate earnings growth, the company said, and fears of deflation are beginning to subside due to improving headline inflation rates and commodity prices.

“Meanwhile, other than the attack on the Mexican peso, market participants have so far shrugged off the potential for the trade policies of the incoming Trump administration to weigh on global growth, instead choosing to focus on the benefits of possible corporate tax reform and broader US fiscal easing,” the company said.

Despite the improved economic conditions, Standard Life Investments cautioned that “investors need to be wary of complacency”, noting that the current global manufacturing cycle was being led by emerging markets off the back of China’s stimulus efforts, and that President-elect Donald Trump’s proposed policies could undermine productivity and corporate margins, putting investors in “an unusual position”.

“On the one hand, the recent run of strong data suggests that there are upside risks to our global growth forecasts for 2017,” the company said.

“On the other, left-hand tail risks are also clearly higher. Trump’s first 100 days in office, together with the early year Chinese credit figures, will tell us more about which force will win out.”

Investors should also watch for developments in US-China relations, the company said, as “tensions are running high” in several areas, including trade.

“Investors would be wise to take the threat of protectionism seriously,” the company said.

“While it is unclear how far Trump’s team will go in changing trade policy, it is also unclear how other countries would react, particularly an emboldened China. Chinese official press have denounced the threats of across-the-board tariff increases and indicated their intention to retaliate.”

US Deregulation Seen to Spur to Growth, Trim Risk

Moody’s says Washington’s transfer of power is complete. Very high probabilities can now be assigned to lowering the 35% corporate income tax rate, easing federal business regulations, and a major overhaul of the US government’s role in health insurance.

Deregulation will supply stimulus at no immediate cost to the taxpayer. Nevertheless, deregulation reintroduces systemic risks that could prove costly over time.

A relaxation of federal business regulations and changes in government-mandated health care programs may supply an unexpectedly large lift to business activity. Not only will overhead costs decline, but businesses will be able to allocate a greater portion of their scarce resources to an enhancement of their product offerings. Success at the latter will expand attractive job opportunities.

Regarding a possible reformulation of Dodd-Frank, diminished regulatory burden will increase the supply of mortgage credit and business credit. Mortgage yields and business borrowing costs may be lower than otherwise, helping to offset the upward pressure put on private-sector borrowing costs by a higher fed funds rate and higher Treasury bond yields.

In addition, a softening of Dodd-Frank would enhance the ability of banks to make markets in corporate bonds and leveraged loans, where the availability of buyers for riskier debt is of critical importance during episodes of systemic financial stress. Corporate credit spreads have been wider than otherwise because of worry surrounding market depth in a time of stress.

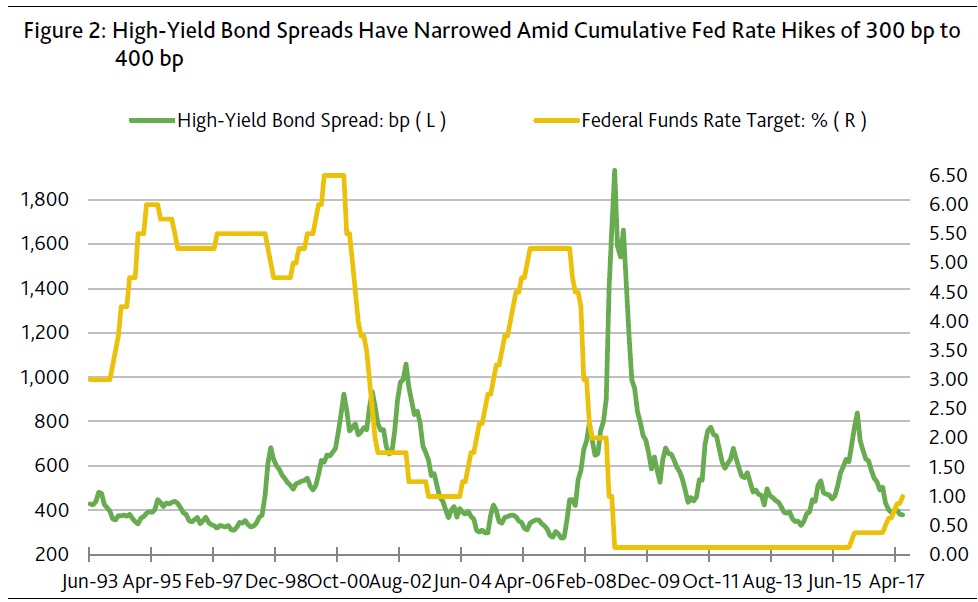
Paradoxically, despite fears that a relaxation of regulations will add to systemic risk, a widely followed measure of business credit risk — the high-yield bond spread — has narrowed considerably from an election day, or November 8, close of 515 bp to a recent 409 bp. Indeed, high-yield bonds have far outperformed higher-quality bonds since Election Day. Unlike the 10-year Treasury yield’s jump from November 8’s 1.86% to a recent 2.43% and the rise by an investment-grade corporate bond yield from 3.00% to 3.34%, a composite speculative-grade bond yield sank from November 8’s 6.53% to a recent 5.96%.

As inferred from the high-yield bond market’s upbeat response to the Republican sweep, the outgoing administration’s efforts to reduce systemic financial risk may have weighed so heavily on business activity and the efficient functioning of financial markets that they increased perceived default risk on a company by company basis. How ironic that an anticipated relaxation of financial and other business regulations has lessened perceived default risk considerably.

Room for growth may still go unfilled

And there is plenty of room to expand business activity without the risk of a potentially destabilizing upturn by price inflation. Rates of resource utilization are now exceptionally low for the seventh year of an economic recovery. If demand materializes, the Trump administration’s goal of 3% to 4% real growth for the US economy may at least be temporarily achievable.

However, given the financially stressed condition of many households both at home and abroad, as well as the diminished spending proclivities of the aging populations of advanced economies, spending may fall short of what is needed to sustain 3% to 4% growth over a yearlong span.

Moreover, real GDP growth of at least 3% may not be a recurring phenomenon. Long-term economic growth may be constrained to a pace closer to 2% if both the labor force and productivity continue to rise at rates that are well below their respective long-term trends.

Consensus outlook for profits requires faster than forecast GDP growth

Early January’s Blue Chip consensus projection of a 5.0% annual increase for 2017’s pre-tax profits from current production may be incompatible with the accompanying forecast of a 4.4% annual increase by 2017’s nominal GDP. Only if employment costs slow from their 4.7% annual climb of the year-ended September 2016 might nominal GDP growth of 4.4% deliver profits growth of 5.0%. However, if the recent 4.7% unemployment rate correctly indicates rising wage pressures, a deceleration by employment costs seems unlikely.

As inferred from the strong 0.87 correlation between the annual yearlong growth rates of corporate gross value added and nominal GDP, the consensus prediction of 4.4% nominal GDP growth favors a 4.1% annual gain for 2017’s corporate gross-value-added, where the latter is a proxy for corporate revenues.

In terms of moving yearlong averages, the percentage point difference between the annual growth rates of gross value added less corporate employment costs generates a strong correlation of 0.86 with the annual growth rate of pretax profits from current production.
Combining 2017’s prospective annual increase of 4.1% for gross value added with 4.7% employment cost growth predicts a 2.5% midpoint for the annual increase of 2017’s pretax operating profits. To the contrary, the equity and high-yield bond markets may be pricing in faster growth rates of 4.9% for gross-value-added and 5% for employment costs, where such assumptions support a predicted midpoint of 5% for core profits growth. However, 4.9% growth by gross-value-added may require faster-than-forecast nominal GDP growth of 5%.

Profits growth is likely if capacity use rises

Fourth-quarter 2016’s comparatively low industrial capacity utilization rate of 75.3% amplifies 2017’s upside potential for earnings growth. After declining from a year earlier in each of the last seven quarters including Q4-2016, the capacity utilization rate is expected to increase annually in each quarter of 2017. If true, the return of profits growth in 2017 is practically assured.

The yearly percent change by pretax profits from current production shows a highly asymmetrical response to the capacity utilization rate’s yearly percentage point change. Since early 1979, 68, or 85%, of the year-to-year increases by the capacity utilization rate have been joined by a year-to-year increase for profits. In stark contrast, only 32, or 46%, of the span’s 70 yearly declines by the capacity utilization rate were accompanied by lower profits.

The fuller use of production capacity also bodes well for corporate credit. In terms of yearly changes, the high-yield bond spread narrowed for 63% of the months since mid-1987 showing an increase by the capacity utilization rate, while the spread widened for 66% of the months showing a decline by capacity utilization.
Still low rates of resource utilization suggest that the current recovery may prove to be a late bloomer in terms of realizing its full potential.

Home loan rates heading higher as funding costs rise, competition eases

From The Australian Financial Review.

Mortgage rates are set to rise for both fixed and variable rate borrowers this year as global interest rates shoot higher, competition eases and capital rules begin to bite.

“Borrowers should assume we are at the bottom of the interest rate cycle – in fact we are probably already past it,” housing finance expert Martin North of Digital Finance Analytics told The Australian Financial Review.

Australia’s banks have cited higher funding costs as a reason for increasing fixed-rate home loans. On Monday National Australia Bank became the last of the big four banks to lift fixed-rate loans in recent months, citing higher funding costs as it raised rates on two, three and four-year mortgages.

The main cause of these higher funding costs for fixed-rate loans was a sharp rise in Australian medium-term bond rates from September to December as rising commodity prices, rising inflation and a shift in global monetary policy rhetoric forced traders to question the thesis that rates would stay low indefinitely.

Bond rates kicked up again following the election of Donald Trump in the US, forcing the three-year Australian swap rate to 2.35 per cent from an all-time low of 1.75 per cent in September. Australian interest rates rates tend to closely track movements in global bond rates and are expected to rise further this year, which will force costs higher for prospective borrowers seeking a fixed interest rate.

“Capital markets have seen a price hike since Trump, and as a result banks are having to pay more for wholesale funding – a critical element in bank funding,” Mr North said.

While rates on standard variable mortgage loans are not impacted by medium-term moves in the bond market, they too could edge higher this year if traders’ bets that the Reserve Bank is more likely to hike than lower interest rates prove correct.

For most of last year bond markets had priced in cuts for this year, but as global bond rates have shot higher rate cuts have all been but priced out – with markets prescribing just a one in 13 chance that the cash rate will fall this year. Meanwhile, traders are attaching a one in three probability that the Reserve Bank will raise the cash rate to 1.75 per cent before the end of the year.

Mr North said the global outlook and initial indications of the policy stance of new Reserve Bank governor Phil Lowe mean rate reductions appear unlikely.

“It depends on the Reserve Bank’s view on inflation versus property [risks from lower rates],” Mr North said. “Investment loans are hot, so I think it’s an even bet as to whether they raise rates.”

Australian Bureau of Statistics figures released on Tuesday showed mortgage lending to investors, which has concerned regulators, jumped by 4.9 per cent in November, up from 1.5 per cent in October – to the highest level since July 2015.

While base interest rates are likely to have the largest bearing on borrowing costs, other factors such as wholesale and deposit funding costs and capital requirements, and the level and intensity of competition among the banks for new loans will influence mortgage rates too.

Mr North, however, said that the signs are that competition pressures are easing, which will remove the downward pressure on home loan rates evident last year.

“The banks have realised that the deep discounting we saw in 2016 was a race to the bottom, so the banks are going to be sassier from here and that means higher rates,” he said.

Another potential upward force is the chance of further increases in capital when the Basel committee on banking supervision finalises its Basel III capital framework.

Mr North said this year will be characterised by differentiated pricing between customers with low risk, ‘low loan to value’ borrowers, that is, those who have a higher deposit, receiving favourable rates while riskier ‘high loan to value’ borrowers will pay more.

“The thing about Basel is it’s translating more of the portfolio risks into capital calculations so different types of borrowers attract different charges,” he said.

One positive for borrowers is that two important components of bank funding costs have moderated.

Concerns have been raised that banking rules that come into effect in early 2018 and prioritise retail deposits over other forms of funding will increase competition for savings, forcing up deposit costs. From January next year Australia’s banks will have to meet a prescribed ‘net stable funding ratio’ aimed at limiting the risk of a bank run by funding their loans with stable sources such as deposits.

So far, however, the evidence is that banks are not competing aggressively for savings, by increasing term deposit rates, as they were six months ago.

Analysis compiled by Deutsche Bank this week shows that deposit margins, measured as a spread over the bank bill rate, had declined significantly from August, when they rose to about 0.40 percentage points over the bank rate to below 0.20 percentage points. Online saving rates have also declined in recent weeks.

“While deposits remain a headwind to margins, these trends illustrate the continuing easing of deposit spread pressures,” Deutsche analyst Andrew Triggs wrote.

Wholesale bank funding costs, as measured by credit spreads, also appear to have moderated despite significant market uncertainty.

The cost of insuring against the default of a major Australian bank’s debt for five years is now around 64 basis points, its lowest level for 18 months, and well below the 10-year average of 100 basis points. Australian bank credit default swaps are a proxy for wholesale funding costs.

ASIC needs a win in 2017, but it’s not likely to come from the banks

From The Conversation.

In a pre-Christmas interview, Greg Medcraft, Chairman of the Australian Securities and Investments Commission (ASIC), looked forward to 2017 and talked tough:

What we want for people to appreciate is that there is nowhere to hide (when it comes to corporate crime).

With new(ish) money from the government, ASIC plans to hire loads of new people and spend big on “data analytics”. [Has no one told ASIC about the problems Centrelink is having with “big data”?

Medcraft was fairly happy with ASIC’s track record in 2016,

In the 12 months to the end of June we undertook 1400 high-intensity surveillances, finished 175 investigations, convicted 22 criminals, jailed 13 people, removed 136 people from the financial services industry.

Sounds impressive until one realises that most of those prosecuted were small fry (dodgy car dealers and the like) and the big end of town has barely been touched. At best it received a tiny tap on the wrist.

2016 was not a good year for ASIC.

In February, the long running scandal of manipulation of the key BBSW base rate burst into the open thanks to investigative journalist Adele Ferguson, and in March, ASIC took ANZ to the federal court. The action against ANZ was repeated later in the year with similar civil proceedings against Westpac and later against NAB. ASIC has not denied that CBA remains in its sights in the BBSW case.

The civil actions over BBSW have been a disaster for ASIC.

First, having to take regulated banks to court is considered in regulatory circles to be a failure. If a resolution for misbehaviour cannot be imposed, it really should be negotiated as it has been in other base rate manipulation cases overseas, with more than US$10 billion of fines and remediation being imposed on international banks for manipulation of LIBOR.

Second the major banks have ASIC over a barrel, admittedly a barrel they chose to lie over themselves. Banks have much more money than regulators to employ legal heavy hitters to drag proceedings out, and have chosen to do so rather than risk a banking royal commission.

In March, another disaster befell ASIC when Adele Ferguson unearthed the CommInsure scandal in which the insurance subsidiary of CBA was found to have dudded policy holders out of insurance compensation that they were entitled to.

As regards CommInsure, ASIC not only should have been searching for the rampant misconduct that was unearthed by the media, it should have taken action over serious misconduct. However, ASIC did what ASIC does best – start a multi-year investigation, which at the end of 2016 has not gone very far.

In April, it got worse. In a “capability review”, the government found that ASIC was a dysfunctional, overworked and under-resourced organisation. With an election on the horizon, Kelly O’Dwyer, the minster responsible, kicked the can down the road, and, hanging Medcraft out to dry, renewed his contract for only 18 months, rather than the usual three years. However, O’Dwyer did reverse the ASIC budget cuts put in place by her predecessor.

In May, ASIC was involved in yet another example of financial misconduct involving major banks being blindsided by dodgy mortgage providers. To its credit, ASIC had initiated the case against the dodgy brokers in 2015, but utterly failed to address the due diligence problems that were unearthed at the major banks. Again, the small fry got fried and the big fish swam away.

The middle of the year was busy for ASIC, mainly keeping its head down during the federal election and ignoring calls for a banking royal commission to address, problems most of which ASIC should have been tackling anyway.

After the election, a new problem hit the headlines. The big four banks were found to have sold products to some customers through their adviser network, with a fee for ongoing advice, but the advice had never been given.

ASIC blamed the problems on “cultural factors”, a topic that Medcraft had been banging on about for some time but obviously has been able to do little about. The latest culprits are so-called “subcultures”, or basically staff who don’t listen to management. ASIC would have been aware of such problems if its staff had read the groundbreaking research on risk culture by Professors Elizabeth Sheedy and Barbara Griffin.

For ASIC, 2016 ended in embarrassment, with ANZ and Macquarie banks being held to account for manipulating base rates. It was the Australian Competition and Consumer Commission (ACCC), not ASIC, which punished the culprits. In his end of year interview, Medcraft said “fining ‘bad apples’ is OK but you have to deal with the tree”, but so far ASIC has given no clue as to what it is going to do about the trees in this particular instance of gross misconduct.

ASIC’s final act of 2016 was farcical. Just before Christmas, the regulator announced that it had accepted an “enforceable undertaking” from the CBA and NAB in relation to the banks’ manipulation of wholesale spot foreign exchange (FX) rates. Overseas, regulators have extracted more than US$10 billion of fines from multiple banks for the so-called Forex fraud and indicted traders, but ASIC could manage fines of only A$2.5 million for each bank to shut down the case, with no one held to account.

It puts in context Medcraft’s comment to the Australian that “If you think about enforcement, you have to have penalties which actually hurt. They can’t be a feather”. Feathery fines of a few million dollars will hardly cause the big banks to “hurt”, unless it’s from laughing.

In his first interview of 2017, Medcraft hinted that he was prepared to roll over and run up the white flag on BBSW. He signalled to the banks that the climb down over Forex showed he was “pragmatic” and that

we’re always open to a settlement … but any settlement has to be credible.

Unfortunately, ASIC has lost what little was left of its credibility in 2016. The regulator could do worse than listen to its own advice to banks:

It gets back to individual accountability. We have to make sure that, where it’s needed, you have a whole-of-management accountability, which is critical.

But if no one else pays attention to ASIC, why should it listen to its own advice?

Author: Pat McConnell, Honorary Fellow, Macquarie University Applied Finance Centre, Macquarie University

Have The U.S. Stock Bulls Got It Wrong?

From Bloomberg.

Amundi SA, Europe’s largest money manager, says investors who have driven U.S. stock markets to record highs in expectation of fiscal stimulus from the Trump administration may be in for a surprise.


While a pivot to government spending and tax cuts may prolong the economic expansion in the U.S., Republican lawmakers will insist that fiscal measures don’t push up the deficit, Didier Borowski, the Paris-based asset manager’s head of macroeconomics, said in an interview. Even if President-elect Donald Trump succeeds in delivering stimulus, it won’t have an impact before next year, he said.

“Following the vote for Trump, markets have reacted as if there were only upside risks,” Borowski said in an interview in Munich. “U.S. equity markets could go further into bubble territory as risks are becoming increasingly asymmetric. That would be an opportunity to reallocate funds to bond markets.”

Trump’s surprise victory in the U.S. presidential election in November has driven investors out of bonds and into equities, accelerating a massive flow of funds that some investors say may last for years and spell the end of the multi-decade rally in bonds. The value of global equities climbed to $68 trillion from about $65 trillion the day before the election. Bonds have lost about $2 trillion in that time.

Financial market observers and investors are split about the continuation of that trend, sometimes named the “great rotation” from bonds to stocks, with Charles Schwab Corp.’s chief global strategist Jeffrey Kleintop anticipating the it has years to run. Amundi, which is controlled by Credit Agricole SA, says a more likely scenario is that bonds may rebound because growth will probably continue at a slow pace.

“Global uncertainties are at an unprecedented level with Brexit, Trump and elections in Europe,” Borowski said, adding the biggest risk would be a trade war between the U.S. and China. “The bond market isn’t dead yet. There are many unpredictable risks still looming and that’s why we really doubt that bond yields can jump that much. Investors will keep an exposure to U.S. Treasuries as a safe haven.”

Investors may also return to Europe, once the outcome of elections removes political uncertainty in the region, he said.

“Some investors have stayed clear of Europe following Brexit,” Borowski said. “At some point in the coming months we will be reassured concerning the political risks in Europe, especially in France, where we don’t expect French National Front leader Marine Le Pen to be elected.”

Amundi was created in 2010 when Credit Agricole and Societe Generale SA combined their asset-management businesses. It went public in 2015 to fund its international expansion as Societe Generale sold its stake.

Amundi agreed in December to buy Pioneer Investments from Italy’s UniCredit SpA for about 3.5 billion euros ($3.7 billion) in cash, bringing assets to more than $1.3 trillion and making it the world’s eighth-largest asset manager.

US Housing Finance Agencies Will Benefit from Cut in FHA Mortgage Insurance Premiums

Moody’s says on Monday, the US Department of Housing and Urban Development (HUD) announced that the Federal Housing Administration (FHA) will reduce by 25 basis points insurance premiums that borrowers pay on single-family mortgages. The premium cut is credit positive for US state Housing Finance Agencies (HFAs) because it will make FHA-insured mortgage loans more affordable to borrowers and increase HFA loan originations. The premium reduction will apply to new loans closing on or after 27 January.

HFAs are charged with providing and increasing the supply of affordable housing in their respective states for first-time homebuyers. The FHA, unlike other mortgage insurance providers, insure loans with loan-to-value ratios of up to 97%, which is key to the HFA lending base, given that first-time homebuyers often have limited funds for down payments.

The 25-basis-point decrease in the FHA’s insurance premium, which we expect will save new homeowners as much as $500 a year, also increases the competitiveness of HFA mortgage products. A lower FHA cost will attract more borrowers and stimulate stronger FHA loan originations at a time when mortgage interest rates are rising. As of 30 June 2016, FHA mortgage insurance provided the biggest share of the insurance on HFA pools, constituting approximately 38% of Moody’s-rated HFA whole-loan mortgages (see Exhibit 1), compared with 17% of mortgages utilizing private mortgage insurance.

HFA portfolio performance will strengthen because more loans will benefit from FHA insurance coverage. FHA insurance offers the deepest level of protection against foreclosure losses relative to other mortgage insurers because they cover nearly 100% of the loan principal balance plus interest and foreclosure costs. Additionally, the FHA provides the strongest claims-paying ability relative to private mortgage insurers. Although private mortgage insurers maintain ratings of Baa1 to Ba1, FHA insurance is backed by the US government.

The reduced FHA premiums will also benefit HFA to-be-announced (TBA) loan sales, which are secondary market sales using the Ginnie Mae TBA market. All loans utilizing Ginnie Mae must have US government insurance, and the FHA provides a substantial share of this insurance. Higher TBA sales will increase in HFA margins given that TBA sales have been a major driver of loan production and volume, contributing to an all-time high 17% margin in fiscal 2015, which ended 30 June 2015 (see Exhibit 2).

Will the ‘Trump rally’ continue through 2017?

From The Conversation.

So far, investors appear to be giving Donald Trump their vote of confidence.

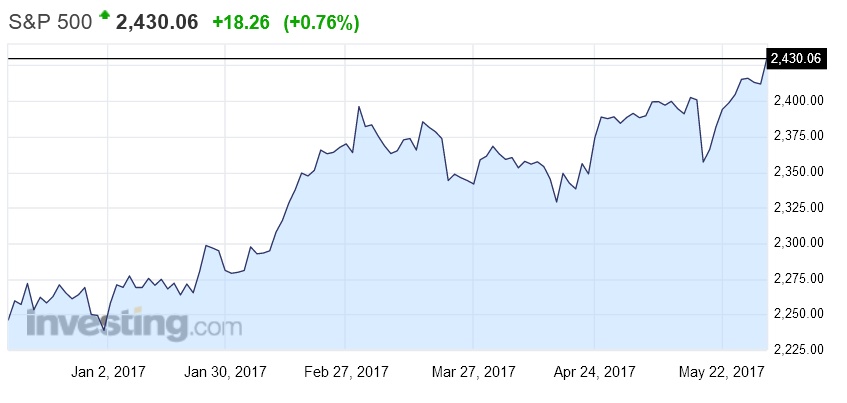
After his election as the 45th president of the United States, the U.S. Dollar Index rallied around 4 percent through the end of the year, while the Dow Jones Industrial Average approached 20,000 for the first time in its history and the Standard & Poor’s 500 was up just under 5 percent.

So now that investors have finished their usual year-end review of where to put their money, one question is on everyone’s mind: Will the so-called Trump rally continue in 2017?

In early November, I wrote an article based on my study showing that how stocks reacted in the first few days after a president’s victory would likely determine their performance for the rest of 2016 – which turned out to be true in Trump’s case.

In a similar vein, a separate study I published in 2009 demonstrated that how a stock market performs in the January a president takes office could portend its fortunes for the remainder of the year.

So will that also turn out to be true for Trump?

‘As January goes’

In that study, which I called “The ‘Other’ January Effect and the Presidential Election Cycle,” I combined two lines of research.

First, going at least as far back as the 1940s, the so-called January effect is a well-known bias in individual stock behavior in which stocks that lose value at the end of the year tend to reverse those losses in January.

The other January effect, which I use in my study, refers to evidence published in 2005 suggesting that January’s returns hold predictive power for the remainder of the year.

More specifically, this effect claims that when stocks go up in January, they tend to continue to climb for the rest of the year, and vice versa – regardless of the impact of other usual drivers of stock market returns. On Wall Street, this effect is often dubbed: “As January goes, so goes the year.” For the rest of the article, for simplicity’s sake, I’ll call this the January effect.

Second, I combined this January effect with the four-year presidential election cycle (PEC) to see how it influenced January’s predictive abilities. The PEC refers to a cycle in which U.S. stock market returns during the last two years of a president’s term tend to be significantly higher than gains during the first two years. This cycle is especially true for the third year of a president’s term, which has almost always been positive.

For my study, I wanted to see if the timing of the presidential cycle (first year, second year, etc.) affected January’s predictive abilities. I studied monthly returns (without dividends) of the S&P 500 over the 67-year period from 1940 through 2006.

January’s predictive power

Overall, my results were consistent with the paper noted above demonstrating that positive returns in January typically portended gains during the other 11 months of the year, as well as the opposite.

They further showed, however, that January’s predictive power is most convincing during the president’s first and fourth years in office. Since, at the moment, we care most about the first year of a president’s term, I’ll focus on those results.

Over my sample period of basically 17 election cycles, I found that during the president’s first year in office, average returns for the 11 months following a positive January were 12.29 percent, while a negative January led to average losses of 7.91 percent over the remainder of the year. That’s a difference of more than 20 percentage points – or over US$200,000 on a $1 million investment.

Furthermore, I found that a positive or negative January predicted returns for the remainder of the year almost 90 percent of the time, suggesting a very strong correlation.

Recent results have been split

Since my study was published, there have been two more elections, one of which ran contrary to the January effect, while the other confirmed it.

After President Barack Obama won the 2008 election, the S&P 500 lost 8.6 percent during his inaugural month of January. But the market rallied for the remainder of the year by about 35 percent.

Conversely, after his reelection in 2012, stocks returned around 5 percent in January 2013 and, consistent with the other January effect, the market climbed another 23 percent over the remainder of the year.

What’s behind this?

So what’s driving the effect?

Exactly what drives this effect is a topic of debate. For example, I tested whether it may be driven by monetary policy, which did not seem to be the case.

A common argument for the PEC is that it reflects investor views of fiscal policy, which is why returns during the second two years of the cycle tend to be higher than the first two. Yet my most significant results were for the first and fourth years.

Nonetheless, while I did not specifically test for fiscal policy influences, it seems valid since my results showed that January’s effect appears to be the most reliable during the president’s incoming year in office. The effect wasn’t nearly as pronounced during the other three years.

So far, that seems to be the case at the moment as the “Trump rally” appears to be a response to anticipated fiscal policy.

What to expect in 2017

Of course, there is never complete certainty in the markets, especially with an unavoidably small sample size like 17 election cycles. Still, the results of my study provide compelling evidence that, particularly in the president’s first year in office, January’s returns appear to capture information that is valuable for anticipating returns for the remainder of the year.

As of Jan. 10, the S&P 500 was up about 1.5 percent for the year and near its record high of 2,282, while the Dow continued to flirt with that magical 20,000 number.

While January’s full-month returns are not yet known, history strongly suggests that investors would be wise to closely monitor the S&P 500. If January 2017 remains positive for U.S. stocks, returns for the remainder of 2017 may very likely also be positive. The opposite can also be expected.

So for investors looking ahead in 2017, as January goes, perhaps so will the remainder of 2017.

Author: Ray Sturm, Associate Lecturer of Finance, University of Central Florida

Soaring property prices put sophisticated investors in harm’s way

From the Sydney Morning Herald.

Investors whose wealth has increased through soaring property prices and rising assets face being pushed into riskier financial products as they gain sophisticated investor status, experts say.

While it may seem like an attractive option for investors to attain a “sophisticated investor” certificate allowing them to participate in complex share placements, exotic bonds and exclusive private equity deals, experts are calling for an urgent rethink of the criteria.

“There are alarming levels of financial illiteracy across all Australian demographics,” says Mark Brimble, chair of the Financial Planning Education Council and lecturer at Griffith University.

“We can’t just assume that because someone has a certain value of assets and income that they understand these products.”

As it stands, investors with net assets – including their residential property – of $2.5 million and/or a gross income of least $250,000 a year for the last two years qualify for an SI certificate signed by an accountant. This enables them to participate in pre-IPOs, IPOs and receive tax benefits for investing in Early Stage Innovation Companies (ESICs), among other things.

But as house prices have soared – the median in Sydney is up 65.9 per cent since 2012 and Melbourne is up 48 per cent – it is much easier for people to qualify for this status.

“These criterion were meant to be a significant hurdle for people,” says Peta Tilse, managing director of Sophisticated Access and founder of Cygura, a centralised online platform for sophisticated investor certification and validation.

“But it’s become very outdated and thanks to the booming property market, including the family home, opens that sophisticated investor door right up,” says Ms Tilse.

The Australian Securities and Investments Commission (ASIC) offers client consumer protection to retail investors where financial advisors deliberately miscategorise their clients or when companies fail to properly disclose their businesses. However these protections are not available to sophisticated investors.

Another law, established in 1991, automatically upgrades an investor from retail to wholesale or sophisticated if they invest $500,000 or more in one particular product.

“It’s a law not many people know about and it was made when the average full time earnings were $19,000 per year, rather than the $80,000 now,” says Ms Tilse.