What the Fed Rate Rise Means for Corporate Debt in Emerging Markets

From The IMF Blog.

In December 2016, the U.S. Fed raised interest rates for the first time in a year, and said they planned more increases in 2017.  Emerging market currencies took a bit of a dive, but overall investors didn’t overreact and run for the doors with their money.  For the bigger picture, you can read IMF Chief Economist Maurice Obstfeld’s blog that outlines how the U.S. election and Fed decision will impact the global economy.

One aspect that makes emerging markets more vulnerable is their corporations are loaded down with debt in both local and foreign currency—to the tune of roughly $18 trillion—fueled in large part by low interest rates in the United States.  This debt now makes them vulnerable to the expected interest rate increases in 2017. Will firms be able to roll over their debt?

The debt balloon

The debt of nonfinancial firms in emerging markets has quadrupled over the past decade, with bonds accounting for a growing share (Chart 1). The considerable increase in corporate debt raises concerns, given the link between the rapid build-up in leverage in emerging markets and past financial crises.

chart

Our new paper suggests that:

  • Debt accumulation was more pronounced for firms which are more dependent on external financing. Likewise, relative to other types of firms, small and medium-sized enterprises disproportionately increased their leverage.
  • The impact of U.S. monetary policy on debt growth was greater for sectors that are more heavily dependent on external funding in financially open emerging markets with relatively more rigid exchange rate regimes.
  • Global financial conditions affected emerging market firms’ growth in debt in part by relaxing corporate borrowing constraints.

Where is debt highest

Corporate debt in emerging markets has climbed faster in more cyclical sectors, with the greatest growth seen in construction (Chart 2). The striking increase in leverage within the construction sector is most notable in China and Latin America. In addition, firms that took on more debt have, on average, also increased their foreign exchange exposures.

chart-2

Rating Revisions Dispute Thin Spreads – Moody’s

Interesting piece from Moody’s today which warns:

Do not confuse the stunning rally by high-yield bonds since early 2016 with a commensurate enhancement of the fundamentals governing high-yield credit quality. Be aware of how the same overvaluation that now inflates share prices may also be responsible for an exaggerated narrowing of high-yield spreads.

According to almost every explanation of the high-yield bond spread, a recent composite speculative-grade bond yield of roughly 6% now undercompensates investors for default risk. The accompanying high-yield bond spread of 404 bp was the thinnest since the 396 bp of September 23, 2014. However, September 2014’s 2.2% EDF (average expected default frequency) metric for US/Canadian high-yield issuers was significantly lower than the 3.6% of January 4, 2017. Indeed, the combination of the 3.6% high-yield EDF and its -80 bp drop of the last three months predicts a 450 bp midpoint for the high-yield bond spread that exceeds its recent 404 bp.

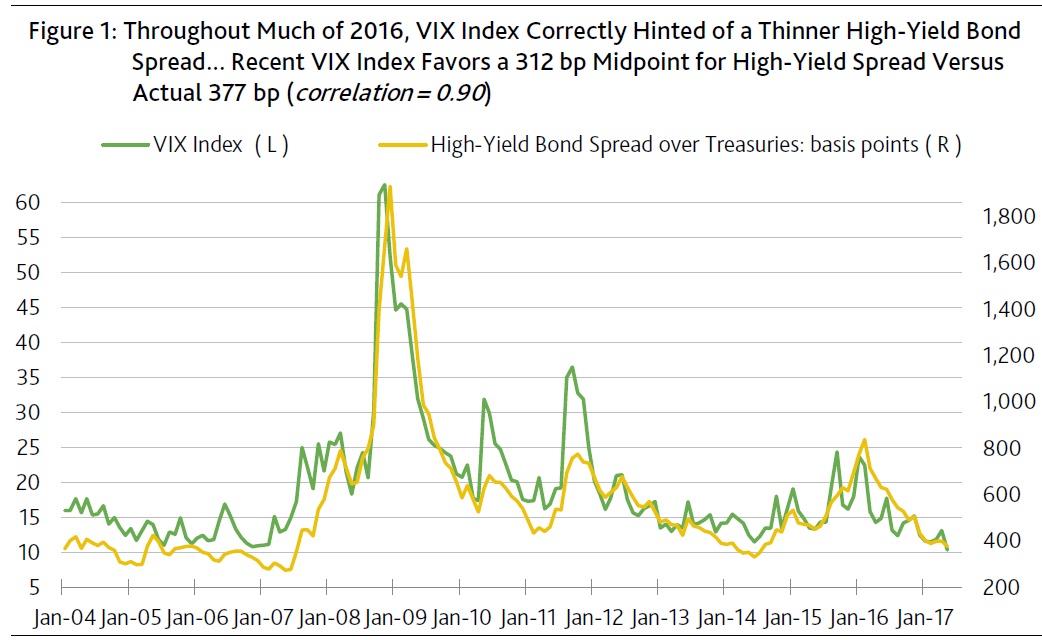
Of all the major drivers of the high-yield bond spread, only an exceptionally low VIX index supports the possibility of even less compensation for default risk. More specifically, the recent VIX index of 12.0 predicts a 360 bp for the high-yield bond spread. (Figure 1.)

Market behavior of the past year suggests that the VIX index will continue to give direction to the high-yield bond spread. Nevertheless, high-yield spreads could widen amid a climb by the market value of US common stock if a narrowly focused equity rally is incapable of reversing a worsening outlook for high-yield defaults.

Downgrades jump relative to Q4-2016 rating changes

Fourth-quarter 2016’s widening of the gap between high-yield downgrades and upgrades was very much at odds with a pronounced narrowing by the high-yield bond spread. Downgrades supplied 68% of the number of credit rating changes affecting US high-yield companies in 2016’s final quarter. Previously, after dropping from Q1-2016’s current cycle high of 82% to Q2-2016’s 62%, downgrades’ share of US high-yield credit rating revisions would then sink to Q3-2016’s 54%.

The latest upswing by the relative incidence of high-yield downgrades cannot be ascribed to the oil and gas industry. To the contrary, the relative incidence of high-yield downgrades actually increased after excluding oil and gas related revisions largely because of Q4-2016’s financially-driven, as opposed to fundamentally-based, oil and gas company upgrades. More specifically, downgrades’ share of high-yield credit rating revisions excluding all changes closely linked to oil and gas would soar from Q3-2016’s 48% to Q4-2016’s 70%, where the latter was the highest such ratio since the 72% of Q1-2016.

When comparing the US high-yield rating revisions of 2016’s third- and fourth-quarters, a -48% plunge in the number of upgrades stands out. By contrast, the number of high-yield downgrades barely dipped by -4%.

After excluding revisions that were purely event driven, the number of high-yield upgrades attributed to improved fundamentals sank by -46% from the third to the fourth quarter, while downgrades stemming from worsened fundamentals edged higher by 1%.

Spreads may widen unless net downgrades subside

When the high-yield bond spread averaged 379 bp during the year-ended September 2014, not only were fundamentally driven high-yield downgrades -40% fewer, on average, compared to Q4-2016’s pace, but fundamentally-driven upgrades were +29% more numerous. Moreover, in terms of quarterly averages for all US high-yield credit rating changes, the year-ended September 2014 showed -29% fewer downgrades and +41% more upgrades compared to Q4-2016’s results. And yet the high-yield spread is now the narrowest since September 2014?

Notwithstanding the jump by downgrades’ share of US high-yield credit rating revisions both with and excluding oil and gas related changes, the high-yield bond spread still narrowed considerably from a Q3-2016 average of 551 bp to Q4-2016’s 477 bp. Moreover, as noted earlier, January 4, 2017’s high-yield bond spread of 404 bp was the thinnest since September 2014, where the latter was at the end of the just cited yearlong span of a much lower ratio of downgrades to upgrades.

The record warns of a wider high-yield bond spread unless fourth-quarter 2016’s excess of high-yield downgrades over upgrades narrows substantially. As statistically inferred from the relatively strong correlation of 0.80 between the high-yield bond spread’s quarter-long average and the moving two-quarter ratio of net high-yield downgrades to the number of high-yield issuers, H2-2016’s ratio favors a 536 bp midpoint for the high-yield bond spread. Moreover, if the net high-yield downgrades of 2016’s final quarter persist through the end of September 2017, the projected midpoint for the high-yield spread widens to 560 bp. (Figure 2.)

Equity strength enhances credit quality

The fact that the high-yield spread is now much narrower than what might be inferred from the recent excess of high-yield downgrades over upgrades underscores the critical importance of today’s superb financial market conditions to the current thinness of spreads. The considerable support now supplied to the high-yield bond market by an exceptionally low VIX index of 12.0 cannot be overstated. Once financial market conditions deteriorate, the high-yield bond market’s vulnerabilities will become apparent.

Nevertheless, today’s ample amount of systemic liquidity can facilitate a strengthening of high-yield credit quality. Injections of common equity capital enhance corporate credit quality either by (i) deepening the capital base that shields creditors or (ii) funding the retirement of outstanding debt.

Common equity capital is more likely to be secured at an attractive cost during a broad based equity rally. When the US equity market was flat to lower during the six-months-ended March 2016, only two upgrades were ascribed to injections of common equity capital. However, a subsequent rally by US shares has helped to boost the number of common-equity injection upgrades to the 32 of the final nine months of 2016.
In addition, a well-functioning equity market also boosts the number of upgrades stemming from mergers, acquisitions and divestments. After averaging 23 per quarter during the year ended September 2015, the number of upgrades linked to M&A slumped to 12 per quarter amid the soft equity market of the six-months-ended March 2016. Thereafter, stocks thrived during the final nine months of 2016 and the number of upgrades attributed to M&A rebounded to 24 per quarter, on average. Of special importance to financially-stressed high-yield issuers is how broad stock market rallies often facilitate asset divestitures that fund the retirement of outstanding debt.

Credit quality worsened amid huge equity rally of 1998-2000

The breadth of an equity market rally matters. Despite the 18.5% average annual surge by the market value of US common stock during the two years ended March 2000, the US high-yield default rate climbed up from March 1998’s 2.7% to March 2000’s 6.3%, the moving two-quarter ratio of net high-yield downgrades to the number of high-yield issuers soared higher from Q1-1998’s -2.5% to Q1-2000’s +7.7%, and the high-yield bond spread widened from Q1-1998’s 338 bp to Q1-2000’s 522 bp.

Instead of benefiting from the very strong showing by the market value of US common stock, the high-yield bond market was weighed down by the accompanying -5.9% average annual decline incurred by Value Line’s geometric stock price index, which offers insight regarding the breadth of an equity market rally. Despite the equity market’s outsized gains of the two-years-ended March 2000, the gains were narrowly focused according to the slide by the Value Line index. By contrast, the 17% surge by the Value Line index from Q1-2016 to Q4-2016 was actually greater than the accompanying 14% increase by the market value of US common stock.

As revealed by the statistical record since 1994, the high-yield bond spread’s year-over-year change in basis points shows a stronger inverse correlation of -0.82 with the yearly percent change of the Value Line index relative to its comparably measured correlations of -0.76 with the Russell 2000 stock price index and -0.67 with the market value of US common stock.

Moreover, another possibly revealing aspect of 1998-2000’s equity rally was how it occurred despite a relatively high VIX index. Though the methodology determining the VIX index has since changed, after advancing from a 1993-1996 average of 13.9 to March 1998’s 20.2, the VIX index averaged an even higher 22.7 in March 2000.

In conclusion, an extension of the ongoing high-yield rally may require a further overvaluation of the US’s already richly priced equity market. Until downwardly revised earnings outlooks proliferate, the path of least resistance for share prices may be higher. Thus, high-yield bond spreads may continue to ignore the less than favorable trend of credit rating revisions.

What Is This “Neutral” Interest Rate Touted by the Fed?

From Mises Wire.

There’s a lot of talk these days about the so-called “neutral” (or “natural” or “terminal”) interest rate projections of the Federal Reserve. In fact, their projection of this number is a key argument in their ongoing decision to keep rates at historically very-low levels for what has been an extended period of time. (Specifically, Federal Reserve officials have argued that the neutral interest rate has sharply declined in recent years, meaning that apparently ultra-low interest rates do not really signify easy monetary policy.)

What is this neutral rate? The neutral rate, it is argued, is simply the federal funds rate at which the economy is in equilibrium or balance. If the federal funds rate were at this mysterious neutral rate level, monetary policy would be neither loose nor tight, and the economy neither too hot nor too cold, but rather just chugging along at its long-run optimal potential. The underlying theory is that loose monetary policy — where the Fed’s policy rate is set below the neutral rate — can temporarily stimulate the economy, but only by causing price inflation that exceeds the Fed’s desired target (which, by the way, eventually causes overheating and a crash). On the other hand, if the Fed is too tight and sets the policy rate above the neutral rate, then unemployment creeps higher than desired and price inflation comes in below target.

In short, the neutral interest rate is one where the central bank is not itself distorting the economy. Monetary policy would really be nonexistent, as the Fed would not be altering the interest rate resulting from a free market discovery process between borrowers and savers. (This of course raises the question, why do central planners need to fabricate something that would naturally exist in their absence?) This is near where Yellen actually thinks we are these days, hence she sees little urgency in raising rates and thus lessening what, on the face of it, looks like a very loose current monetary policy.

The Theory of the Neutral or Natural Rate

Much of this neutral rate talk at the Fed is supposedly supported by the work of Swedish economist Knut Wicksell (1851–1926), who argued that the “natural” interest rate would express the exchange rate of present for future goods in a barter economy. If in practice the banks actually charged an interest rate below this natural rate, Wicksell argued that commodity prices would rise, whereas if the banks in practice charged an interest rate above the natural one, then commodity prices would fall. But that’s where Wicksell — often associated with the free-market Austrian school of economics — would cease to recognize his own ideas in current central bank thinking. Wicksell’s natural rate was a freely discovered market price in an economy, which reflected the implicit (real) rate of return on capital investments. For Wicksell, the natural interest rate was not a policy lever to be manipulated, in order to hit some employment or output goal. Yellen and the other Fed economists writing on this topic have conveniently (and probably unwittingly) co-opted Wicksell into their own Keynesian (and exceedingly un-Austrian) framework.

Can the Neutral Rate Be Used to Tweak the Economy?

That’s the theoretical explanation of the neutral or natural rate. From a more practical standpoint, one must ask: How do we even know what that neutral rate is? The neutral rate is, by its current definition, inherently unobservable, as there is no discovery process in short-term interest rates (and there hasn’t been for as long as any of us have been around). Central banks calculate the neutral rate based on their formulas and identifying assumptions about output gaps and what interest rates, according to those models, will close those gaps. Here we have an immense circularity problem: Policymakers think they know the neutral rate because the assumptions of their interventionist model that they impose on the data say so, not because they have any insight that the market would actually clear at that rate, sans intervention. There is an underlying assumption that “markets, left on their own, are wrong, while our model is right.” Moreover, they are using observable data as model inputs that are the result of interventions that are already in effect. There are no controlled experiments in economics. Only market participants, acting freely in borrowing and lending at whatever interest rates make sense for that borrowing and lending, can ever discover what the neutral rate should be.

(To give a specific example: One of the key alleged pieces of evidence that the neutral rate has fallen in recent years is the sluggish growth of productivity. But suppose the ZIRP of the Fed itself has been choking off real savings and distorting credit allocation among deserving borrowers, and hence has crippled sustainable growth in output? In this case, the Fed models would conclude, “Nope, our policy rate hasn’t been too low, look at the weak productivity growth,” confusing cause and effect.)

In fact, the circular logic is such that economists are far from an agreement on the current calculation, and their admitted model estimation errors are enormous. Contrary to Yellen’s recent monetary policy ruminations, reputable estimates using two different approaches have concluded that the Fed has set policy rates below the neutral rate since 2009.

Things get worse. It’s not merely that we can’t know in real-time what the neutral rate is; we can’t even know after the fact. Suppose the Fed gradually hikes rates, and then the economy crashes. Dovish Keynesians would no doubt say, “We told you not to tighten! The neutral rate was obviously lower than the Fed realized, and they just raised the policy rate above it.” But this isn’t necessarily so. It could be that the policy rate had been below the neutral rate for years, fostering a giant asset bubble which eventually had to collapse. Both theories are consistent with the observed outcome of modest rate hikes leading to a crash.

The great Austrian economist Friedrich Hayek stressed the role of market prices in communicating information to firms and households, and the impossibility that central planners can ever effectively calculate those prices. If the Fed’s economists think they are able to estimate what the neutral interest rate is, then we can dispense with prices altogether. The Fed’s economists can estimate the “neutral wage rates” for various types of labor, the “neutral commodity prices” for various inputs, and so forth, and issue comprehensive plans for the economy, all calculated in kind.

Of course, this is absurd. The point is, in a capitalist economy, the interest rates themselves — as determined in a competitive discovery process in the bond and credit markets — are central to the coordination of the economy. To assume experts at the Fed could determine the proper, optimal interest rate, without that discovery process, is to assume away the real-world information problems that we all can agree market prices solve. Indeed, perhaps this is why our economic problems persist?

China Hits a Fork in the Road

From The Automatic Earth

The end of the year is always a time when there are currency and liquidity issues in China. This has to do with things like taxes being paid, and bonuses for workers etc. So it’s not a great surprise that the same happens in 2016 too. Then again, the overnight repo rate of 33% on Tuesday was not exactly normal. That indicates something like a black ice interbank market, things that can get costly fast.

I found it amusing to see Bloomberg report that: “As banks become more reluctant to offer cash to other types of institutions, the latter have to turn to the exchange for money, said Xu Hanfei at Guotai Junan Securities in Shanghai. Amusing, because I bet many will instead have turned to the shadow banking system for relief. So much of China’s financial wherewithal is linked to ‘the shadows’ these days, it would make sense for Beijing to bring more of it out into the light of day. Don’t hold your breath.

Tyler on last night’s situation: ..the government crackdown on the credit and housing bubble may be serious for once due to fears about “rising social tensions”, much of the overnight repo rate spike was driven by the PBOC which pulled a net 150 billion yuan of funds in open-market operations..”. And the graph that comes with it:


It all sounds reasonable and explicable, though I’m not sure ‘core leader’ Xi would really want to come down hard on housing -he certainly hasn’t so far-, but there are things that do warrant additional attention. The first has to be that on Sunday January 1 2017, a ‘new round’ of $50,000 per capita permissions to convert yuan into foreign currencies comes into effect. And a lot of Chinese people are set to want to make use of that, fast.

Because there is a lot of talk and a lot of rumors about an impending devaluation. That’s not so strange given the continuing news about increasing outflows and shrinking foreign reserves. And those $50,000 is just the permitted amount. Beyond that, things like real estate purchases abroad, and ‘insurance policies’ bought in Hong Kong, add a lot to the total.

What makes this interesting is that if only 1% of the Chinese population -close to 1.4 billion people- would want to make use of these conversion quota, and most of them would clamor for US dollars, certainly since its post-election rise, if just 1% did that, 14 million times $50,000, or $700 billion, would potentially be converted from yuan to USD. That’s almost 20% of the foreign reserves China has left ($3.12 trillion in October, from $4 trillion in June 2014).

In other words, a blood letting. And of course this is painting with a broad stroke, and it’s hypothetical, but it’s not completely nuts either: it’s just 1% of the people. Make it 2%, and why not, and you’re talking close to 40% of foreign reserves. This means that the devaluation rumors should not be taken too lightly. If things go only a little against Beijing, devaluation may become inevitable soon.

In that regard, a remarkable change seems to be that while China’s always been intent on keeping foreign investment out, now all of a sudden they announce they’re going to sharply reduce restrictions on foreign investment access in 2017. While at the same time restricting mergers and acquisitions by Chinese corporations abroad, in an attempt to keep -more- money from flowing out. Something that has been as unsuccessful as so many other pledges.

The yuan has declined 6.6% in value in 2016 (and 15% since mid-2014), and that’s probably as bad as it gets before some people start calling it an outright devaluation. More downward pressure is certain, through the conversion quota mentioned before. After that, first there’s Trump’s January 20 inauguration, and a week after, on January 27, Chinese Lunar New Year begins.

May you live in exciting times indeed. It might be a busy week in Beijing. As AFP reported at the beginning of December:

Trump has vowed to formally declare China a “currency manipulator” on the first day of his presidency, which would oblige the US Treasury to open negotiations with Beijing on allowing the renminbi to rise.

Sounds good and reasonable too, but how exactly would China go about “allowing the renminbi to rise”? It’s the last thing the currency is inclined to do right now. It would appear it would take very strict capital controls to stop the currency from plunging, and that’s about the last thing Xi is waiting for. For one thing, the hard-fought inclusion in the IMF basket would come under pressure as well. AFP continues:

China charges an average 15.6% tariff on US agricultural imports and 9% on other goods, according to the WTO.

Chinese farm products pay 4.4% and other goods 3.6% when coming into the United States.

China is the United States’ largest trading partner, but America ran a $366 billion deficit with Beijing in goods and services in 2015, up 6.6% on the year before.

I don’t know about you, but I think I can see where Trump is coming from. Opinions may differ, but those tariff differences look as if they belong to another era, as in the era they came from, years ago. Lots of water through the Three Gorges since then. So the first thing the US Treasury will suggest to China on the first available and convenient occasion after January 20 for their legally obligatory talk is: let’s equalize this. What you charge us, we’ll charge you. Call it even and call it a day.

That would both make Chinese products considerably more expensive in the States, and open the Chinese economy to American competition. There are many hundreds of billions of dollars in trade involved. And of course I see all the voices claiming that it will hurt the US more than China and all that, but what would they suggest, then? You can’t leave this tariff gap in place forever, so what do you do?

I’m sure Trump and his team, Wilbur Ross et al, have been looking at this a lot, it’s a biggie, and have a schedule in their heads for phasing out the gap in multiple steps. Steps too steep and short for China, no doubt, but then, I don’t buy the argument that the US should sit still because China owns so much US debt. That’s a double-edged sword if ever there was one, and all hands on the table know it.

If you’re Xi, and you’re halfway realist, you just know that Trump will aim to cut the $366 billion 2015 deficit by at least 50% for 2017, and take it from there. That’s another big chunk of change the core leader stands to lose. And another major pressure point for the yuan, obviously. How Xi would want to avoid devaluation, I don’t know. How he would handle it once it can no longer be avoided, don’t know that either. Trump’s trump card?

One other change in China in 2016 warrants scrutiny. That is, the metamorphosis of many Chinese people from caterpillar savers into butterfly borrowers. Or gamblers, even. It’s one thing to buy units in empty apartment blocks with your savings, but it’s another to buy them with money you borrow. But then, many Chinese still have access to few other investment options. That’s why the $50,000 conversion to USD permission as per January 1 could grow real big.

But in the meantime, many have borrowed to buy real estate. And they’ve been buying into a genuine absolute bubble. It’s not always evident, because prices keep oscillating, but the last move in that wave will be down.


If I were Xi, all these things would keep me up at night. But I’m not him, and I can’t oversee to what extent his mind is still in the ‘omnipotent sphere’, if he still has the impression that in the end, come what may, he’s in total control. In my view, his problem is that he has two bad choices to choose from.

Either he will have to devalue the yuan, and sharply too (to avoid a second round), an option that risks serious problems with Trump and other leaders (IMF), and would take away much of the wealth the Chinese people thought they had built up -ergo: social unrest-.

Either that or he will be forced, if he wants to maintain some stability in the yuan’s valuation, to clamp down domestically with very grave capital controls, which carries the all too obvious risk of, once again, serious social unrest. And which would (re-)isolate the country to such an extent that the entire economic model that lifted the country out of isolation in the first place would be at risk.

This may play out relatively quickly, if for instance sufficient numbers of people (the 1% would do) try to convert their $50,000 allotment of yuan into dollars -and the government is forced to say it doesn’t have enough dollars-. But that is hard to oversee from the outside.

There are, for me, too many ‘unknown unknowns’ in this game. But I don’t see it, I don’t see how Xi and his crew will get themselves through this minefield without getting burned. I’m looking for an escape route, but there seem to be none available. Only hard choices. If you come upon a fork in the road, China, don’t take it.

And mind you, this is all without even having touched upon the massive debts incurred by thousands upon thousands of local governments, and the grip that these debts have allowed the shadow banks to get on society, without mentioning the Wealth Management Products and other vehicles in that part of the economy, another ‘industry’ worth trillions of dollars. I mean, just look at the growth rates in these instruments:


There’s simply too much debt all throughout the system, and it’s due for a behemoth restructuring. You look at some of the numbers and graphs, and you wonder: what were they thinking?

Trustees Australia announces fintech merger

From InvestorDaily.

Fintech marketplace operator Cashwerkz has merged with Trustees Australia to create a platform that aims to disrupt the fixed interest investment sector.

According to the companies, the merger helps bring together Trustees Australia’s funds under management with Cashwerkz’s distribution platform to serve retail customers, the financial planning industry, superannuation funds, councils and other entities that are looking to invest large cash balances.

It is hoped the merged companies will allow Australian fixed income investors “to find the best term deposit and fixed income solutions to match their investment criteria and to simultaneously and seamlessly transact term deposits online between banks and buy/sell fixed interest securities, such as small parcel bonds, with or without the involvement of intermediaries”.

The merged platform will enable those seeking a term deposit or a related cash product to access Cashwerkz’s marketplace for cash. It will offer consumers a wider choice of ADIs, including access to regional ADIs such as smaller banks, credit unions and building societies. Likewise, it will offer regional ADIs and smaller banks access to a huge number of potential new consumers.

Brook Adcock, chairman of Adcock Private Equity, the company behind Cashwerkz, commented, “While some incumbents are keen to use the cost and difficulties associated with compliance of cash investments to ‘own’ their clients, consumers in many markets are now empowered by technology to break those compliance shackles and access better deals.

“There is an enormous opportunity to scale the business by expanding into the (before now), too granular and untapped retail market, the up-until-now paper-based middle-market, and the before-now too-time-consuming IFA market.”

Cashwerkz says it aims to expand into new products such as cash management accounts, high interest savings accounts, annuities and bonds.

Further, by retaining its custodial licence, the entity, listed under Trustees Australia, can offer custodial services to small and medium third parties, which it has identified as a gap in the market.

Contagion Concerns Slam Japanese Financials As Toshiba Crashes 50% In 3 Days

From Zero Hedge.

After two days of total carnage in Toshiba stocks, bonds, and credit risk, the bloodbath continues with the once-massive Japanese company is collapsing once again in early trading – now down 50% in 3 days. Following the semiconductor and nuclear business catastrophes, the company had nothing to add regarding today’s crash but more worryingly the massive loss of market cap is spreading contagiously to Japanese financials with Sumi down 4%, and MUFG down almost 3%.

As we noted yesterday, Tsunukawa said that “I apologize to shareholders, business partners and all stakeholders for the trouble we have caused,” after Toshiba said cost overruns at U.S. nuclear reactors it is building were likely to force a write-down of as much as several billion dollars, clouding its turnaround plan after the 2015 accounting scandal. Specifically, the company said it may have to book several billion dollars in charges related to a U.S. nuclear power plant construction company acquisition, rekindling “concerns about its accounting acumen.”

The problem is that the nuclear business, together with the semiconductors, has been positioned as one of key pillars underpinning Toshiba’s growth which has been trying to shift away from its consumer electronics core. Alas, the latest gaffe now means that much of Toshiba’s growth is gone, and the stock price reflect that overnight, when Toshiba’s stock plunged by 20%, the most permitted, before it was halted for trading.

The derisking is weighing heavily on USDJPY…

And now, as Bloomberg reports, Japanese financials are tumbling on cross-default, contagion concerns…

Sumitomo Mitsui Trust Bank has highest capital exposure to Toshiba, with loans equaling 5.5% of the bank’s equity, analyst Shinichiro Nakamura writes in report.

SMTB would also suffer greatest earnings hit, with a Toshiba impairment charge of 100b-190b yen shaving ~9.9% off bank’s current profit for fiscal year to March 31: SMBC Nikko ests.

If Toshiba impairment charge reaches over 400b yen, banks may conduct debt/equity swap; would lower near-term earnings impact while carrying risk of preferred shares losing value

In 3rd scenario, Toshiba could undertake private placement with strategic partner; major banks would be limited to funding support but could be asked to waive claims

Sumitomo Mitsui Trust shares fall as much as 4%, MUFG -2.6%, Mizuho -2.4%, SMFG -2.4%

Bitcoin Surges Above $900 on Geopolitical Risks, Fed Tightening

From Bloomberg.

Bitcoin headed for its biggest weekly jump since June as rising geopolitical risks boosted demand for alternative assets.

The cryptocurrency surged 15 percent this week to $900.40 as of 2:38 p.m. in Hong Kong, taking its gain this year to 107 percent, data compiled by Bloomberg show. The last time it was at such levels was in January 2014, when bitcoin was tumbling from its record price of $1,137 following the implosion of the MtGox exchange and tightening Chinese controls.


Bitcoin is extending a rally that’s beaten every major currency, stock index and commodity contract in 2016. Buyers sought alternative assets this week amid the killing of Russia’s envoy to Turkey and a separate attack that left 12 people dead in Berlin. Weakening pressure on the yuan, which intensified this month as the U.S. projected a faster pace of tightening next year following Donald Trump’s election win, is also increasing demand for bitcoin in China, where the majority of trading occurs.

“Terrorist attacks in Europe boosted haven demand in capital markets, and gold has been falling since Trump was elected,” said Le Xiaotian, an analyst at Huobi, a Chinese exchange. “Global instability has to a large extent directed funds to the bitcoin market.”

Bitcoin, which trades in cyberspace and is mined by code-cracking computers, is gaining popularity among some investors as an alternative safe haven because it’s deemed to be less influenced by government regulations and changes to monetary policy. Gold, which tends to trade in tandem with bitcoin when haven demand is strong, has fallen this quarter as U.S. rates rise, narrowing its premium over bitcoin to the least in three years.

“The Fed’s rate hike announcement has probably spooked a lot of emerging-market investors, particularly those in China, who are now flocking to bitcoin as a refuge from weak fiat currency assets,” said Thomas Glucksmann, head of marketing at Gatecoin Ltd. in Hong Kong. “As we’ve passed the $800 bitcoin price, a strong resistance point in the past, and move closer towards the psychological $1000 stratosphere, anything seems possible.”

Rates Plough Higher

Following the FED’s decision today, the benchmark T30 US Bond yield continues to move higher. A strong indicator that capital markets rates will continue to rise.  The FED is signalling more hikes next year, so yields will continue to climb. This has global significance.

The knock on effect for Australia is significant. Banks will have to pay more for their capital markets funding. International money market investors will switch money from Australia in favour of US markets, putting downward pressure on the AU$. This makes an RBA rate cut in 2017 even more remote (though some economists are still talking about 2 cuts!).

Mortgage rates here will continue to rise. Our outlook on the Property Market for 2017 took these rate movements into account.

Further evidence the world changed last month.


Delving Deeply into Currency and Derivatives Markets

The December 2016 BIS Quarterly Review: Delving deeply into currency and derivatives markets – has been released.

Trading on global currency and over-the-counter (OTC) derivatives markets continues to grow, but why are some segments thriving while others fall back?

The December 2016 issue of the BIS Quarterly Review examines the data collected earlier this year from close to 1,300 banks and other dealers in 52 jurisdictions as part of the Triennial Central Bank Survey of foreign exchange and OTC derivatives markets, the most comprehensive snapshot of the size and structure of these markets.

Three underlying themes emerge, said Hyun Song Shin, Economic Adviser and Head of Research: changes in the role and composition of market participants, the evolving role of emerging market economy (EME) currencies and monetary policy as a driver of market developments. These developments can in turn have an impact on the real economy. “What happens in financial markets does not always stay in financial markets,” Mr Shin said.

The December BIS Quarterly Review also:

  • Finds that the increase in global bond yields over the last few months has not caused major disruption in financial markets. Equity markets rallied and yields rose further as markets priced in a greater likelihood of fiscal expansion after the US presidential election. However, EME assets came under pressure.

    “Developments during this quarter stand out for one reason: for once, central banks took a back seat,” said Claudio Borio, Head of the Monetary and Economic Department. “It is as if market participants, for once, had taken the lead in anticipating and charting the future, breaking free from their dependence on central banks’ every word and deed.”

  • Presents new data from China and Russia, which have started to contribute to the BIS locational banking statistics. The new data show that banks in China are the 10th largest lenders in the international banking market and banks in Russia the 23rd largest.
  • Finds that differences in the regulations applying to different classes of derivatives partly explain why central clearing has become more entrenched in OTC interest rate derivatives markets than in other OTC markets.
  • Documents the increased use of the Chinese renminbi in financial trading. The shares of FX derivatives trading compared with spot trading, and of financial counterparties compared with non-financial counterparties, are approaching those of well established liquid currencies. The market for renminbi-denominated interest rate derivatives, however, remains small.

Five special features analyse currency and financial market developments:

  • Michael Moore (Warwick Business School), Andreas Schrimpf (BIS) and Vladyslav Sushko (BIS)* find that the downsizing of FX markets reflects a fall in the activity of “fast money” traders and hedge funds, and a drop in FX prime brokerage. In contrast, more long-term investors are hedging currency risk, supporting trading in FX derivatives. FX dealer banks are less willing to take on risk, and competition from non-bank market-makers has risen.
  • Torsten Ehlers and Egemen Eren (BIS)* argue that changing monetary policy stances helped drive a near doubling in the turnover of US dollar OTC interest rate derivatives, while euro-denominated contracts nearly halved. Exchange-traded markets continue to handle the majority of interest rate derivatives turnover, but are growing more slowly than OTC markets. Regulatory reforms have encouraged a move to central clearing and electronic trading and made OTC markets more similar to exchanges.
  • Christian Upper and Marcos Valli (BIS)* explore why derivatives markets for EME currencies and interest rates are smaller than their advanced economy counterparts. They argue that lower levels of financial development, less integration in the global economy and lower per capita income may be holding back growth in these markets.
  • Robert McCauley and Chang Shu (BIS)* explain that the rise of non-deliverable forwards (NDFs), contracts which allow hedging and speculation in a currency without providing or requiring settlement in it, masks significant differences across currencies, reflecting different paths of FX market development. While the internationalisation of China’s renminbi has favoured deliverable forwards over NDFs, such contracts have become more popular in the Brazilian real and Korean won.
  • Jonathan Kearns and Nikhil Patel (BIS)* use trade-weighted exchange rates and BIS-constructed debt-weighted exchange rates to assess competing forces influencing the impact that currency moves have on an economy. They find that exchange rate devaluation could damage rather than stimulate activity in emerging market economies where borrowers have a high share of foreign currency debt, probably because of the impact on their balance sheets.

* Signed articles reflect the views of the authors and not necessarily those of the BIS.

Twitter influences investor behaviour whether companies intend it to or not: new research

From The Conversation.

Companies that tweet corporate news and financial results can significantly affect stock prices even if the company’s tweets contain no new information beyond what is already posted through the stock exchange platform, my research shows.

I studied 3,516 corporate announcements published by Australian listed companies throughout 2008-2013 at the Australian Stock Exchange (ASX). I found that corporate information sent out on social media can unintentionally influence investor decisions in an unequal way.

mobile-pic

Investors often turn to communication and financial disclosure statements to make decisions on where to allocate money. While the volume of information that is disclosed is closely watched by the company law and listing rules, my research shows that breadth and depth of dissemination of financial information is equally important.

While a common belief is that prices in the market reflect all available information, the reality is far from this. Individual investors are limited in time and resources and are unable to track all securities and release of all new information.

So, companies that put extra effort to reach their investors are rewarded; they are able to grab the investors’ attention and lead them closer to the decision to invest. In line with this, there has been a recent influx in the business use of social media in Australia.

A report from the Australian Bureau of Statistics (2015) shows that near a third of all businesses have a social media presence, while almost half have some sort of web presence. For Australian listed companies, this number is even higher.

A 2013 report identified that 78% of Standard & Poor’s (S&P)/ASX 2005 companies use at least one social media channel and 66% intended to increase their social media activity. At the time, the leading position among social media belonged to Twitter (47%) and LinkedIn (58%). While LinkedIn is used predominantly for recruitment purposes, Twitter is more popular for company communication and investor relations.

My research shows that where social media presence is higher for larger businesses – companies that employ more than 200 people – the effect of web presence and social media is more pronounced than for smaller businesses. Smaller companies have less press coverage and financial analysts following and are generally less visible to investors. However, these less visible companies tend to be more effective in employing Twitter to engage with investors.

Australian companies exhibit different patterns of using Twitter. While large companies tweet more often, the smaller companies tend to share more hyperlinks and use more hashtags in their tweets.

While hashtags provide a way to label messages posted on Twitter, they are used to promote firms and specific topics making it easier to find and share information related to them. Similarly, hyperlinks usage in tweets is shown to increase retweeting, promote information diffusion and attract users’ attention.

Unlike other common ways to promote the existing financial information, for example business press and financial analysts, social media give companies more control. The company can send out more information and can establish a direct rapport with their existing or potential investors. Social media also allows companies to promote the release of financial information and engage with investors through multiple channels.

Jonathan Moylan (pictured) was behind a hoax spread via social media that wiped millions off Whitehaven Coal’s stock price in 2013. Dean Lewins/AAP

However, it is not always that simple. Social media can become a powerful weapon as well.

In 2012-13 several ASX-listed companies, including David Jones and Whitehaven Coal, suffered a significant drop in their stock prices due to market rumours spreading over social media channels. These cases led the ASX to introduce Guidance Note 8, which requires all ASX-listed companies to monitor social media for rumours and potential announcement leaks.

With additional corporate resources required to comply with this guidance, social media becomes a critical point that requires attention from the side of investors, companies, regulators and IT experts alike.

Author: Maria Prokofieva Senior lecturer in Accounting and Finance, Victoria University