Insider trading is greedy, not glamorous, and it hurts us all

From The Conversation.

Much of the focus on the insider trading case of Oliver Curtis has been on the titillating details of the man’s social life, his wife and past relationship with his partner in crime John Hartman. However all this misses the point, it’s not about what the pair gained and stand to lose from the insider trading, it’s what we all lost.

Last week Curtis was found guilty of insider trading. His unethical behaviour hurts your retirement wealth and damages the integrity of our investment systems. It’s true that he wasn’t an “insider” to the companies he was trading. He had no knowledge of CEO and Board decisions or other company-specific material price-sensitive non-public information.

Rather, Curtis was receiving non-public information about buying and selling taking place at a friend, John Hartman’s, funds management firm. The firm Hartman worked for, Orion Asset Management, managed around $6 billion of funds at the time and the trades Hartman was privy to were often sufficiently large to affect prices.

The illegal trading took place through 45 buys and sells of “contracts for difference’ (CFDs) between May 2007 and June 2008. In simple terms, CFDs are securities which allow the holder to bet on stock gains and losses.

Most trades don’t affect prices, in a way that most fish don’t create waves. Large value ‘block’ trades though can impact prices like a humpback whale breaching.

Curtis was “front-running” these large trades using CFDs. Front running is a practice of placing orders ahead of upcoming block trades in order to benefit from the anticipated up or down movement it will have on the stock price. ASIC estimated the net profits Curtis made through this strategy amounted to over $1 million.

What’s the problem?

While there are legal forms of front running and insider trading, the kind of trading undertaken by Curtis is illegal for good reason. It is widely considered unethical, adds to the costs of investing, and destabilises core financial systems.

It is hard to believe Curtis and Hartman did not know they were breaking the law, particularly given Hartman’s testimony and the unambiguous wording. The ethics of insider trading, however, can be more complex.

In 1990, Jennifer Moore argued that the key ethical considerations are: fairness, ownership of property rights, and harm. Curtis was unethical in each of these ways.

Curtis and Hartman took advantage of an unfair access to information that the rest of the market didn’t have about large pending trades. Hartman’s employer owned the rights to that information and did not grant permission for that information to be shared.

While there appeared to be no victims, front running reduces the potential profits for those outside the illegal trade. In other words, other market participants were disadvantaged.

That disadvantage translates to added costs of investing and lower returns for everyone else. That includes the $350 billion of ordinary Australians’ superannuation wealth tied up in ASX traded securities.

This is the first major point that has been lost with the misdirected focus on the socialite’s Instagram pages.

Destabilising the system

The second and even more critical risk, however, is the potential erosion of the integrity of our financial systems. Lawful investors may shift their portfolios to other markets if they consider that there may be other illegal insider traders like Curtis still out there. Why play in system rigged against you?

One argument thrown up as a defence for insider trading is that if the insiders bring information to the market sooner, then prices will be more efficiently priced. There is little empirical evidence to indicate this works in reality.

Stock price efficiency is based on what is known about a company. Prices are most efficient when they reflect all known information, and “discovering” this efficient price is when new information (such as earnings announcement, CEO retirement, etc) becomes known.

Recent research on this topic in the U.S. found that insiders benefit for themselves with little of their inside information spilling over to benefit the public through more efficient prices. Strict regulation deters illegal insider trading with minimal adverse impact on this price discovery process.

The unscrupulous will continue to pursue ways to counter regulations. Recent studies detecting shifts in informed trading away from more heavily monitored equities markets to derivative and bond markets (which currently have less public data monitoring) point to this.

The public should expect more from those managing their wealth. Glamourising the lifestyles of those who have broken the law and acted unethically damages the good work being done by many others in our financial institutions. Illegal insider trading is not a victimless crime and we should not let tabloid distraction make us forget that.

Author: Danika Wright, Lecturer in Finance, University of Sydney

Older Investors Most Likely To Be Scammed

ASIC says “The Targeting Scams report published today shows losses reported to the Scamwatch website from investment scams doubled in 2015. ASIC is alerting the public to the ways they can protect themselves from scams that are designed to steal their money,” ASIC’s Deputy Chairman Peter Kell said.

“The ScamWatch data published by the ACCC indicates that a wide variety of scams, including investment and ‘get rich quick’ scams, continue to hit Australians. Overseas based scammers in particular commonly target consumers in wealthier countries such as Australia. People over 55, many of whom are looking for investment returns in a low interest rate environment, are often most at risk,” he said.

“ASIC received 367 reports about scams in 2015, although in our experience scams are often under reported.  The number of Australians contacted by scammers, and the amounts of money lost, are likely to be much larger than what is reported to us.”

In 2015 the top five types of scams reported to ASIC were:

  • overseas cold calling about investment opportunities;
  • overseas calls offering easy credit or loans after payment of an upfront fee;
  • sports arbitrage or gambling schemes;
  • money transfer schemes (job opportunity or other fraud); and
  • fake debt and invoice scams.

“The scams reported to ASIC generally come from overseas. In many cases the pitch to consumers is so professional, slick and believable that it is hard to tell these are not genuine financial opportunities. Scammers have sophisticated sales practices that include call scripts, false paperwork, fake websites and made-up referees,” Mr Kell said.

Typically, investment and financial scams will offer:

  • High, quick returns and sometimes tax-free benefits;
  • Big rewards for what seems a small upfront payment;
  • Discounts for early bird investors;
  • ‘No risk’ or ‘low risk’ investments, where ‘you can sell anytime’, get a refund for non-performance or have ‘guaranteed’ transactions;
  • Inside information or the opportunity to invest before a public float; or
  • ‘Magic’ software that claims to predict sporting results or promises to makes you rich through active share trading.

During Consumer Fraud Week 2016, the Australian Securities and Investment Commission is warning consumers and investors to ‘Wise Up to Scams’ and do some simple checks before they part with their money.

Developments in financial market liquidity

The Reserve Bank of New Zealand today published a Bulletin article that looks at liquidity in financial markets.

In recent years, financial market participants have become increasingly worried that the level and resilience of financial market liquidity has declined significantly, raising concerns over the efficiency of markets and increased the risks associated with a liquidity shock.

This article reviews international research on the topic, and generally finds evidence for a decline in the level and resilience of liquidity, although it has been mixed across markets. We also assess liquidity conditions in the New Zealand government bond, funding and short-term money markets using common analytical measures of liquidity as well as drawing on discussions with numerous market participants. We find that liquidity has declined to varying degrees across the different markets, and while risks of a liquidity shock have risen, the decline has been manageable thus far.

Liquidity is a complex concept, with the term encompassing a range of ideas. There are three main types of liquidity in financial markets: market liquidity, which reflects the ability of market participants to execute large transactions at low cost with only a limited effect on the price; funding liquidity, which refers to the ability of an organisation (such as a bank) to raise debt as required at a reasonable cost; and monetary liquidity, which reflects the looseness of monetary conditions, in part owing to the stance of central banks. This article focuses primarily on developments in market liquidity, although funding and monetary liquidity are also discussed where relevant.

Market liquidity is important for the functioning of financial markets, helping to facilitate the efficient distribution of resources through the allocation of capital and risk. A lower level of market liquidity can reduce these efficiencies, potentially inhibiting economic activity. While the level of liquidity in a market is important, the resilience of liquidity in a market is also key, especially in the face of a shock. The IMF note that highly resilient market liquidity is critical to financial stability, because it means market prices are less prone to sudden sharp swings, and more likely to remain aligned with values determined by fundamental factors.

Growing concerns about liquidity from market participants have been stimulated by a number of “shock” events over the past few years. Events such as the October 2014 Treasury market “flash rally” and the April 2015 “Bund tantrum” saw rapid moves in bond prices over short periods of time that did not appear to be explained by fundamentals. These moves are seen by many as evidence of reduced liquidity in some key markets.

While bond market liquidity has been a key focus for several studies, liquidity concerns are not confined to this asset class. Foreign exchange markets have also been affected – including for the New Zealand dollar. For example, the NZD/USD cross rate on 25 August 2015 (NZ time) fell as much as three cents over 10 minutes, before quickly rebounding.

We found that international research into recent liquidity developments generally identified a decline in market liquidity, although this was not evident in all markets. There is also evidence that the resilience of liquidity has declined in some markets, increasing financial stability risks. The primary drivers for the decline in liquidity have been increased regulations on market makers and a changing market structure.

Extraordinarily easy monetary policy on balance has added to liquidity, and is likely masking the full structural decline in liquidity. This means lower financial market liquidity may become even more apparent when major central banks eventually tighten monetary conditions again.

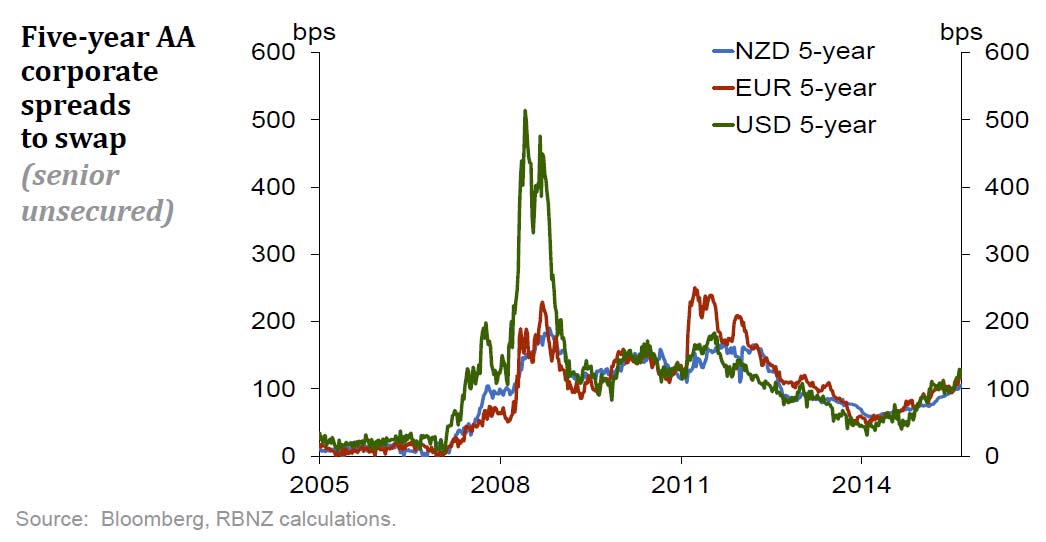
The banks have noted that the ‘new issue premium’ they pay has generally increased over the past year, as global market uncertainty and volatility has increased, although these costs had been manageable thus far. The increase in cost can be illustrated below, which shows the spread above swap for senior unsecured five-year AA corporate bond yields, a similar type of debt to what banks issue. While there is the potential for liquidity problems to worsen over time, banks are actually in a relatively good position at present with their funding, in large part owing to the Core Funding Ratio regulations. This has meant that banks have a larger buffer in their funding, and if they do miss a window of funding owing to market conditions, then they are less exposed, particularly to rollover risk.

NZ-LiquidityWe examined liquidity developments in three key areas of New Zealand financial markets: the New Zealand government bond market, bank funding markets, and short-term money markets. Overall, we found that liquidity has declined across these markets, but to varying degrees. In New Zealand government bond markets, we found mixed evidence for declines in market liquidity, with one measure indicating declines, while others pointed to little change. Nevertheless, market makers we spoke to noted they had seen a decline in liquidity in the market, although had been able to ‘absorb’ it this far, allowing investors to trade as normal.

Nevertheless, risks have risen that additional market makers may choose to participate less in the market owing to an increased regulatory burden, exacerbating poor liquidity conditions further and raising costs for investors and the NZ government.

Funding liquidity in New Zealand’s bank funding market has only modestly diminished over the past year, owing primarily to greater market volatility caused by events such as the Greek crisis in 2015. However, these costs have been manageable thus far, and regulations such as the Core Funding Ratio and more conservative bank risk appetites mean that banks are more resilient than prior to the global financial crisis to shocks to funding markets.

Finally, we identified a notable decline in liquidity in New Zealand shortterm FX swap markets, which resulted in higher volatility and key interest rates being out of line with the OCR for longer. In short-term markets the effect of new regulation has caused some market participants to withdraw. In response, the Reserve Bank has chosen to increase its participation in the FX swap market, which appears to have contributed to an improvement in market conditions.


ASIC commences civil penalty proceedings against Westpac for BBSW conduct

ASIC says it has today commenced legal proceedings in the Federal Court in Melbourne against Westpac Banking Corporation (Westpac) for unconscionable conduct and market manipulation in relation to Westpac’s involvement in setting the bank bill swap reference rate (BBSW) in the period 6 April 2010 and 6 June 2012.

The BBSW is the primary interest rate benchmark used in Australian financial markets, administered by the Australian Financial Markets Association (AFMA). On 27 September 2013, AFMA changed the method by which the BBSW is calculated. The conduct that the proceedings relate to occurred before the change in methodology.

It is alleged that Westpac traded in a manner intended to create an artificial price for bank bills on 16 occasions during the period of 6 April 2010 and 6 June 2012.

ASIC alleges that on these days Westpac had a large number of products which were priced or valued off BBSW and that it traded in the bank bill market with the intention of moving the BBSW higher or lower. ASIC alleges that Westpac was seeking to maximise its profit or minimise its loss to the detriment of those holding opposite positions to Westpac’s.

ASIC is seeking declarations that Westpac contravened s.12CA, s.12CB and the former s.12CC of the Australian Securities and Investments Commission Act 2001 (Cth) (ASIC Act), s.912A(1), s.1041A  of the Corporations Act 2001 (Cth) (Corporations Act).

Further, ASIC has sought from the court pecuniary penalties against Westpac and an order requiring Westpac to implement a compliance program.

ASIC will be making no further comment at this time.

Background

On 4 March 2016, ASIC commenced legal proceedings in the Federal Court against the Australia and New Zealand Banking Group (ANZ) (refer: 16-060MR).

Prior to filing against ANZ, ASIC’s investigations into misconduct in the BBSW has seen ASIC accept enforceable undertakings from UBS-AG, BNP Paribas and the Royal Bank of Scotland (refer: 13-366MR, 14-014MR, 14-169MR). The institutions also made voluntary contributions totalling $3.6 million to fund independent financial literacy projects in Australia.

In July 2015, ASIC published Report 440, which addresses the potential manipulation of financial benchmarks and related conduct issues.

Federal Reserve Board proposes rule to address risk associated with excessive credit exposures of large banking organizations to a single counterparty

The Federal Reserve Board on Friday proposed a rule to address the risk associated with excessive credit exposures of large banking organizations to a single counterparty. As demonstrated during the financial crisis, large credit exposures, particularly between financial institutions, can spread financial distress and undermine financial stability.

The proposal would apply single-counterparty credit limits to bank holding companies with total consolidated assets of $50 billion or more. The proposed limits are tailored to increase in stringency as the systemic footprint of a firm increases:

  • A global systemically important bank, or G-SIB, would be restricted to a credit exposure of no more than 15 percent of the bank’s tier 1 capital to another systemically important financial firm, and up to 25 percent of the bank’s tier 1 capital to another counterparty;
  • A bank holding company with $250 billion or more in total consolidated assets, or $10 billion or more in on-balance-sheet foreign exposure, would be restricted to a credit exposure of no more than 25 percent of the bank’s tier 1 capital to a counterparty;
  • A bank holding company with $50 billion or more in total consolidated assets would be restricted to a credit exposure of no more than 25 percent of the bank’s total regulatory capital to another counterparty;
  • And bank holding companies with less than $50 billion in total consolidated assets, including community banks, would not be subject to the proposal.

“We are determined to do as much as we can to reduce or eliminate the threat that trouble at one big bank will bring down other big banks,” said Federal Reserve Board Chair Janet L. Yellen.

Similarly tailored requirements would also be established for foreign banks operating in the United States.

“This regulation would complement overall capital requirements, which are generally based on the size and nature of a bank’s assets, but do not address the concentration of risk in specific borrowers or counterparties,” Governor Daniel K. Tarullo said.

The proposed rule implements part of the Dodd-Frank Act and builds on earlier proposals released by the Board in 2011 and 2012, and includes some modifications based on comments received. Additionally, the proposal seeks to promote global consistency by generally following the international large exposures framework released by the Basel Committee on Banking Supervision in 2014.

The Board on Friday also released a white paper explaining the analytical and quantitative reasoning for the proposed rule’s tighter 15 percent limit for credit exposures between systemically important financial institutions. Because systemically important financial institutions are generally engaged in similar activities and exposed to similar risks, the paper discusses why systemically important firms are more likely to come under stress at the same time and, as a result, generally incur more risk when exposed to other systemically important firms compared to non-systemically important counterparties.

Comments on the proposed rule are invited until June 3, 2016.

Is It Time For A Risk-Free Interest Rate Benchmark In Australia?

The principal interest rate benchmark in Australia is the bank bill swap rate (BBSW), but there are questions about its accuracy (and we know overseas, other benchmark rates – such as LIBOR – have been rigged). So Guy Debelle RBA Assistant Governor (Financial Markets) spoke at the KangaNews Debt Capital Markets Summit  and both discussed domestic reforms around the benchmark, and mentioned the possibility of introducing a ‘risk-free’ interest rate for the domestic market, as a complement to BBSW. He did not talk about the investigations that ASIC is currently undertaking into conduct around BBSW.

Given its wide usage, BBSW has been identified by ASIC as a financial benchmark of systemic importance in our market. It is important there is ongoing confidence in it. Without that, we have a serious problem, given its integral role in the infrastructure of domestic financial markets.

As you may know, BBSW was calculated for a number of years by, each day, asking a panel of banks to submit their assessment of where the market was trading in Prime Bank paper at a particular time of the day. While it was a calculation based on submissions, it differed from LIBOR in that BBSW submitters were asked about where the market for generic Prime Bank paper was trading that day. In contrast, LIBOR submitters were asked about where they thought their own bank’s cost of funds was that day.

In response to the prospect of a large number of the participants on the submission panel no longer being willing to provide submissions, the calculation of BBSW was reformed in 2013 in line with the IOSCO Principles for Financial Benchmarks, which were issued in July 2013.

Since 2013, the Australian Financial Markets Association (AFMA) has calculated BBSW benchmark rates as the midpoint of the (nationally) observed best bid and best offer (NBBO) for Prime Bank Eligible Securities, which are bank accepted bills and negotiable certificates of deposit (NCDs). Currently, the Prime Banks are the four major Australian banks. The rate set process uses live and executable bid and offer prices sourced from interbank trading platforms approved by AFMA, These platforms are currently ICAP, Tullett Prebon and Yieldbroker. The bids and offers are sourced at three points in time around 10.00 am each day.

Trading activity during the daily BBSW rate set has declined over recent years to very low levels. There are quite a number of days where there is no turnover at all at the rate set. The low turnover in the interbank market raises the risk that market participants may at some point be less willing to use BBSW as a benchmark. This is the motivation for the CFR’s consultation to ensure that BBSW remains a trusted, reliable and robust financial benchmark.

sp-ag-2016-02-22-graph2

The likely key change to the methodology proposed is to calculate BBSW directly from market transactions – that is, calculating BBSW as the volume-weighted average price (VWAP) of market transactions during the rate set window. Given the objective is to better anchor BBSW to transactions in the underlying market, the RBA  supports moving the calculation methodology to the VWAP.

With regards to the risk-free benchmark:

Next I would like to briefly raise some issues around whether the use of BBSW needs to be quite as widespread as it is. In a number of instances, BBSW has become the default reference rate without much thought being given as to whether it is the most appropriate reference rate. BBSW is a credit‑based reference rate. It is based on the borrowing costs of the major banks, with the credit risk that entails embodied in the rate.

For a number of purposes, a credit‑based rate is completely appropriate. However, for other purposes, a rate that is closer to risk‑free may be more appropriate. For instance, in recent years, market participants have moved to use overnight-indexed swap (OIS) rates more often when discounting the cash flows in their swaps. The FSB, through its official sector steering group (OSSG) on benchmark reform, is encouraging market participants to contemplate switching from credit‑based benchmark rates like BBSW or LIBOR to risk‑free rates, where appropriate.

In the local market, there appears to be growing interest in using risk-free rates as benchmarks. Such a rate could be backward looking, like the cash rate, or forward looking, like OIS rates. As a first step, some market participants have indicated that a total return index of the cash rate would be a useful backward-looking benchmark. Implementing this would be straightforward, since the RBA already calculates and publishes the cash rate. Some market participants are also interested in referencing a forward-looking rate with equivalent tenors to BBSW, and we will continue to work with AFMA on the development of such a benchmark.

One example where a change in reference rate could be contemplated is for floating rate notes (FRNs) issued by governments. FRN coupon payments are typically priced at a spread to BBSW. While referencing BBSW makes sense for FRNs issued by banks, it is less clear why governments should tie their coupon payments to a measure of bank funding costs.

That is one example worthy of consideration. There are a number of others. I know this is not necessarily an issue you may have thought that much about until now. At the very least, I would encourage you to at least ask the question whether the product you are issuing or holding is using the most appropriate reference rate.

Global Financial Links, Risks and Safety

The Bank of England just published Financial Stability Paper No. 36 – February 2016 “Stitching together the global financial safety net”. The paper illustrates the highly connected state of banks, central banks and other entities, and discussed some of the consequences of such linkages, and the safety nets which exist to protect these structures. The paper highlights risks from vulnerabilities in external balance sheets which leave countries exposed to volatility in cross-border capital flows and increase potential demands on the safety net. A timely discussion, in the light of current market volatility.

Financial globalisation and the expansion in global capital flows bring a number of benefits — more efficient allocation of resources, improved risk sharing and more rapid technology transfer. But they can also increase the risk of financial crisis. Indeed, the current market volatility is partly a reaction to the global risks.

On a net basis, more gross capital inflows than outflows have allowed many countries to run current account deficits. Global current account imbalances (measured as the sum of the absolute values of all current account surpluses and deficits) tripled from around 2.3% of global GDP between 1980 and 1997 to 5.5% of global GDP in 2006–08 and were 3.5% in 2014. But net flows concealed even larger increases in gross flows.

On a gross basis, the boom in global capital flows has provided additional sources of finance for governments, banks, corporates and households. This may have increased the efficiency of capital allocation, with capital increasingly able to flow to where it is most productive. Gross capital flows increased to over 20% of global GDP in 2007 up from around 3% in 1980. Cross-border banking was one of the main drivers of this increase in cross-border flows.

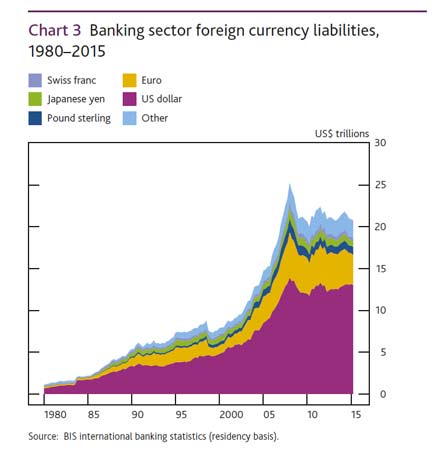
Borrowing in foreign currency often complicates adjustment. International banks’ borrowing in foreign currency (both domestically and cross-border) has doubled since 2002, despite a 20% reduction since the peak in 2008. There are now over US$20 trillion foreign currency denominated bank liabilities (Chart 3). And since 2008, outstanding US dollar denominated credit to non-banks outside of the United States has almost doubled to US$9 trillion.

Foreign-LiabilitiesThere is a flip side to the rapid rise in cross-border capital flows and external assets and liabilities — countries are more exposed to the willingness of foreign investors to continue funding their financing needs. Cross-border capital flows can be fickle, with foreign investors withdrawing funding in the event of an economic or financial crisis. Concerns about an increase in foreign currency borrowing in emerging markets through international bond markets — mainly by the corporate sector — have recently been centre stage in debates about global financial stability.

In recent years, to reduce these risks to stability, countries have reformed financial regulation, enhanced frameworks for central bank liquidity provision and developed new elements, and increased the resources, of the global financial safety net (GFSN).

A comprehensive and effective GFSN can help prevent liquidity crises from escalating into solvency crises and local balance of payments crises from turning into systemic sudden stop crises. The traditional GFSN consisted of countries’ own foreign exchange reserves with the IMF acting as a backstop. But since the global financial crisis there have been a number of new arrangements added to the GFSN, in particular the expansion of swap lines between central banks and regional financing arrangements.

Swap lines are contingent arrangements between central banks to enter into foreign exchange transactions. The liquidity-providing central bank provides its domestic currency for a fixed term at the market exchange rate, in exchange for the currency of the recipient central bank. On maturity, the transaction is unwound at the same exchange rate so, provided each party repays, neither party has direct exposure to exchange rate risk. The liquidity-providing central bank bears the credit risk of the borrowing central bank. In the event that the borrower is unable to repay, the lender is exposed to the exchange-rate risk on the currency taken. Swap lines can also involve the liquidity provider lending to the borrowing central bank in a foreign currency. In this case, the liquidity providing central bank lends its FX reserves in return for the borrower’s domestic currency, providing wider access to hard currency FX reserves.

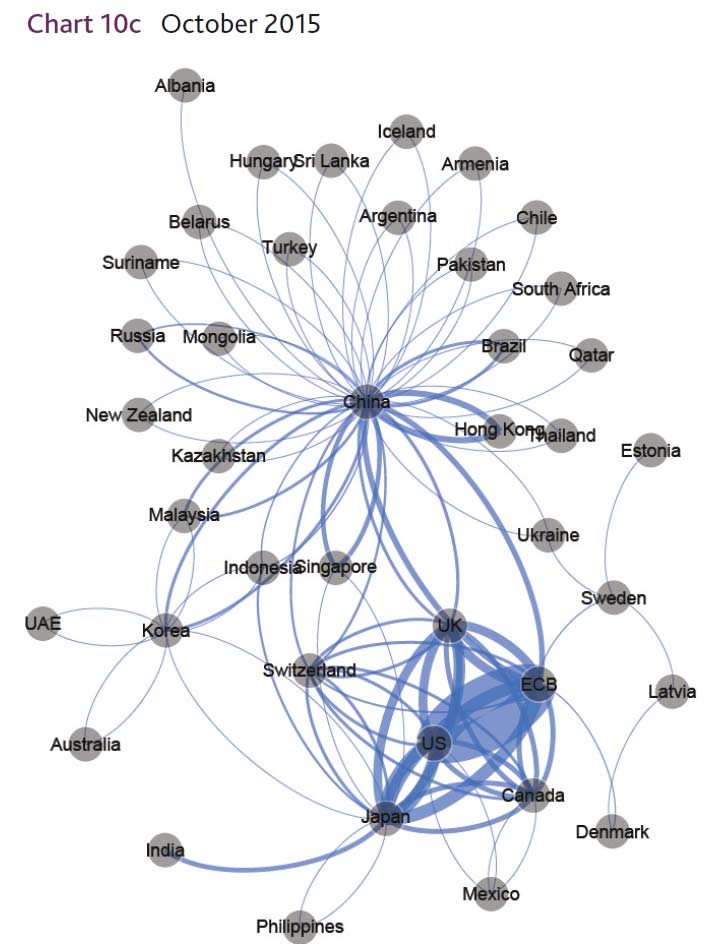
Since the global financial crisis there has been a proliferation of swap lines. By October 2008, in response to the seizing up of global financial markets, the Federal Reserve (Fed) had extended swap lines to fourteen countries. Many of these have subsequently expired and not been replaced. The peak aggregate usage across all borrowers was US$586 billion in December 2008. The Bank of England drew US$95 billion from the Fed, which was on-lent to UK resident financial institutions. Other notable facilities were euro-denominated swaps by Sweden and Denmark to Latvia in December 2008, which they extended while simultaneously having swap arrangements with the ECB. And a Swiss franc denominated swapline between the ECB and SNB which was introduced in October 2008. Since 2007 the number of non-Chiang Mai central bank swap arrangements has increased from 6 to 118 (Charts 10 and 11), and involve 42 central banks. Those with a formal limit total US$1.2 trillion.

Bilateral-SwapsThe new look GFSN is more fragmented than in the past, with multiple types of liquidity insurance and individual countries and regions having access to different size and types of financial safety nets. These new facilities provide many benefits, such as increasing the resources available to some countries and providing additional sources of economic surveillance. However, many facilities have yet to be drawn upon and variable coverage risks leaving some
countries with inadequate access.

This paper consider the features, costs and benefits of each of the components of the GFSN and whether the overall size and distribution across countries and regions is likely to be sufficient for a plausible set of shocks. We find that the components of the GFSN are not fully substitutable: different elements exhibit different levels of versatility, have been shown to be more or less effective depending upon the circumstances, have different cost profiles and have different implications for the functioning of the international monetary and financial system as a whole. We argue that while swap lines and RFAs can play an important role in the global financial safety net they are not a substitute for having a strong, well resourced, IMF at the centre of it.

By running a series of stress scenarios we find that for all but the most severe crisis scenarios, the current resources of the GFSN are likely to be sufficient. However, this finding relies upon the IMF’s overall level of resources (including both permanent and temporary) being maintained at their current level.

Our analysis also highlights that the aggregation of global resources can mask vulnerabilities at the country, and even regional, level. In other words, while the current safety net might be big enough in aggregate, there is a risk that, for large enough shocks, gaps in coverage could be revealed. Steps should be taken to ensure the different components of the safety net function effectively together to reduce the risk of gaps appearing.

Policymakers should consider measures which (i) reduce vulnerabilities in external balance sheets which leave countries exposed to volatility in cross-border capital flows and increase potential demands on the safety net; (ii) secure the  availability of appropriate GFSN resources, including the IMF’s resource base; and (iii) make more efficient use of the current GFSN resources by ensuring the elements of the GFSN more effectively complement
one another.

Revised Model-Based Market Risk Rules Costly for Banks – Fitch

The overhaul of the internal models approach – used by most banks with large trading books to calculate market risk capital requirements – will be costly, says Fitch Ratings. The Basel Committee on Banking Supervision’s revised market risk framework, published in January and effective from 2019, fundamentally changes the approach.

The model revisions should improve risk assessment capabilities, lead to higher capital charges for hard-to-model trading positions and make it easier to compare banks’ results. But the model approval process and governance are being thoroughly revised and implementing the changes will require considerable investment in technology and risk management.

Banks will need to obtain approval for internal models desk by desk, rather than bank-wide. This will make it easier for supervisors to decline approval for a particular trading desk, if, for example, the desk is unable to satisfy model validation criteria due to back-testing failures or an inability to properly attribute profits and losses across products. But Fitch thinks costs associated with building and running the more sophisticated models will be high.

Instead of running a single bank-wide model for a range of stressed and unstressed risk factors, multiple new models will need to be built, validated and run daily. This will multiply the number of model reviews and operational runs and add to subsequent data analysis and reporting procedures. Additional risk personnel will be required for review, oversight, and reporting purposes.

The amount of regulatory capital models-based banks will need to cover potential market risks following the revisions is uncertain. The Basel Committee’s latest studies show that, for a sample of 12 internationally active banks with large trading books, all of which provided high-quality data, market risk capital charges under the revised approach were 28% higher. But for a broader sample of 44 banks using internal models, the median market risk capital requirements fell by 3% under the revised models.

Fitch thinks the result for the 12 banks could reflect greater concentrations of less liquid credit positions that require more capital, or larger trading positions lacking observable transaction prices, which are subject to a stressed capital add-on. Banks facing higher charges under the regime may re-assess whether certain activities remain profitable.

The new internal models approach replaces value at risk (VaR) with an expected shortfall (ES) measure. VaR does not capture the tail risk of loss distribution, which can arise during significant market stress. The use of ES models for regulatory capital is positive for bank creditors because they could lead to better capitalisation of tail-risk loss events and might motivate risk managers to limit trading portfolios that could lead to outsized losses.

When calculating ES measures, banks will have to use variable market liquidity horizons – to a maximum of 120 days for complex credit products, against the current fixed 10-day period. We think model inputs will be more realistic, by acknowledging that some instruments take longer to sell or hedge without affecting prices. ES will also constrain recognition of diversification and hedging benefits, extensively used in VaR models to reduce capital charges. We think this will make model outputs more prudent and force banks to better capitalise potential trading losses.

Structural flaws in the way banks calculated capital charges for market risk were exposed during severe market stresses in 2008-2009. The Basel Committee subsequently undertook a fundamental review of the trading book. The original proposals were watered down, but we think the final revised minimum capital standards for model-driven market risk are positive for creditors because improved model standards and more prudent methods employed to capture risk should mean trading risks are more accurately capitalised.

How blockchain technology is about to transform sharemarket trading

From The Conversation.

Recently the Australian Securities Exchange (ASX) bought a $15 million stake in Digital Asset Holdings, a developer of blockchain technology. One of the main reasons is to upgrade its share registry system by using blockchain or distributed ledger technology.

And it’s been reported that JP Morgan Chase is also partnering with Digital Asset Holdings to trial the technology.

What is blockchain/distributed ledger technology?

Put simply, blockchain technology is a method of recording and confirming transactions where instead of a centralised platform, participants each hold a complete record of transactions through peer to peer verification of transactions. This means there is no central recording system, rather each participant keeps a record of all transactions ever made. This is the same system which allows Bitcoin to operate with no central body.

How would blockchain technology be adopted at the ASX?

Instead of the ASX clearing house settling trades, trades will be settled by participants confirming transactions through the peer to peer network. The network (likely made up of brokers) will record the buyer and selling participants, the number of shares traded, price of shares, time of exchange and the exchange of funds. The ASX will still provide a centralised electronic exchange for participants to place orders, only the settlement or back office function will be sourced to the network.

The benefits?

Blockchain has great potential to cut inefficiencies in the share settlement function. As trades are settled by peer confirmation, there is no need for a clearing house, auditors to verify trades and custodians to ensure a fund has the shares they say they hold. Essentially this is cutting out the middleman in the back office which means less costs in record keeping and in turn less costs to trading on the ASX. Given the high costs in getting a third party to audit, record keep and/or verify trades these costs are substantial.

The peer confirmation of trades also means settlement can be almost instantaneous. Compare this to the current settlement period of three working days (‘T+3’) as the ASX needs to make sure the participants have the money and shares on hand to exchange. This would make shares a far more liquid investment – almost as good as having cash on hand. Higher liquidity means more investment into ASX shares.

As all participants have the full record of transactions and therefore holdings of investors there is complete transparency in the equity market. This makes it almost impossible to falsify transactions or to alter prior transactions. If a false trade occurs, participants will find inconsistencies in their full ledger and reject the trade. For example an investor would be unable to sell stock that they did not own as all participants would know exactly how much stock the investor owns now.

The challenges?

First, implementing a clearing system using blockchain will introduce a new type of fee. In the Bitcoin blockchain, miners process Bitcoin transactions by solving optimisation problems and get rewarded by newly created Bitcoins and settlement fees offered by Bitcoin users who wish to have their transactions processed.

Miners prioritise the order of transactions to be cleared based on the fees offered and the difficulty of the problems to record the transaction in a block. This is what allows a blockchain to have no centralised clearing house.

If the ASX blockchain requires investors to include transaction fees in order for their transactions to be cleared, then the ASX is transferring the cost of maintaining the back office to the investors. If this is to happen, investors will have to compete against each other to have their transactions cleared faster than those of others. Alternatively, if the new system doesn’t allow such fees and relies on brokers or other entities to clear the transactions, then the ASX is again transferring the cost of maintaining back office to those entities.

The second concern is increased transparency. Under the proposed trading system, most of positions of the market participants could be exposed to the public as the trading ID can be identified. This could disadvantage many investors such as super, managed and hedge funds. For example, a super fund typically sells a large position on a gradual basis for a prolonged time period.

In this process, it is critical not to be noticed by other traders who may take advantage of such large-scale sales. With complete transparency such as in blockchain, such a sell-off could not be applied effectively. Potentially this may make investors leave the ASX and seek more opaque venues to trade such as dark pools.

Will it work?

Clearly a direct adoption of blockchain from Bitcoin technology would not be viable for the ASX. If the ASX is able to adopt blockchain technology and address privacy, security and trade transparency concerns then this would yield great cost savings to investors.

Authors: Adrian Les, Senior Lecturer in Finance, University of Technology Sydney; KIHoon Hon,  Assistant Professor, University of Technology Sydney

ANZ extends partnership with Macquarie to provide wrap solutions

ANZ today announced it has entered into an agreement for Macquarie Investment Management Limited to develop a new wrap platform for ANZ’s advice partners that will be available from May 2016.

As part of the agreement, Macquarie will also provide administration services that are currently delivered through ANZ’s wholly owned business, Oasis.

As services are transitioned to Macquarie, staff numbers in the Oasis business will be progressively reduced over the next 18 months. At the end of the transition the majority of services provided by the 146 roles currently supporting the Oasis business will be provided by Macquarie.

ANZ Managing Director Pensions and Investments Peter Mullin said: “Detailed plans are being developed to support staff during the transition, which ensures they have time, support and notice to consider other options. Their entitlements are protected and a full range of career support services will be provided.

“The decision to partner with Macquarie was made following an extensive business and market review and is the right decision for our customers. We are now focussed on making sure the transition to the new business is done in a respectful and well-organised manner,” Mr Mullin said.

Oasis currently has $6.9 billion in funds under management and serves more than 50,000 customers. Transition of the Oasis wrap platform to Macquarie’s technology and administration services is expected to take up to 18 months.