ASIC Says High-Frequency Trading and Dark Liquidity Is OK

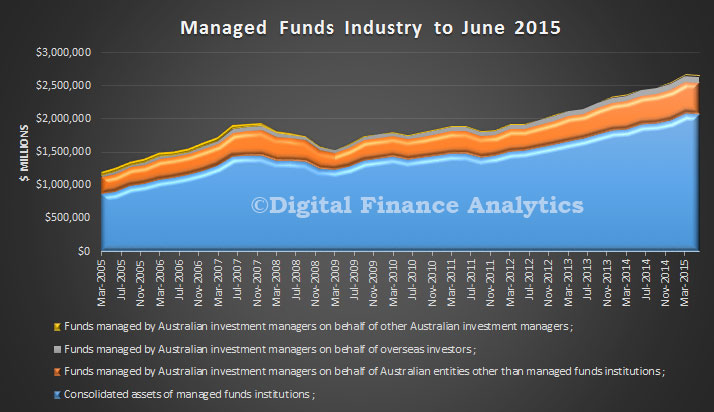
High-frequency trading and dark liquidity have been two of the most topical market structure issues globally over recent years. During 2015, ASIC have undertaken two new reviews of high-frequency trading and dark liquidity. The aim of these reviews has been to update and build on their earlier analysis of equity markets and to assess the effect of high-frequency trading on the futures market.

No further regulation specifically addressing high-frequency trading or dark liquidity is proposed at this stage but ASIC says they will continue to monitor developments involving these and other markets issues.

The 2015 reviews involved:

(a) stakeholder engagement, including over 40 meetings with fund managers, market participants, high-frequency traders and market operators. Over 20 separate meetings on principal trading and facilitation with market participants, fund managers and overseas regulators;
(b) in-depth analysis of equity and futures order and trade data; and
(c) literature review, including research by academics and other regulators

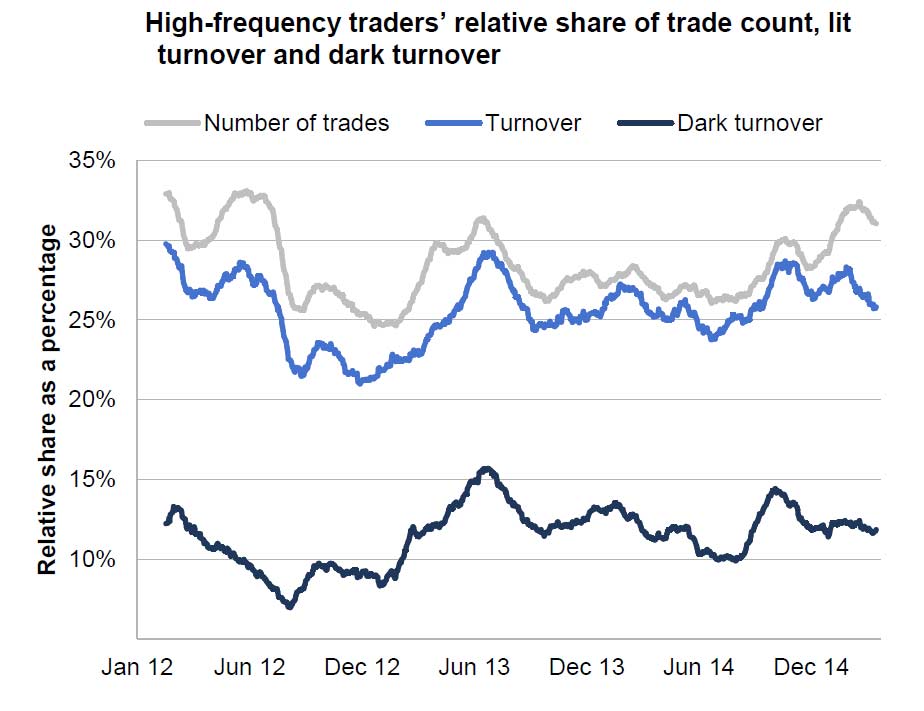
High frequency trades make up more than 30% of all trades, and dark turnover is sitting at about 12%.

ASIC-HFT-Oct-2015ASIC’s Key Findings

High Frequency Trading – Equity Markets

  1. The level of high-frequency trading in our equity markets is reasonably steady at 27% of total turnover (this is comparable to Canada, the European Union and Japan).
  2. However, the concentration of high-frequency trading in our markets is higher, with 30% fewer high-frequency trading accounts. Trading is also more active in mid-tier securities than in 2012.
  3. High-frequency traders are trading somewhat more aggressively than in 2012, while still contributing significantly to the orders at the best displayed prices. Average holding time is between 50 and 60 minutes.
  4. High-frequency traders appear to have become more sophisticated. Compared to 2012, they are better at avoiding interacting with one another and they are extracting larger gross trading revenues. ASIC estimate that they earned $110–180 million in aggregate over the 12 months to 31 March 2015. This translates to a cost of 0.7 to 1.1 basis points to other market users. This is material, but substantially less than other figures suggested by some, and less than some other trading costs (e.g. average bid–offer spreads are 13 basis points).
  5. High-frequency trading does not appear to be a key driver of transaction costs. It appears that higher levels of high-frequency trading assist in lowering transaction costs for low turnover securities.
  6. Some concerns about predatory trading remain (i.e. where trading is undertaken to exploit others or unfairly induce them to trade). While not excessive in our markets, predatory trading can adversely affect the trading outcomes for fundamental investors (those who buy or sell on an assessment of intrinsic value). Fundamental investors remain ASIC’s regulatory priority and unchecked predatory trading can undermine our objectives for those investors to have confidence and trust in our markets and for our markets to be fair, orderly, transparent and efficient.

High Frequency Trading – Futures market

  1. High-frequency trading has grown rapidly in the futures market (130% since December 2013), although from previously low levels. High-frequency trading in the S&P/ASX 200 Index Futures Contract (SPI) accounts for 21% of traded volume and in the Three Year and Ten Year Commonwealth Treasury Bond Futures Contracts (bond futures) it accounts for 14% of traded volume. While these levels do not currently concern ASIC, they are closely monitoring growth
  2. ASIC are conducting inquiries into a number of traders for excessive order entry and cancellation in the ASX 24 market during the quarterly expiries (i.e. the ‘roll’). This practice affects other market users because it prevents the prioritisation of their orders and forces them to cross the spread (i.e. pay more). ASIC has asked ASX to consider what steps may be taken to discourage this practice.

Dark liquidity

  1. There has been a partial shift back to using dark liquidity for its original purpose, namely large block trades to reduce market impact. This is a positive development and, in part, a response to the lowering of block trade thresholds in May 2013
  2. Many of the concerning trends with crossings systems that ASIC identified in 2012 have abated. The reasons for this are likely due to buy-side clients demanding improved standards and ASIC market integrity rules introduced to enhance fairness and improve transparency around the operation of crossing systems
  3. There has been a decline in the use of crossing systems and growth in the use of the exchange dark venues (i.e. ASX Centre Point and Chi-X hidden orders). This is likely a response to the trade with price improvement rule introduced in May 2013, and a lack of price improvement opportunities in crossing systems
  4. There is a trend here and overseas toward exchange and crossing system operators seeking to preference some market users over others (e.g. better or worse order execution priority) for dark trading. These developments have the potential to undermine fair and non-discriminatory trading and may be inconsistent with operators’ obligations. ASIC is unlikely to support any form of preferencing where it unduly favours some market users over others, unfairly limits access to market facilities, or otherwise results in the unfair treatment of orders or market users
  5. ASIC has concerns about how some market participants are managing their conflicts of interest for principal trading and client facilitation. Market participants should review their arrangements to protect clients’ trading intentions, manage conflicts of interest, avoid the risks of insider trading, conduct compliance and supervision and have appropriate incentive structures. They should avoid situations where staff are responsible for the participant’s own trading while having access to unexecuted client orders. Additional controls, including physical separation, should be put in place to manage the conflicts and conduct risk arising from active facilitation

We think high frequency trading is of concern, because it is clear, those who invest in major IT systems to reduce transaction times have significant market advantage – it has become an arms race, where smaller players cannot win. The system is essentially gamed.

The dark side of free markets

From The Conversation.

It is now not uncommon for 11-year-olds to be diabetic. I see one reason for it every time I check out at my local Safeway in Washington. The candy is right there at the cash register, waiting to be eaten.

But this does not mean that the manager of the store is mean or even irresponsible. If she has qualms about this practice, she would face a real dilemma: she needs to show a profit. The margins at supermarkets are tiny. No matter what her morals, she has almost no choice but to place those sweet impulse buys where customers can see them. In other words, there is an economic equilibrium in which businesses take advantage of every opportunity to increase profits. In such an equilibrium, the candy will be at the checkout counter.

Curiously, while economists understand each and every such instance where people are tempted to buy things that are not good for them, they fail to appreciate that this occurs because of a general principle of economics. They fail to understand that free markets, as bountiful as they may be, will not only provide us with what we want, as long as we can pay for it; they will also tempt us into buying things that are bad for us, whatever the costs.

Markets will deceive

Just as free markets can serve the public good “by an invisible hand” (as Adam Smith saw more than two centuries ago, and is the foundation of the field of economics), free markets will do something else. As long as there is a profit to be made, they will also deceive us, manipulate us and prey on our weaknesses, tempting us into purchases that are bad for us. That is also a fundamental feature of market equilibrium, in which supply and demand balance each other out.

My fellow economists, while they recognize such behavior in individual instances, fail to see this as a general principle. And thus a lot of bad things happen, such as the candy at the checkout counter. Most notably, we economists should have been a chorus warning of the financial crash of 2008. We should have recognized that people should not be buying overrated mortgage-based securities, nor should banks have been creating the insecure loans that backed them. Instead there were at most a few lone voices of protest. We should have been more skeptical.

But this is not just about economists and what we think, because through long chains of reportage and other channels (such as this one), what we say in our faculty lounges affects politicians and the public opinion more generally.

This failure to understand that markets have this downside is then passed on into policy more narrowly defined. The public fails to understand that in the economic equilibrium, if there is a profit to be made, someone will take it up, as long as it is legal and as long as there is no public protest against it.

The consequences of being a ‘phool’

Princeton University Press

A recent book we wrote called Phishing for Phools describes how the fundamental logic of economics, going back to Adam Smith, delivers this conclusion. That is, markets are not benign forces working for the greater good but instead are filled with businesses that “phish” by exploiting our weaknesses to get us to buy their products. We are the subjects of those phishes – the “phools” – when we fall for it.

The onus in the book was on us to show that temptations to make bad decisions really do significantly affect our well-being. Such a demonstration was surprisingly easy.

There are four huge areas of our lives – consumer spending, investment, health and politics – in which we are making decisions that no one (on reflection) could possibly want. Yet we make those decisions, and the free market provides them, just as bountifully as it satisfies our more benign impulses.

First, even in the US, as rich as we are by all historical standards, most of us go to bed at night worried about how to pay our bills. We are continually tempted, and have a very hard time sticking to a budget. Thus, the median American family has on average less than one month’s expenditure in its bank account; half of all US respondents in a 2011 survey said they would have a very hard time raising US$2,000 in a month’s time if an emergency occurred; and my rough estimate suggests that 20% of us will go bankrupt at some point over our lifetimes.

Second, there are financial booms and busts because stories – what we are saying to ourselves and what we say to each other when we make our decisions – spread like epidemics. Those stories lead people into bad investments, and then, when those investments go sour, there are declines in confidence that threaten the whole financial system. Humpty Dumpty has a great fall and only slowly is pieced back together again.

Third, regarding health, the market gives us tobacco, which, according to Centers for Disease Control estimates, is responsible for almost 20% of deaths in the United States. The pharmaceuticals industry sells us drugs with unknown long-term effects, which are sometimes severe. And Big Food serves us sugar and fat, so that two-thirds of Americans are overweight, with more than half of them also obese. The list goes on.

Finally, the political system in a democracy is like a market system: there is a competition for votes. But that too has a “phishing equilibrium.” To keep their jobs, politicians have to raise money from “the interests” and use it for TV ads that show what nice folks they really are.

Casinos are another example of how free markets tempt us into doing things we shouldn’t do. Reuters

Prosperity at a steep premium

Free markets may lead to prosperity, but they also deliver more than the unalloyed benefits ascribed to them. This unwillingness to acknowledge their dark side undergirds the basic fundamental thinking of economists and leads to bad government policies. A grownup’s view of the economy that incorporates the downsides of capitalism is a prerequisite for sane policy.

The economic system works as well as it does not just because of individual incentives, but also because a whole raft of individual heroes, social agencies and government regulation puts limits on this downside of markets to phish us for phools. Such policy is a balancing act, to filter out the bad sediment while allowing through the true benefits of free markets.

This view of a phishing equilibrium thus challenges current economic thinking in a new way. There is a huge payoff to incorporating it into our view of the economy. Just as we love our children, we should love free markets; but as with our children, it would be a mistake to think that they can do no wrong.

Authors: George A Akerlo, University Professor, Georgetown University; Robert J Shiller,Professor of Economics, Yale University.

IMF Says Financial Stability Risks Rotating to Emerging Markets

The IMF has released the October 2015 Global Financial Stability Report.

Financial stability has improved in advanced economies since April, but risks continue to rotate toward emerging markets. The global financial outlook is clouded by a triad of policy challenges: emerging market vulnerabilities, legacy issues from the crisis in advanced economies, and weak systemic market liquidity. Although many emerging market economies have enhanced their policy frameworks and resilience to external shocks, several key economies face substantial domestic imbalances and lower growth. Recent market developments such as slumping commodity prices, China’s bursting equity bubble and pressure on exchange rates underscore these challenges. The prospect of the U.S. Federal Reserve gradually raising interest rates points to an unprecedented adjustment in the global financial system as financial conditions and risk premiums “normalize” from historically low levels alongside rising policy rates and a modest cyclical recovery.

Only some markets show obvious signs of worsening market liquidity, although dynamics diverge across bond classes. The current levels of market liquidity are being sustained by benign cyclical conditions and accommodative monetary policy. At the same time, some structural developments may be eroding its resilience. Policymakers should have a policy strategy in hand to cope with episodes of dry ups of market liquidity. A smooth normalization of monetary policy in advanced economies and the continuation of market infrastructure reforms to ensure more efficient and transparent capital markets are important to avoid disruptions of market liquidity in advanced and emerging market economies.

Corporate debt in emerging markets quadrupled between 2004 and 2014. Global drivers have played an increasing role in leverage growth, bond issuance, and corporate spreads. Higher leverage has been associated with, on average, rising foreign currency exposures. The chapter also finds that despite weaker balance sheets, firms have managed to issue bonds at better terms as a result of favorable financial conditions. The greater role of global factors during a period when they have been exceptionally favorable suggests that emerging markets must prepare for the implications of global financial tightening.

The Future of Capital Markets in a Digital Economy – Blockchain Disruption

In a speech by Greg Medcraft, Chairman, Australian Securities and Investments Commission he discusses digital disruption in capital markets. He rightly identifies blockchain technology as one of the most significant disruptive elements of all.

Regulators globally are facing new challenges brought by structural change and digital disruption. There are both opportunities and challenges posed – it is about harnessing the opportunities while mitigating the risks.
I believe that the great drawcard of digital disruption is the opportunity it brings. The markets are seeing this with global investment in fintech ventures tripling to US$12.2 billion in 2014, from US$4 billion in 2013.
It is nothing new when you think about innovations like credit cards and ATMs, which were developed by banks to facilitate customer access. But now, new developments are going beyond the banking system directly to the customer.Businesses have seen the potential for new ways of directly creating and sharing value with technologically savvy investors and consumers. Examples include:

  1. peer-to-peer lending and market-place lending
  2. robo-financial or digital advice
  3. crowdfunding
  4. payments infrastructures (e.g. digital currencies, Apple Pay).
  5. In the future, we will likely see further developments in insurance priced to reflect deeper understanding of individual risk characteristics, in areas such as home, life and car insurance (such as the use of telematics by QBE’s Insurance Box).
  6. Importantly, there is much work going on globally exploring the potential of blockchain technology.

All these innovations have the potential to change the way that investors and financial consumers interact with financial products and payments. But many of these activities may not fit neatly within existing regulatory frameworks or policy. The challenge for us will be to ensure that we continue to deliver on the priorities I mentioned earlier – investor and consumer trust and confidence and fair, orderly, transparent and efficient markets – in the face of these developments.

Potential that these developments have for capital markets – To help understand what this challenge means to us, I’d like to talk in more detail about blockchain technology. This technology – if it takes off as I think it will – has the potential to fundamentally change our markets and our financial system.

What is blockchain technology? Chances are you have heard about bitcoin – the digital currency. ‘Blockchain’ is the algorithm behind bitcoin that allows it to be traded without a centralised ledger. In basic terms, it is an electronic ledger of digital events – one that’s ‘distributed’ or shared between many different parties. And it maintains a continuously growing list of data records. It has three key features:

First, it is a vehicle for transferring value and holding records – each transaction or record is evidenced by a unique data set or ‘block’ that attaches to the continuously growing blockchain.

Second, it does not involve a central authority or third-party intermediary overseeing it or deciding what goes into it. The computers that store the blockchain are decentralised and are not controlled or owned by any single entity.

Third, every block in the ledger is connected to the prior one in a digital chain algorithm. So the record of every transaction lives on the computers of anyone who has interacted with it, and is updated with each entry. The continual replication and decentralised nature makes it secure.

How can blockchain transform capital markets? – I see four reasons.

First, efficiency and speed. At present, when investors buy and sell debt and equity securities or transact derivatives, they generally rely on settlement and registration systems that take sometimes several days to settle trades. It can take even longer, sometimes, where the trade involves cross-border parties. Blockchain holds potential to automate this whole process.

Second, disintermediation. Blockchain automates trust; it eliminates the need for ‘trusted’ third-party intermediaries. In the traditional market, buyers and sellers can’t automatically trust each other, so they use intermediaries to help give them the comfort they need. With blockchain, the decentralised ledger offers this trust. Investors can deal with each other and with issuers in private markets directly.

Third, reduced transaction costs. By eliminating the need to use settlement and registration systems and other intermediaries, there is significant potential to reduce transaction costs for investors and issuers. A June report backed by Santander InnoVentures, the Spanish bank’s fintech investment fund, estimated that blockchain could save lenders up to $20 billion annually in settlement, regulatory, and crossborder payment costs.

Fourth, improved market access. Because of the global nature of blockchain, global markets have the potential to become even more easily accessible to investors and issuers; therefore making it easier for investors and for issuers to invest in and issue debt and equity securities.

Naturally, harnessing this potential will depend on the integrity, capacity and stability of blockchain technology and processes. It will also depend on industry’s willingness to invest in, and make use of, new ways of settling and registering transactions. The potential is, nonetheless, enormous. Industry is seeing that potential and is looking to see how it and the markets might benefit.

Blockchain developments – Let me touch on four areas where the benefits of blockchain are being explored:

The first is in share, loan and derivative trades. A series of start-ups are looking to use blockchain to execute and settle securities and derivative trades.

The second is in private equity transactions. The US stock exchange, NASDAQ, is experimenting with using blockchain technology as a way of recording private equity transactions. In doing so, it hopes to provide ‘extensive integrity, audit ability, governance and transfer of ownership capabilities’.

The third is in government bond trades. A US firm is developing a way to use blockchain to record and settle short-term government bond trades on a distributed ledger.

The fourth is in money transfer. In Mexico City a firm has developed an app that lets migrants send money via the blockchain to Mexico and withdraw cash from ATMs.

How regulators are responding – I have talked about the opportunities blockchain offers. But, as I have said, these opportunities can also threaten our strategic priorities of investor trust and confidence and fair, orderly, transparent and efficient markets.  Right now, we don’t know exactly how blockchain or other disruptive technologies will evolve. But, for now, it is fair to say that they will. Blockchain potentially has profound implications for our markets and for how we regulate. As regulators and policymakers, we need to ensure what we do is about harnessing the opportunities and the broader economic benefits – not standing in the way of innovation and development. At the same time, we need to mitigate the risks these developments pose to our objectives. We also need to ensure those who benefit from the technology trust it. And, at the end of the day, we are working to ensure that investors and issuers can continue to have trust and confidence in the market.

How ASIC is responding to digital disruption? – ASIC’s role in ensuring that we harness the opportunities while mitigating the risks covers five key areas:

First, education. We are supporting investors and financial consumers in understanding the opportunities and the risks of participating in the digital economy. For example, our MoneySmart website, which last year received over 5 million visits.

Second, guidance. We are engaging with and providing guidance to industry in these areas. I want to mention two particular activities:
– The first is our cyber resilience work. We have undertaken significant work in the area of cyber resilience. Cyber resilience is the ability to prepare for,
respond to and recover from a cyber attack. In March this year, we published guidance for businesses to help in their efforts to improve cyber resilience and manage their cyber risks.
– The second is our Innovation Hub – we launched this last year. Much innovation in financial services comes from start-ups and from outside the regulated sector. The Innovation Hub is designed to make it quicker and easier for innovative start-ups and fintech businesses to navigate the regulatory system we administer. The Innovation Hub – which also includes our new industry-led Digital Finance Advisory Committee – also provides us with important information about the developments that are on the horizon, and how they might fit into the current regulatory framework.

Third, surveillance. We monitor the market and understand how investors use technology and financial products and the risks that arise. We undertake continual scans of the landscape, including developments overseas, to better understand new developments, the pace of change and emerging risks that may be posed by structural change driven by digital disruption. In the case of blockchain, there is a need for regulators to focus on and understand a number of issues, including:
– how blockchain security might be compromised
– who should be accountable for the services that make the blockchain technology work
– how transactions using blockchain can be reported to and used by the relevant regulator.

Fourth, enforcement. Of course, where we detect misconduct by our gatekeepers, we will take action. Our challenge here will be to understand how regulatory action can be taken where a transaction entered into here or overseas is recorded in the blockchain.

Fifth, policy advice. Ensuring the right regulation is in place to protect investors and keep them confident and informed, while also not interfering with innovation.

We also need to ensure that rules are globally consistent and regulators can rely on each other in supervision and enforcement with such developments. We will continue to review the current regulatory framework, analyse how new developments, such as blockchain, may fit into the framework and identify where changes may be required.

How IOSCO is responding – IOSCO too has a key role to play in this area, especially in ensuring that there is a global strategy in place and that cooperation between regulators is in place – in order to meet the challenge of addressing issues arising from cross-border transactions. IOSCO’s work plan this year in this area includes the following four priorities:

The first is working to identify and understand risks flowing from digital disruption to business models. In fact, the IOSCO Board will be holding a stakeholder
roundtable next month in Toronto to discuss financial technology developments and regulatory responses.

The second is in the international policy space. This is about designing regulatory toolkits and responses that are flexible, creative, and provide incentives for financial technology innovation that drive growth without undermining investor and financial consumer trust and confidence in our markets.An example of this is work we are considering on crowdfunding.

The third is in the area of cyber resilience. We are working with the Committee for Payments and Market Infrastructures to develop guidance that will help strengthen the cyber resilience of financial market intermediaries.
We expect this guidance to be finalised next year.

The fourth is on strengthening cooperation. We are working on enhancements to IOSCO’s Multilateral Memorandum of Understanding – or MMOU – to deal with the new technological environment in which we are operating.
The MMOU is a cooperation arrangement that enables 105 regulators to share information to combat cross-border fraud and misconduct. These enhancements will make it easier for us to take action in relation to cross-border transactions.

Market volatility is here to stay, but high-frequency trading not all bad

From The Conversation.

The volatility on global equity markets in August was at its highest since 2011. On Black Monday (August 24, 2015), the Dow Jones Industrial Average fell by more than 1,000 points and the S&P500 index plummeted 5.3% in the first four minutes after the opening. During the first 30 minutes, more than two billion shares were traded and, over the morning, the market quickly recovered about half of what was lost during the first four minutes.

The CBOE Volatility Index (VIX) also known as the fear index peaked that day at 40.74. During less stressful times in the market, VIX values are usually below 20. Values greater than 30 are generally associated with high levels of volatility. For example, during the global financial crisis, the index reached an intraday high of 89.53 on October 24, 2008.

Chicago Board Options Exchange SPX Volatility Index 2014-15 Bloomberg Business

The speed of adjustments in the market during the last few weeks have seen many market commentators question whether the higher level of volatility is the “new normal”. For instance, the former European Central Bank President Jean-Claude Trichet suggests that “we have to live now with much higher, high-frequency level volatility”.

Things change

What has changed and who are the market participants that are contributing to the high-frequency volatility that we are observing?

The chiefs of banking giants Commonwealth Bank and ANZ have laid the blame on high-frequency traders. ANZ chief Mike Smith argues HFT is a problem because it’s moving the market “very, very dramatically both ways”.

High frequency traders use computers and complex algorithms to move in and out of stocks very quickly. These movements are typically milliseconds apart, involving the trading of very large volumes of shares. Some market commentators believe HFT has intensified the recent volatility by causing the market to react rapidly to news that may not be significant. In response to the market swings that we are currently experiencing, some argue that the reactions observed are much more volatile than what is expected.

HFT and market quality

Doug Cifu, the co-founder of one of the largest electronic market making firms in the world and biggest high-frequency trading firm, Virtu, has defended the role of HFT. Virtu trades about 11,000 financial instruments in 225 markets across 35 countries. Cifu argues that HFT does not cause volatility but absorbs volatility as they participate in the market as a market maker. Market makers help the trading process by acting as the counterparty when others want to trade, and earn a fee in the process.

High-frequency trading firms have argued they provide liquidity to investors and make trading cheaper by reducing spreads between bids and offers across the markets.

My colleagues and I at the University of Western Australia Business School and University of Nagasaki studied the effects of HFT on liquidity on the Tokyo Stock Exchange. We found evidence to support the argument that trading by high-frequency trading firms improves market quality during normal market conditions. This is consistent with prior research conducted using data from the New York Stock Exchange.

However, we found HFT does not improve market quality during periods associated with high levels of market uncertainty. This is particularly worrisome because high frequency traders appear to consume liquidity when liquidity is needed the most.

Actions by regulators

Market operators and regulators have considered different strategies to increase market stability. Some have implemented circuit breakers to halt trading when the market moves by certain percentages, while others have considered imposing transaction taxes on high-frequency traders.

In response to the latest market swings, the China Financial Futures Exchange (CFFE) took a more drastic response by suspending 164 investors who were found to have high daily trading frequency. According to the China Securities Regulatory Commission (CSRC), the trading by these investors is believed to amplify market fluctuations.

In the US, it is estimated that about three-quarters of daily trading is by HFT and ETFs using “slice and dice” type strategies. In an Australian Securities and Investments Commission report released in 2013, HFT is found to account for 27% of total turnover in S&P/ASX200 securities.

These traders are unlikely to go away. It’s now important for us to get a good understanding of what is the new normal. This is what will help regulators in their tough task of monitoring and ensuring market stability.

Author: Marvin Wee, Associate Professor, Accounting and Finance at University of Western Australia

User-pays ASIC model shift costs, but is bad for the public interest

From The Conversation.

The discussion paper released by Assistant Treasurer Josh Frydenberg suggests that businesses be “levied” to pay for a large part of the costs incurred by the Australian Securities and Investment Commission.

At present ASIC is largely funded from consolidated revenue. The new proposal is that industry should pay a much larger share. In essence costs would be shifted from government onto business.

The arguments made in the discussion paper in support of this increase in business taxes are:

  • the Financial System Inquiry suggested it;
  • the change would ensure that the costs of the regulatory activities undertaken by ASIC are borne by those creating the need for regulation (rather than all taxpayers);
  • it would establish price signals to drive economic efficiencies in the way resources are allocated in ASIC;
  • it would improve ASIC’s transparency and accountability.

There are a number of problems with the proposal.

The fact that it was suggested by the Financial System Inquiry is important but not decisive. It seems likely that the Government will pick and choose amongst the recommendations of the Inquiry, supporting some and not others. The recommendation is thus a factor but not a deciding one.

The second argument is far more interesting. The discussion paper pitches the proposal as an example of user pays. The logic is that consumers of financial products need to be protected and that the costs of ASIC providing that protection should be paid by the firms operating in that industry.

By similar logic all consumer product protection undertaken by the ACCC should also be costed out to the industries involved. All food safety protection might be dealt with the same way and all border protection might be farmed out to all international travellers. We would not even need public schools, because students could be charged for the educational services they receive.

Clearly we could operate that way. In effect, our taxation system would not be necessary and it would be replaced by a complex system of user charges. Unfortunately the Minister is not proposing to reduce general taxes, just to raise some specific ones.

The suggestion that the system of levies paid by industry would improve ASIC’s transparency and accountability appears naïve. Under the current arrangements ASIC has to fight for its funding in the budget round with a Finance Department determined to restrain the growth of public spending.

The new proposal shifts ASIC towards a cost-plus framework, overseen by an array of committees to entities it regulates. Thee would still be some budgetary oversight but inevitably the disciplines would be weaker.

The proposal is rather like asking the players before a match to announce publicly how much they were going to pay the referee. It will be difficult for the groups being regulated by ASIC to complain about its spending for fear of potential retribution. Costs are likely to rise as a result.

The way in which the system will be managed creates further problems. Frydenberg proposes setting panels of industry representatives to oversee the ASIC budget proposals. For a minister responsible for reducing red-tape, it is a very unusual proposal. It is complex, it shifts even more costs onto industry, and is likely to be completely ineffective.

Inevitably it will result in groups fighting with each other to shift ASIC’s costs from between categories and ASIC has the potential to set them off against each other. And there will still be some budgetary oversight so there are no savings just costs.

The proposal will have strong support from ASIC and Finance, and will probably succeed. ASIC has lobbied hard to have accepted its cost-plus model of funding raised from the parties it regulates. The Finance Department too will appreciate having more of ASIC’s costs shifted off budget.

However it is not clear that the proposal is in the public interest. It does not reduce costs. It is an increase in business taxes. The budgetary pressure on ASIC will be reduced and ASIC is likely to grow a lot bigger. The mechanisms proposed to raise the funds are also complex and shift further costs onto the industry.

Looking further ahead, if ASIC succeeds in shifting costs onto industry, other regulators will surely follow. The consumer protection functions of the ACCC are almost the same as those of ASIC so it will certainly follow the new funding model.

Separating the regulators from most of the normal disciplines in the budget round could make them lazier, cost-plus operations, but there are also examples in the international experience where by encouraging the regulator and the regulated closer together creates increased potential for regulatory capture.

Author: Rodney Maddock, Vice Chancellor’s Fellow at Victoria University and Adjunct Professor of Economics at Monash University

Value of Managed Funds Fell in June 2015 Quarter

The ABS released their data on the managed funds industry. It shows the impact of recent falls in stocks, and exchange rate movements. At 30 June 2015, the managed funds industry had $2,622.2b funds under management, a decrease of $21.2b (1%) on the March quarter 2015 figure of $2,643.4b. The main valuation effects that occurred during the June quarter 2015 were as follows: the S&P/ASX 200 decreased 7.3%; the price of foreign shares, as represented by the MSCI World Index excluding Australia, decreased 0.1%; and the A$ appreciated 0.6% against the US$.

Managed-Funds-June-2015 At 30 June 2015, the consolidated assets of managed funds institutions were $2,059.9b, a decrease of $18.6b (1%) on the March quarter 2015 figure of $2,078.6b. The asset types that decreased were shares, $29.6b (5%); units in trusts, $4.0b (2%); overseas assets, $2.7b (1%); derivatives, $0.3b (10%) and other non-financial assets, $0.3b (2%). These were partially offset by increases in other financial assets, $7.2b (24%); land, buildings and equipment, $4.1b (2%); short term securities, $2.6b (3%); loans and placements, $2.4b (5%); deposits, $1.3b (0%) and bonds, etc., $0.6b (1%).

Managed-Funds-By-Type-June-2015At 30 June 2015, there were $534.3b of assets cross invested between managed funds institutions. At 30 June 2015, the unconsolidated assets of Superannuation (pension) funds decreased $25.8b (1%), life insurance corporations decreased $6.5b (2%); friendly societies decreased $0.1b (2%) and common funds decreased $0.1b (1%). Cash management trusts increased $1.4b (4%) and public offer (retail) unit trusts increased $1.0b (0%).

Dragging Australia’s financial reporting regime into the 21st century

From The Conversation.

As we come to the end of another financial year end reporting season and await the deluge of impenetrable financial reports, we can only lament that another year has passed and an important reporting mechanism widely used in many international exchanges, is still not with us.

In Australia financial statement information continues to be provided to users in detailed and complex reports, that are not user friendly. These may now be provided electronically in pdf format, but the problem is that the data can’t be extracted electronically; accurately and efficiently. There is a solution which is passing us by.

I am talking about XBRL – which stands for eXtensible Business Reporting Language – and it represents a standardised form of electronic reporting by companies which facilitates the preparation and exchange of financial statement information.

The formats for the preparation of data are now well established and the International Accounting Standards Board publishes a taxonomy that reflects the requirements of International Accounting Standards which are in use in most countries around the world (http://www.ifrs.org/xbrl/ifrs-taxonomy/Pages/ifrs-taxonomy.aspx).

It is required in many countries and if Australia wants to be a financial centre it needs to catch up. In the US the Securities Exchange Commission has since 2011 required all public registrants to file XBRL information. This is no longer new or untried technology and there many companies providing services for the preparation and use of XBRL information.

What are the benefits of XBRL? At a very practical level XBRL is a relatively straight-forward format for sharing financial information. As it uses standardised formats, which financial reports already follow, it allows for software to be developed which extracts relevant information and presents it in formats that makes it more relevant, understandable and facilitates it use.

Importantly, XBRL can make annual reports more transparent and reduces the risk of important information being lost in the notes. Not surprisingly XBRL usage has been found to improve analyst forecast accuracy. Software using XBRL may be proprietary or publicly available for sale, and it may allow sophisticated analysis to be undertaken.

This is simply not possible at the moment as financial data is provided by various data aggregators who manually key data. This naturally limits the amount of data provided and there are potentially issues of accuracy. Requiring firms to provide XBRL information will reduce the cost of data collection and increase the ability for international investors who might otherwise overlook Australian firms.

Australia operates in a global economy and this is part of the membership price. There is evidence that the provision of XBRL information reduces the cost of capital, and this is most pronounced for small, high growth firms that likely have low analyst coverage. So, while the relative costs might be higher for small firms, the benefits might be relatively higher too.

Has there been progress with implementing XBRL? There have been a number of initiatives to bring XBRL to Australia and these envision widespread application, encompassing all companies rather than just listed companies and the provision of information to multiple government agencies, including the Australian Securities and Investments Commission, the Australian Prudential Regulation Authority and the Australian Taxation Office.

This level of ambition while on the face it desirable, has committed us to a long and tortuous negotiations about format rather than achieving outcomes in a timely manner.

Our immediate focus should probably just be on firms listed on the Australian Stock Exchange and including this requirement in their Listing Rules.

Author: Peter Wells, Head of Accounting Discipline Group, Accounting at University of Technology Sydney

It’s the end of the world as we know it…again

From The Conversation.

On “Black Monday” October 19, 1987, the US stock market crashed, losing over 500 points and 22% of its value in a single day. At around the same time, R.E.M. had just broken through as a major act, and their song “It’s the End of the World as We Know It (And I Feel Fine)“ was playing everywhere, getting an extra boost from the events of the day.

In the US, it seemed the ostensible “Reagan era” was coming to an end. The still-evolving neoliberal economic order – based on valuing financial returns over wage increases as a source of demand – had been shown up. Asset bubbles were not to be trusted as a stable basis for an economic policy order.

However, a short-run solution would soon be found. Almost immediately, an untested, newly installed Federal Reserve chairman, Alan Greenspan, would flood the streets with money. The stock market would recover its lost ground over the next year, and resume its ascent – standing today at 15,871.

Since then, over the past 28 years, the global economy has run on bubbles. Since 1987, these have spanned the Mexican peso crisis, the Asian financial crisis, the “tech wreck” or “dot-com” bust, and the global financial crisis itself.

Most recently, just this past Monday, August 24, we have seen history repeat. On “Black Monday 2015″, China’s stock market lost 8.5% of its value. In turn, the People’s Bank of China has taken a page from the Greenspan playbook and flooded markets with money. One can expect the Federal Reserve and US government to approve – as they should. Now is not the time to follow the Euro playbook or worry about export competitiveness. As followed on each of the above crises, lending freely is the route to recovery.

However, one could be excused for wondering how we got here – addicted to bubbles and bail-outs. In this light, one can view the current market situation through three lenses, to get a successively broader take on where we stand today.

How we got from there to here

First, in the short run, a Chinese slowdown has been apparent for some years –- as has been an American recovery. In this light, some flight from Chinese markets and assets was to be expected –- leaving monetary policymakers facing the difficult challenge of engineering a global “soft landing.”

This dilemma echoes the Asian crises of the 1990s: when US growth increased in the mid-1990s, the Greenspan Fed raised interest rates. In response, investors shifted money from Asia to the US –- with early Asian declines over 1997-1998 assuming a self-reinforcing momentum. In recent months, the Yellen Federal Reserve has been aware of the danger of history repeating itself. In this light, Black Monday 2015 will likely see the Yellen Fed back away from its plans to begin raising interest rates next month. This should help revive global markets.

Secondly, in the middle run, China has itself faced over the past decade the challenge of overcoming what former World Bank President Robert Zoellick termed a “middle income trap” –- in which investment-led growth hits an upper bound. To move beyond that limit, China faces the challenge of promoting domestic demand as a new basis for sustained growth. However, measures that would enable such shifts might entail the strengthening labor unions and raising wages and prices – sparking the sort of inflation that Chinese leaders fear may undermine their legitimacy. In this light, we may know how to recover – but reform poses a bigger challenge.

Thirdly, over the long run, we can view this second “Black Monday” as demonstrating the extent to which asset-price bubbles are not a “bug,” but rather a “feature” of the current system.

Eat, drink, trade, repeat. Justin Lane/EPA/AAP

Over the post-World War II Keynesian decades, wage and price growth provided the foundation for sustained demand and growth –- at the ongoing cost of accelerating wage-price inflation. By the early 1980s, governments around the world sought to crack the back of inflation by breaking labour’s market power. For example, in the US and UK, Reagan and Thatcher employed recessionary policies and legal assaults to break unions. In Australia, the Hawke-Keating Prices and Incomes Accord sought a more negotiated route to wage-price stability. Yet, it ultimately took Paul Keating’s “recession we had to have” of the early 1990s to dampen wage pressures.

In this light, one might finally note that Paul Kelly-styled praise for 1980s-1990s market reform in Australia or similar claims for the alleged free market reforms of the Reagan-Thatcher years are more than a little misleading.

We do not live in an era of self-regulating markets. There is no substantive difference between the fiscal accommodation of the wage-price spirals of the 1960-1970s and the monetary accommodation of the asset-price bubbles of the 2000-2010s. In this light, just as Black Monday 1987 may have demonstrated the weakness of relying on asset-price increases to sustain growth, Black Monday 2015 –- coming seven years after the global financial crisis –- demonstrates the difficulty of constructing an alternative order, one that might enable stable growth.

Author: Wesley Widmaier, Australian Research Council Future Fellow at Griffith University

China’s Black Monday and global market turbulence

From The Conversation.

Stock markets all over the world followed China’s lead, plunging into the red and wiping hundreds of billions of dollars off of share values. But, while it’s tempting to lay the blame entirely at China’s door, a look at the global economy and markets shows Western markets have been overvalued and were due a correction.

Equities are risky assets and do not go up forever in straight lines, so corrections can be fast and furious at times. This acts as a useful reminder to investors that stocks are risky assets.

Stock markets in recent years have benefited from market-friendly monetary policies. There have been three rounds of quantitative easing from the Federal Reserve, the Bank of Japan and more recently the European Central Bank. There have for some time been concerns about the outrageous valuation of shares of certain US companies, including Facebook, Twitter, Tesla, GoPro, Netflix and Amazon. Both short-term and long-term interest rates globally have been artificially low for record periods. This unusual era of money printing and low interest rates has boosted asset prices – not just stocks, but also property prices in major towns and cities around the globe.

More interestingly, until this correction, the current bull market has been extremely unusual in that it has been one of the longest ever periods recorded (48 months) without a 10% correction in the S&P 500 index. The green candles in the chart below show the index being up for the month red candles represent it down for the month. The previous longest periods were October 1990-October 1997 (84 months) and March 2003-October 2007 (54 months). The large red candle at the end represents the most recent drop.

Monthly movements in the S&P 500 index from February 2009. XXXX

Another sign that US stocks had become overvalued was the fact that the price-to-earnings ratio, which measures a company’s current share price relative to its earnings per share, was approaching 19 to 20 times earnings – historically it averages 16.

Price to earnings ratio on the S&P 50. XXXX

If we were to use Robert Shiller’s ten-year cyclically adjusted ratio, the market is even more overvalued at 24 times ten-year average earnings, typically the long term average is 15. By giving a long-term average of earnings, the Shiller ratio better reflects a firm’s long-term earning power.

Prospective ten-year annual returns were likely to be in the region of just 1-3%, which is too low to compensate investors for holding risky assets. The recent fall in US and other stock markets will help improve future prospective US stock returns to a low, but more healthy, 3-5% range.

Ten-year average price earnings ratio on the S&P 500. XXXX

What about China?

The current sell-off is probably related to events in China – there, the stock market clearly entered bubble territory some months ago. Chinese stocks were rising despite the economy clearly slowing and it was selling at price-to-earning ratios that made no economic sense even if you believed in a 7% growth story.

The Chinese economy is in much greater difficulty than the Chinese government has been prepared to admit to date. That is why recent devaluations of the renminbi have been a catalyst for the recent global stock market correction. It is an admission by the Chinese that their economy is in serious trouble, and represents an attempt to boost the economy through an increase in exports at the expense of some of their competitors.

The Chinese economy is the second-biggest economy in the world after the US, so trouble there also spells trouble for the global economy. The attempts by the Chinese government to prop up their stockmarket were doomed to fail and in recent days this has become very clear.

Closer to home

Another reason for the global stock market sell-off is that the US Federal Reserve has been getting closer to raising interest rates from their artificially low target range of 0 to 0.25%. Some market participants are clearly trying to get out of the market before any rise, which is now unlikely to happen in September.

The low interest rates have led to US companies issuing record amounts of debt, not so much to finance future growth but to buy back their own shares to artificially raise their earnings per share. This can work in the short-run, but not in the long run. Raising the leverage (debt-to-equity ratio) of US stocks increases their riskiness and therefore their potential for volatility. This is precisely what we are now witnessing.

Three-month US treasury bill interest rates. XXXX

The obvious question is what the recent turbulence implies for investors and companies. Should they stay put, or be worried that we are facing a similar crisis to the 2007-08 crash? The good news is that US stocks are nowhere near as overvalued as in the 2001 and 2007 although they should be wary of some of the most obscenely overvalued stocks mentioned earlier.

The Chinese stock market remains overvalued (still some 60 times their earning value) and the economy is in deep trouble. Even US stocks are still highly valued using the Shiller measure. This means global stocks will remain under pressure.

The turbulence we have witnessed is likely to continue, but rallies both ways tend to happen very quickly. Interest rates remain extremely low and will act as a future drag on the market as and when they rise. Companies should also be concerned about a wider slowdown in the global economy hitting their earnings, as China is now the world’s second largest importer of commodities, goods and services.

Author: Keith Pilbeam, Professor of Economics at City University London